


Abstract
The extensive development of image fusion techniques over the past 20 y has shown that the fusion of images from complementary modalities offers a more complete and accurate assessment of disease than do images from a single modality. Although software techniques have been successful in fusing images of the brain from different modalities, they have achieved rather limited success for other parts of the body. The recent introduction of technology that can acquire both anatomic and functional images in a single scan has addressed many of the limitations of software fusion. The combination of CT and PET was introduced commercially in 2001, followed by CT and SPECT in 2004. Clinical adoption of PET/CT has been surprisingly rapid, and despite continuing debate, the new technology has advanced the use of clinical molecular imaging, particularly for oncology.
Structure without function is a corpse…function without structure is a ghost.
—Stephen Wainwright
Although a single imaging modality can offer some insight into a disease process, it is often a combination of 2 or more modalities that eventually provides a diagnosis. Traditionally, such imaging has been performed at different times, in different places, and on different equipment. Even when the temporal difference between scans is small, alignment of images acquired on 2 different scanners is a complex procedure, particularly when regions of the body outside the brain are involved. Different patient positioning and involuntary movement of internal organs demand nonlinear mapping techniques to align the various imaging modalities with any success.
An alternative to software fusion, now termed the hardware approach, that addresses many of these difficulties is a combination of 2 (or more) modalities within a single device that acquires the different images either simultaneously or sequentially without moving the patient from the bed. This design essentially eliminates differences in patient positioning and also minimizes misalignment due to involuntary internal organ motion. The approach was pioneered in the early 1990s by Hasegawa et al. at the University of San Francisco, who placed a clinical CT scanner in tandem with a SPECT camera as the first clinical SPECT/CT device (1). The first commercial design, the Hawkeye (GE Healthcare), combined a low-power x-ray source with a standard SPECT camera (2,3).
A similar concept of combining PET with CT was suggested independently in 1991, although a working prototype PET/CT scanner was not completed until 1998 (4). Despite some obvious concerns at the time with operational issues, cost, complexity, and reliability, commercial exploitation of the PET/CT concept followed within 3 y, the first designs appearing in medical centers by early 2001. The first combined SPECT/CT design incorporating a fully clinical multidetector CT scanner was launched in 2004, although even today, 90% of SPECT/CT installations are still based on the Infinia Hawkeye (GE Healthcare).
A common feature of all these designs is the combination of molecular imaging (PET or SPECT) with high-quality anatomic imaging (CT). The evident success of PET/CT and SPECT/CT suggests a potential role for PET/MRI, a detector development more technically challenging than the other modalities. Given the rapid evolution of hybrid technology over the past 6 y, it is worthwhile reviewing the current status of these modalities and assessing future prospects. However, in view of space limitations, this article will focus primarily on PET/CT as the more mature of the hybrid technologies.
THE SOFTWARE APPROACH
A thorough discussion of the topic is beyond the scope of this paper. However, it is instructive to review some of the principles of software fusion and the level of success that has been achieved; a more extensive review has been published elsewhere (5). Two image sets are fused either by identifying common landmarks or fiducials that can then be aligned or by optimizing a metric based on image intensity values. Whatever the method, the number of possible degrees of freedom between the 2 image volumes defines the complexity of the subsequent transformation. For distributions that do not involve a change in shape or size, rigid-body transformations are adequate. When shears (or a nonisotropic dilation without shear) are involved, an affine transformation comprising a linear transformation and translation is indicated. When there are no constraints on the deformation, a nonlinear (warping) transformation is used. Most currently used methods are intensity-based, and images are coregistered by assessing the intrinsic information content. Metrics include intensity ratios (6) and mutual information (7). Although such techniques have shown great success in aligning images of the brain acquired with CT, PET, SPECT, and MRI, they have been less successful in other parts of the body. Earlier clinical assessments in the lung (8) and pelvis (9) were disappointing, demonstrating a local registration accuracy of 5–8 mm, compared with an accuracy of about 2 mm that can be achieved for the brain (10). A recent review (11) suggests that software fusion can achieve an accuracy of about half a pixel, or 2–3 mm, for some studies even though clinical results from more recent generations of fusion software have not been particularly encouraging in applications such as recurrent colorectal cancer (12). Software development has nevertheless continued, as illustrated by the publication of an automated warping algorithm to align CT and PET images of the thorax (13).
Until PET/CT appeared in 2001 and coregistered CT and PET images could be routinely generated for all patients, the prevailing view was that fusion of anatomy and function would offer little for most patients. The one exception that was already gaining acceptance even before the advent of PET/CT was the integration of CT and PET into radiotherapy treatment planning (14). PET/CT has facilitated the incorporation of functional images into treatment planning (15). Thus, the development of software fusion techniques continues in both the academic and the commercial environments, and even with PET/CT, SPECT/CT, and eventually MRI/PET available, there will continue to be applications in which software fusion can play an important role (16).
THE HARDWARE APPROACH
One of the earliest devices with the capability to acquire 2 different modalities—CT and SPECT—was developed around 1990 by Hasegawa et al. at the University of California, San Francisco (17,18). Their pioneering device used a single detector of high-purity germanium to acquire both CT and SPECT data (19–21). The difficulty of achieving an acceptable level of performance for both modalities led the group to explore a different design in which a clinical CT scanner was positioned in front of a SPECT camera (1). The CT images were then also used to provide improved partial-volume and attenuation corrections for the SPECT data. The dual-modality device was used for imaging a small number of cancer patients and for radionuclide quantitation of regional myocardial uptake of 99mTc-sestamibi in a porcine model.
The first PET/CT prototype (4) became operational in 1998 and was based on the combination of a single-slice spiral CT scanner (SOMATOM AR.SP; Siemens Medical Solutions) and a rotating PET scanner (ECAT ART; CPS Innovations) (22). This design was unique in that both the CT and the PET components were mounted on a single rotating support within the gantry enclosure. The CT bed was used for both modalities. Data acquisition and image reconstruction were performed on separate computer systems. As with the SPECT/CT developed by Hasegawa et al., the CT images from the PET/CT scanner were used to generate PET attenuation correction factors using an energy-scaling algorithm (23). When a series of 300 patients was imaged, many of the benefits of PET/CT could already be identified (24,25). The replacement of the lengthy PET transmission scan by the more rapid CT scan significantly reduced the whole-body scanning time. PET images could be interpreted with greater accuracy and confidence by using the intrinsically coregistered CT images. Biomarkers such as 18F-FDG that are not specific to a disease are taken up in organs such as brain, heart, liver, intestines, and lungs as a consequence of normal physiology. The coregistered CT images allowed such nonspecific uptake to be identified, thus improving the accuracy of interpretation. With PET/CT, areas of abnormal uptake can be localized to specific morphologic structures such as lymph nodes, further aiding interpretation. Perhaps less obviously, the interpretation of the CT images can potentially be modified or refined by reference to the PET scan; elevated 18F-FDG uptake with a negative CT result is still suggestive of disease. Finally, convenience to the patient and to the operation of the imaging center should not be underestimated. One appointment, one visit to the hospital, and the referring physician has a complete assessment of the anatomic and functional status of the disease.
The first commercial PET/CT scanner was installed in May 2001, just 3 y after the acquisition of PET/CT images at the University of Pittsburgh Medical Center. Since 2001, all major vendors of medical imaging equipment have produced at least one PET/CT design, and the technology has been surprisingly rapidly adopted by nuclear medicine and radiology departments. As a consequence, since 2006 PET/CT sales have completely replaced sales of new PET-only scanners, as shown in Figure 1.

Shipments of PET and PET/CT scanners for U.S. market as recorded by Nuclear Equipment Manufacturers Association for January 2002 to October 2007. Shipments of PET-only scanners declined to zero from January 2006 onward. Overall market for PET or PET/CT remained fairly constant, although since January 2007, with decrease in reimbursement because of introduction of Deficit Reduction Act, sales have declined somewhat.
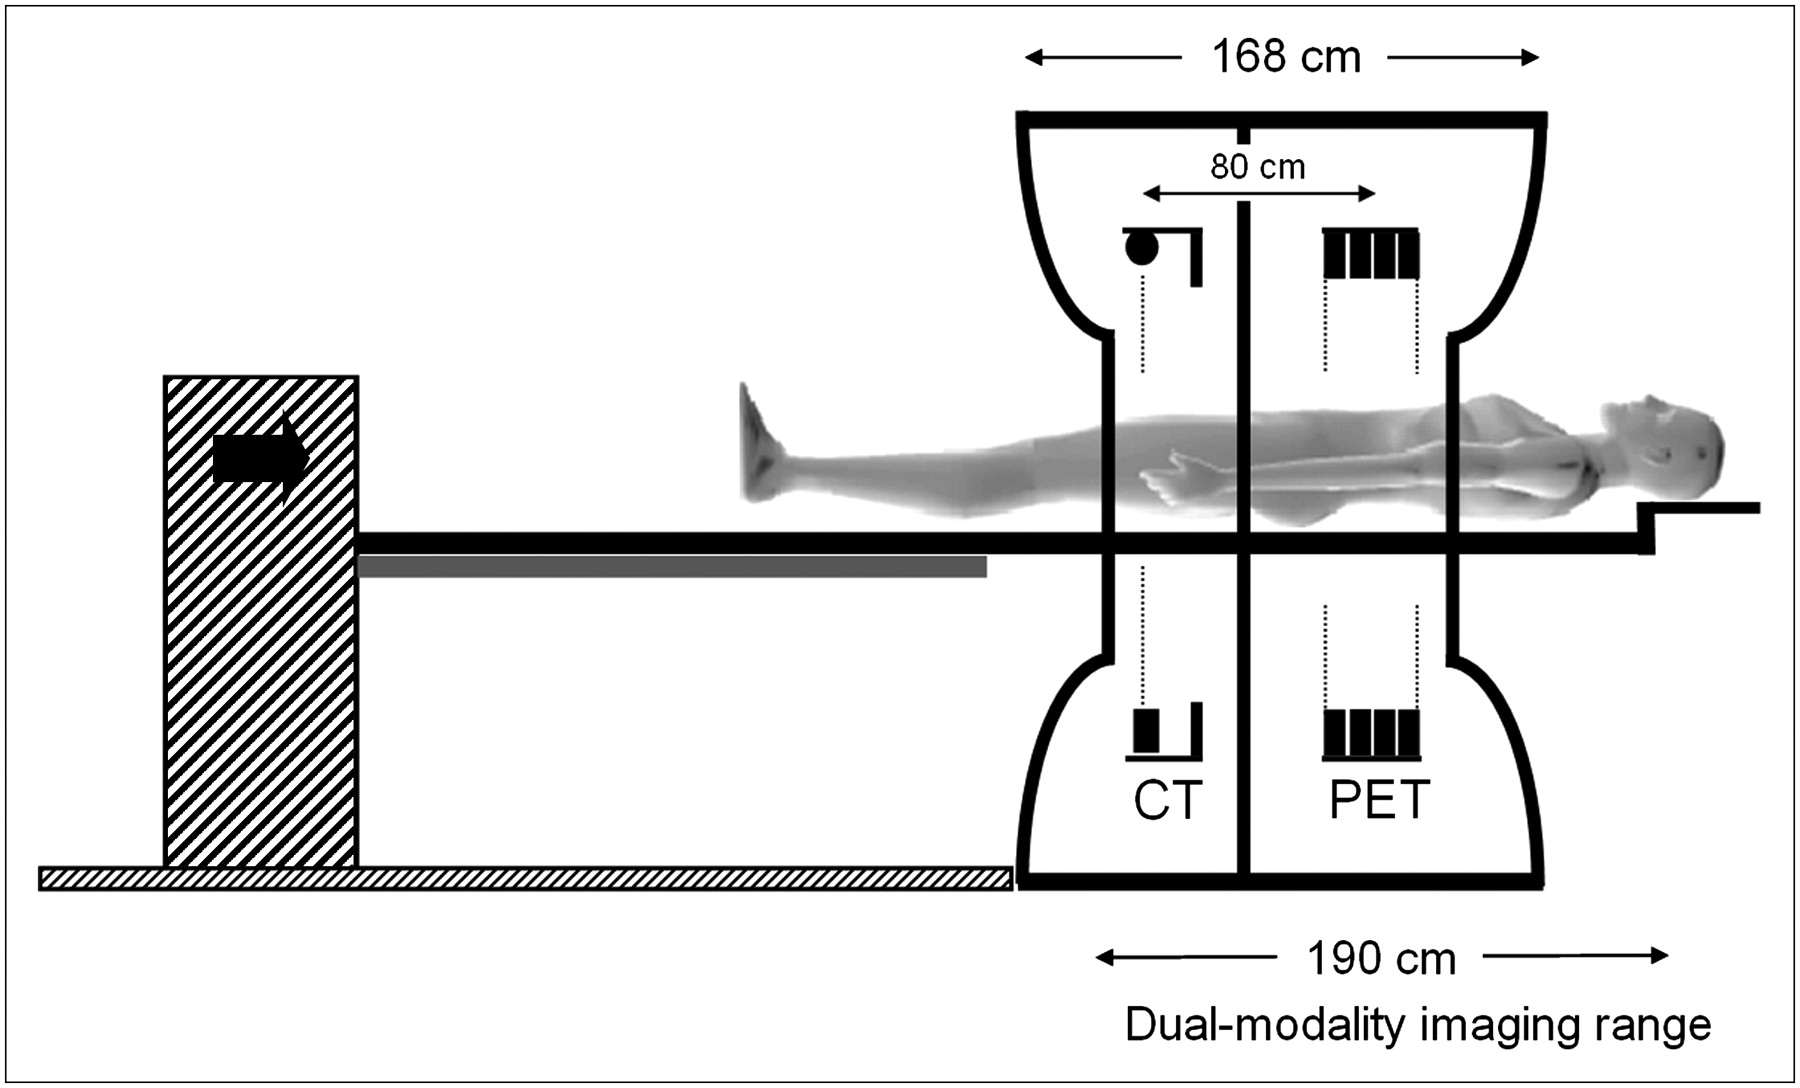
In contrast to the more integrated approach of the initial prototype, current commercial PET/CT designs comprise a multislice spiral CT scanner in tandem with, but separate from, a PET scanner (26,27). During a study, the patient passes first through the CT scanner and then into the imaging field of the PET scanner. A design of a typical commercial PET/CT scanner is shown in Figure 2. Although every effort is made to design a compact system by eliminating the transmission sources and (in some scanners) the retractable septa, the separation of the CT and PET fields is still around 80 cm. However, most PET/CT scanners have at least a 70-cm patient port, thus reducing the potential claustrophobic effect for patients. An important component of the scanner is the patient bed, which must be compatible for both imaging modalities. PET/CT requires a redesign of the standard CT or PET couch for 2 reasons: the travel of the bed (stroke) has to be extended to accommodate the additional separation between the imaging fields, and the downward deflection of the bed from the weight of the patient has to be minimized. The former is important to maximize the commonly scanned range over which both CT and PET can be acquired, and the latter is obviously essential to avoid an increasing downward deflection of the bed as it moves through the scanner. Such a deflection would obviously limit the alignment accuracy, resulting in an intrinsic and patient weight–dependent misregistration between the CT and the PET images. Novel solutions to these problems have been implemented by different vendors, as shown in Figure 3. Deflections of less than ±0.25 mm for a 181-kg (400-lb) patient have been reported.

Schematic of early PET/CT scanner design. CT is positioned in front of PET scanner and centers of imaging fields are separated by 80 cm. To maximize co-scan range (range covered by both CT and PET), movement of bed must include 80-cm FOV separation. Typical co-scan range is 160–190 cm. Patient port is 70 cm, thereby reducing claustrophobic effect of extended gantry dimensions.

Four different solutions to patient handling system that eliminates variable vertical deflection of pallet as it advances into tunnel of scanner. Designs include bed with fixed cantilever point where entire couch assembly moves on floor-mounted rails (A); dual-position bed, with one position for CT and one for PET (B); patient couch that incorporates support throughout tunnel (C); and fixed couch with scanner traveling on floor-mounted rails (D).
ADVANCES IN PET/CT SCANNER PERFORMANCE
The overall performance of a PET/CT scanner is a function of the performance of the individual components—the CT component, the PET component, the patient couch, the computer hardware, and the integrated software system. Advances in the performance of CT and PET scanners have been paralleled by steady progress in the reliability and flexibility of the PET/CT acquisition and display software. After the appearance of single-slice spiral CT scanners in the early 1990s (28), CT performance has improved rapidly with the advent of multidetector arrays. Dual and 4-slice CT scanners first became available around 1998, followed by 16-slice scanners (2002) and, more recently, 64-slice scanners (2004). The increasing number of detector rows (slices) has been accompanied by faster rotation times; state-of-the-art scanners now reach 3 rotations per second. Thus, after many years of slow but steady progress, the past few years have seen significant advances in both hardware and software for CT.
PET scanners have seen even more dramatic improvements in performance over the past decade. As with CT, these improvements are in both hardware and software, including new scintillators, better spatial resolution, higher sensitivity, more accurate reconstruction techniques, and the recent reintroduction of time-of-flight measurements.
New Scintillators for PET
For PET detectors, the 1970s saw the transition from thallium-activated sodium iodide (NaI(Tl)) to bismuth germanate (BGO), a scintillator with higher density and a larger photofraction. The photofraction is the fraction of incident annihilation photons that interact in the scintillator through the photoelectric effect; this is the desired process, in preference to Compton scattering, which may involve multiple interaction points within the detector. Although at least one PET scanner design continued to use NaI(Tl), most PET scanners installed during the 1990s were based on BGO block detectors. In the late 1990s, the introduction of new, faster scintillators such as gadolinium oxyorthosilicate (GSO) (29) and lutetium oxyorthosilicate (LSO) (30), both doped with cerium, improved the performance of PET scanners for clinical imaging. Both GSO and LSO have shorter decay times than BGO by a factor of 6 to 7, reducing system dead time and improving counting rate performance, particularly at high activity levels in the field of view (FOV). The physical properties of these scintillators are summarized in Table 1. Of even more importance for clinical imaging is the potential of faster scintillators to decrease the coincidence timing window, thereby reducing the randoms coincidence rate. The increased light output of the new scintillators improves the energy resolution because the increased number of light photons reduces the statistical uncertainty in the energy measurement. However, other physical effects contribute to the emission process, and the improvement in energy resolution is not a simple function of the number of light photons. The higher light output also increases the positioning accuracy of a block detector, allowing the blocks to be cut into smaller crystals, thereby improving spatial resolution. BGO, LSO, and GSO are not hygroscopic, facilitating the manufacture and packaging of the detectors. GSO is somewhat less rugged and more difficult to machine than either BGO or LSO. LSO has an intrinsic radioactivity of about 280 Bq/mL, with single-photon emissions in the range 88–400 keV. Such a radioactive component is of little consequence for coincidence counting at 511 keV, except at very low emission counting rates.
Physical Properties of Certain PET Scintillators
Improving Spatial Resolution
The physics of positron emission impose certain well-known limitations on the spatial, temporal, and contrast resolution that can be attained in a particular imaging situation. Positron range and photon noncolinearity degrade resolution to an extent defined by the energy of the annihilating positron (a function of the positron-emitting nuclide) and the diameter of the detector ring (D), respectively. The resolution is further limited by the size of the detector elements (d) and a factor (b) that accounts for the block decoding scheme. The relationship between the achievable spatial resolution (∑) and the different contributions is given by the following expression (31): For lower-energy positron emitters such as 18F (Emax = 0.633 MeV), the major contributions to spatial resolution come from the detector size and the noncolinearity of the annihilation photons. In practice, the resolution for clinical imaging is also a function of other factors such as the reconstruction algorithm and the smoothing filter. For a given scanner geometry, PET biomarker such as 18F-FDG, and imaging protocol, the achievable spatial resolution will depend primarily on the size of the detector elements. Higher-resolution detectors reveal increased detail that can potentially change patient management, as shown by the following clinical example.
Figure 4A (right) shows a coronal section of an 18F-FDG PET/CT scan of a patient with head and neck cancer. The study was performed on a scanner comprising LSO detectors 6.4 × 6.4 mm in size (Fig. 4A, left). The study identified disease on the left side of the neck of the patient, who presented with a visually enlarged node originally thought to be a cyst but subsequently found to contain squamous cell carcinoma. The patient also underwent random biopsies and removal of the left tonsil in an unsuccessful attempt to identify the primary tumor. The patient then underwent a second 18F-FDG PET/CT study on a scanner comprising high-resolution, 4 × 4 mm LSO detectors (Fig. 4B, left). The result of the high-resolution scan is also shown (Fig. 4B, right). The new study identified uptake in a node on the right with a standardized uptake value (SUV) of 3.7, as well as in nodes on the left side, including those seen on the lower-resolution scan. The patient underwent a radical neck dissection on the left side and a modified neck dissection on the right that included removal of the right tonsil. The right tonsil was identified as the origin of the primary tumor, suggesting that the disease had crossed the midline and misleadingly appeared in the lymph nodes on the left side. The high-resolution PET/CT scan thus changed the management of the patient, who remains alive and disease-free more than 2 y after the surgery.
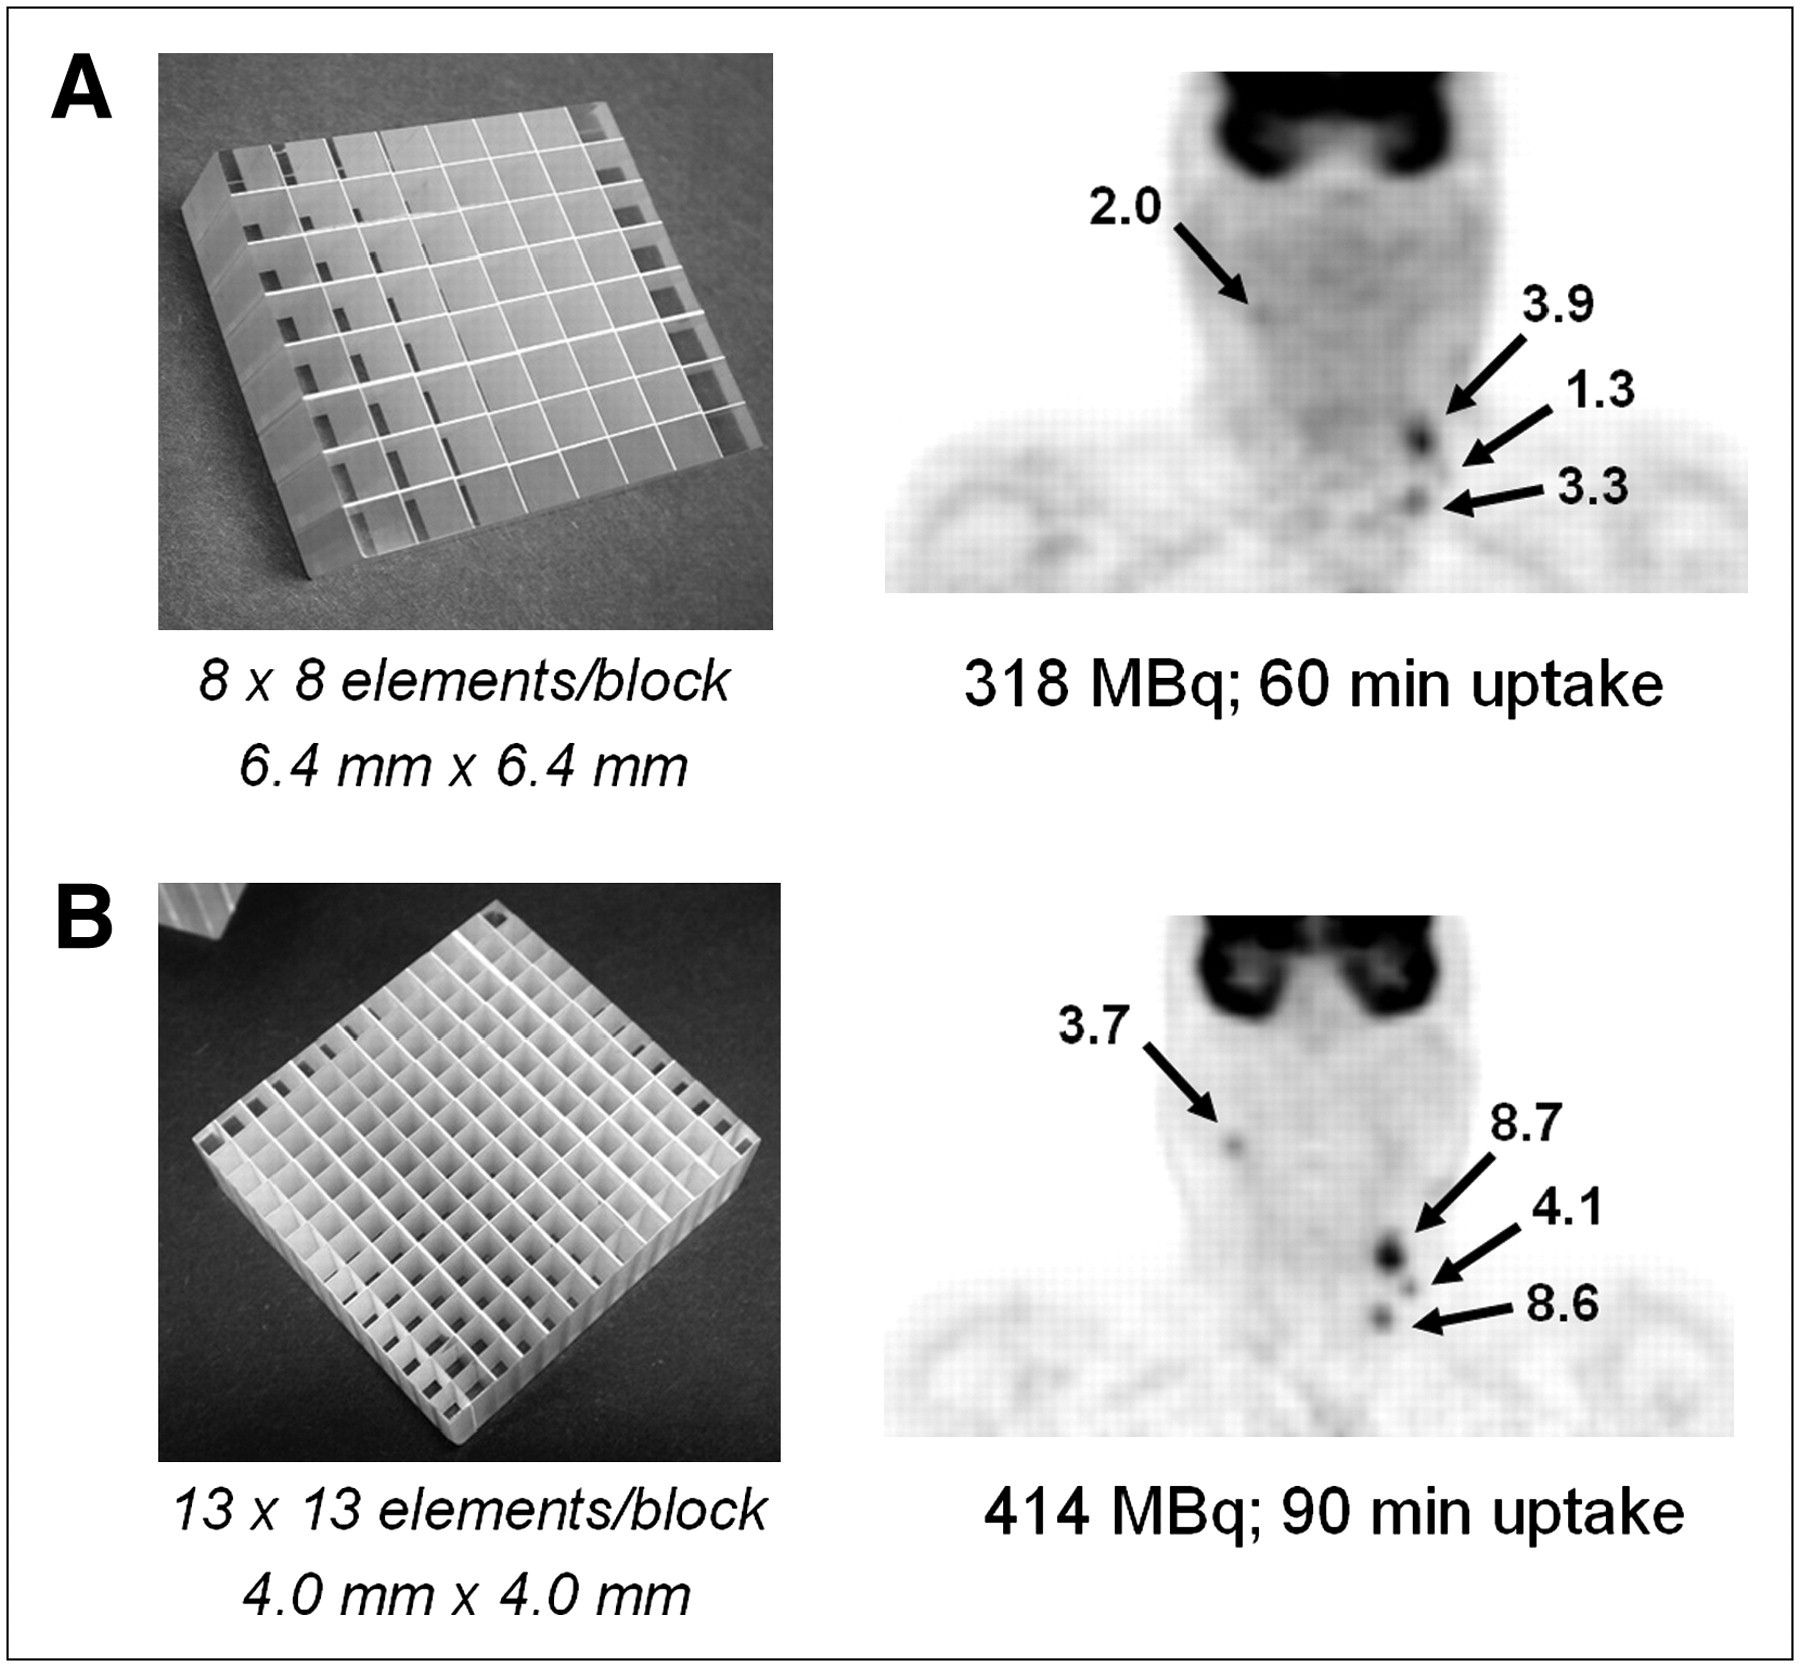
PET/CT scan of patient with head and neck cancer illustrating clinical advantage of increased spatial resolution. (A) Lower-resolution scan demonstrates uptake in 2 left-sided lymph nodes, suggesting primary disease on left. Patient was scheduled for left neck dissection. (B) Higher-resolution scan, however, also demonstrates uptake in right node, suggesting bilateral disease. SUVs for each scan are indicated. Patient therefore underwent bilateral neck dissection, and presence of disease was confirmed on both sides.
This case study illustrates the importance of high-resolution imaging, particularly in head and neck cases such as this one, in which treatment may be affected by the outcome of the scan. It also demonstrates that decreasing the size of the detector elements without necessarily increasing the volume of the scintillator can nevertheless play an important role in clinical imaging.
Increasing Sensitivity
PET is intrinsically a 3-dimensional (3D) imaging methodology, replacing the physical collimation required for single-photon imaging with the electronic collimation of coincidence detection. However, the first multiring PET scanners incorporated septa—lead or tungsten annular shields mounted between the detector rings. The purpose of the septa was to limit the acceptance angle of the incident photons and to shield the detectors from photons that scattered out of the transverse plane, thus restricting the use of electronic collimation to within the plane. Such a limitation, although it makes poor use of the radiation emitted from the patient, allows 2-dimensional (2D) image reconstruction algorithms to be used rather than requiring a fully 3D algorithm. The availability from 1990 onward of BGO scanners with retractable septa encouraged the use of 3D methodology, at least for the brain, where the net increase by a factor of 5 in sensitivity could be realized even with increases in both scatter fraction and randoms (32). The situation for whole-body imaging is far less favorable, in part because of the presence of significant activity just outside the imaging FOV in most bed positions. Instead, particularly for large patients, 2D imaging was often recommended even though higher injected levels of 18F-FDG were required to obtain adequate counting rates. This situation changed in the late 1990s with the appearance of LSO- and GSO-based scanners that could be operated with short coincidence time windows (4.5–6 ns) and higher energy thresholds (400–450 keV) than the 10–12 ns and 350 keV for BGO. Significantly improved whole-body image quality was achieved in 3D mode with a 370-MBq (10-mCi) injection of 18F-FDG. A recommended injected dose of 444–555 MBq (12–15 mCi) corresponds to operation at peak noise equivalent counting rate for an LSO scanner in 3D mode (33). A recent publication (34) compared 2D and 3D operation for an LSO-based PET-only scanner (ECAT ACCEL; Siemens Molecular Imaging). The results demonstrated that under conditions of matched target-to-background ratios, the 3D mode showed significantly less variability than 2D. Since the LSO and GSO PET/CT scanners have no septa and acquire data in 3D mode only, no comparison has been made for PET/CT. However, within the past 2 y, a limited number of yttrium-doped LSO (LYSO)–based PET/CT scanners with retractable septa have been evaluated, and recent publications confirm the results from the ECAT ACCEL (35,36).
The sensitivity of a scanner can also be improved by the addition of more detector material. Planar sensitivity can be increased by extending the thickness of the scintillator (Fig. 5A). In this example, a 50% increase in thickness (20 mm → 30 mm) results in a 40% increase in sensitivity. However, increasing the axial extent by adding 33% more detector material without changing the thickness results in a 78% increase in volume sensitivity (for 3D acquisition with no septa), as shown in Figure 5B. Thus adding extra detector rings more efficiently uses the increased volume of LSO, although in this case, because additional detectors are needed, there will also be an increase in the number of phototubes required. After an injection of a radioactive tracer such as 18F-FDG, the patient receives a radiation dose from all annihilation photons, not just those emitted within the imaging FOV of the scanner. Therefore, the greater the axial coverage, the better use is made of the emitted radiation and the more efficient use is made of a given volume of scintillator. For most PET/CT scanners, axial PET coverage is about 16 cm, with one design having an axial extent of 18 cm and the most recent device offering an extended FOV covering 21.8 cm. The latter comprises more than 32,000 LSO pixels of 4 × 4 × 20 mm and images 109 transaxial planes 2 mm thick in a single position. Data acquisition is in fully 3D mode, and the scanner has a peak noise equivalent counting rate of around 160 kcps (37,38).
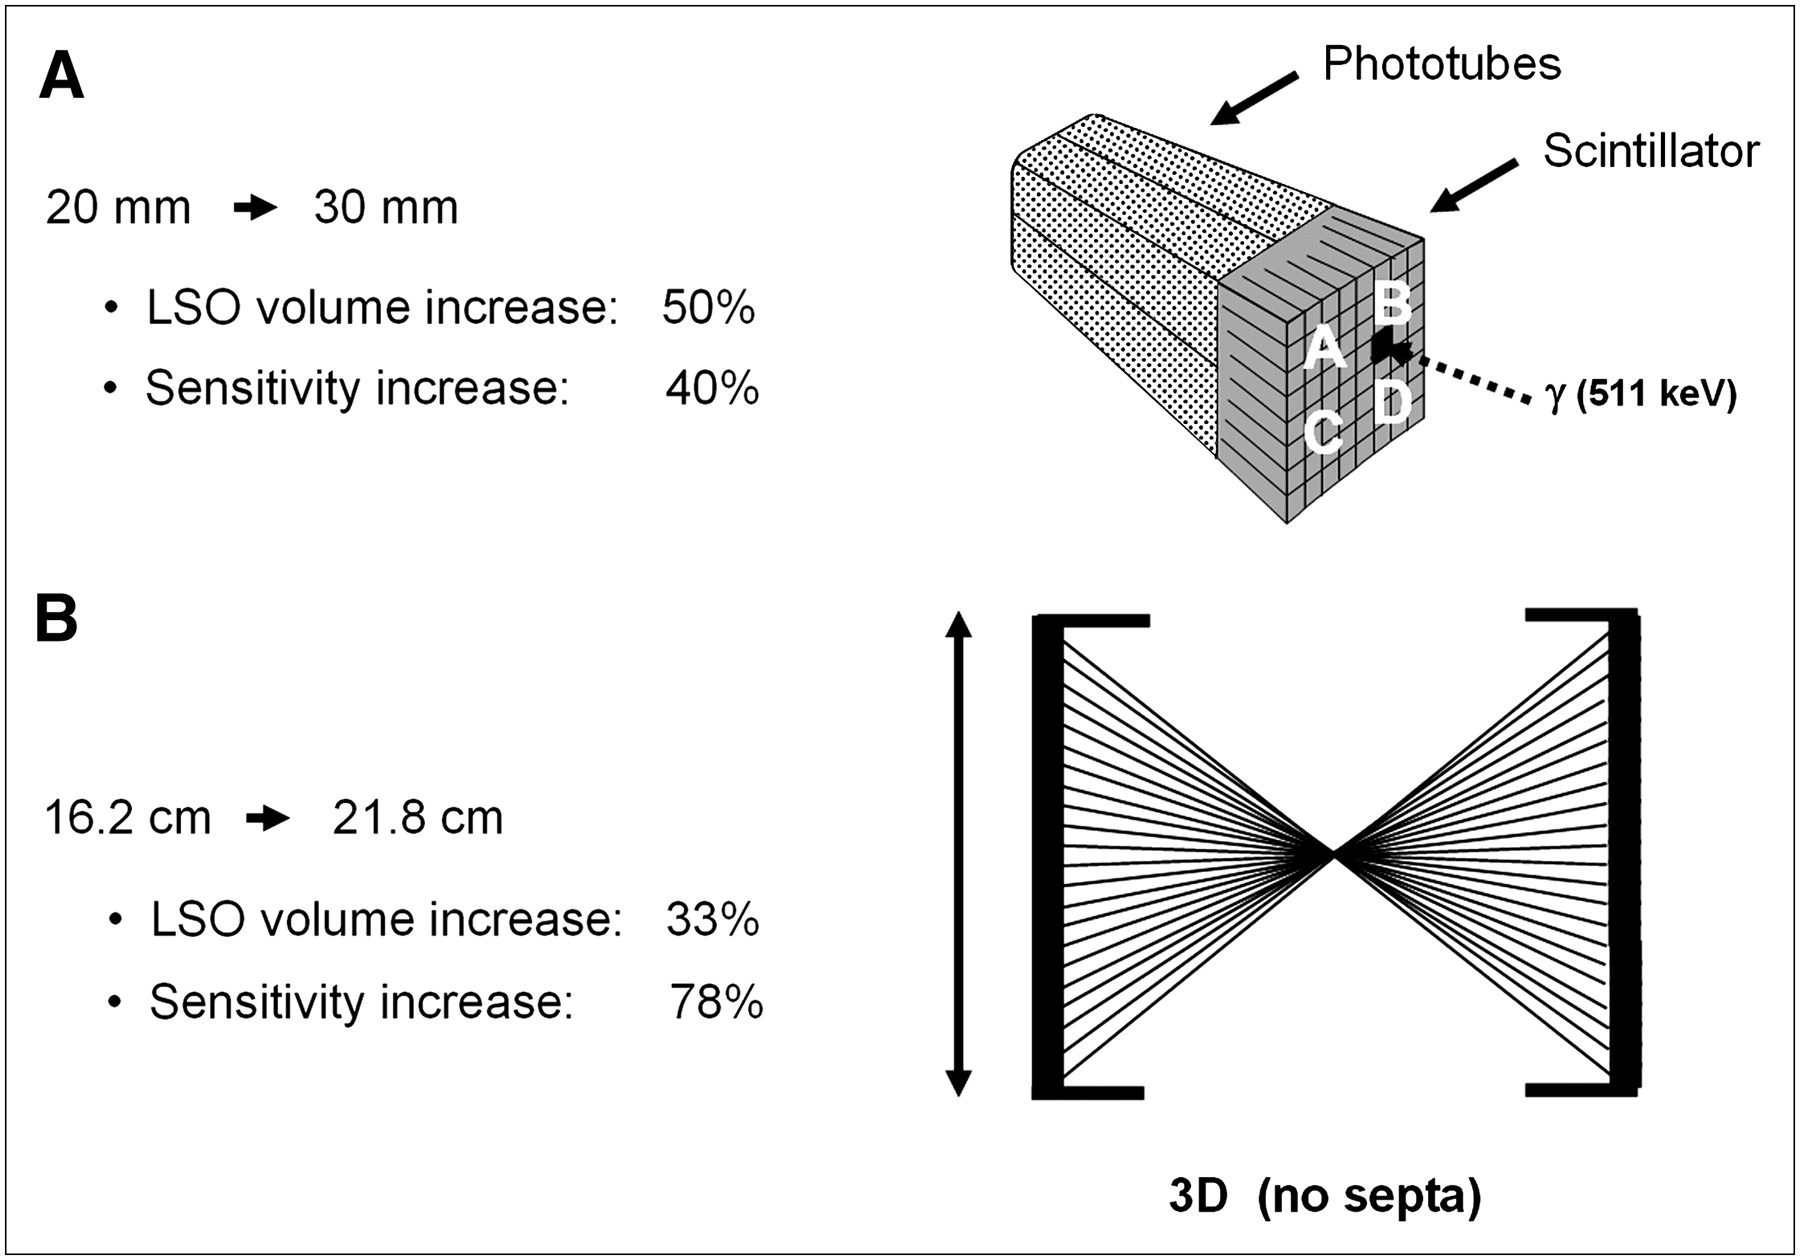
Two methods of improving sensitivity of PET scanner: increasing thickness of scintillator from 20 to 30 mm (A) and increasing axial length of scanner from 16.2 to 21.8 cm (B). Increase in axial extent also implies increase in number of PMTs. For scanner operating in 3D mode, method B will increase sensitivity by relative factor of 2 over method A, with 40% less LSO.
Time-of-Flight PET
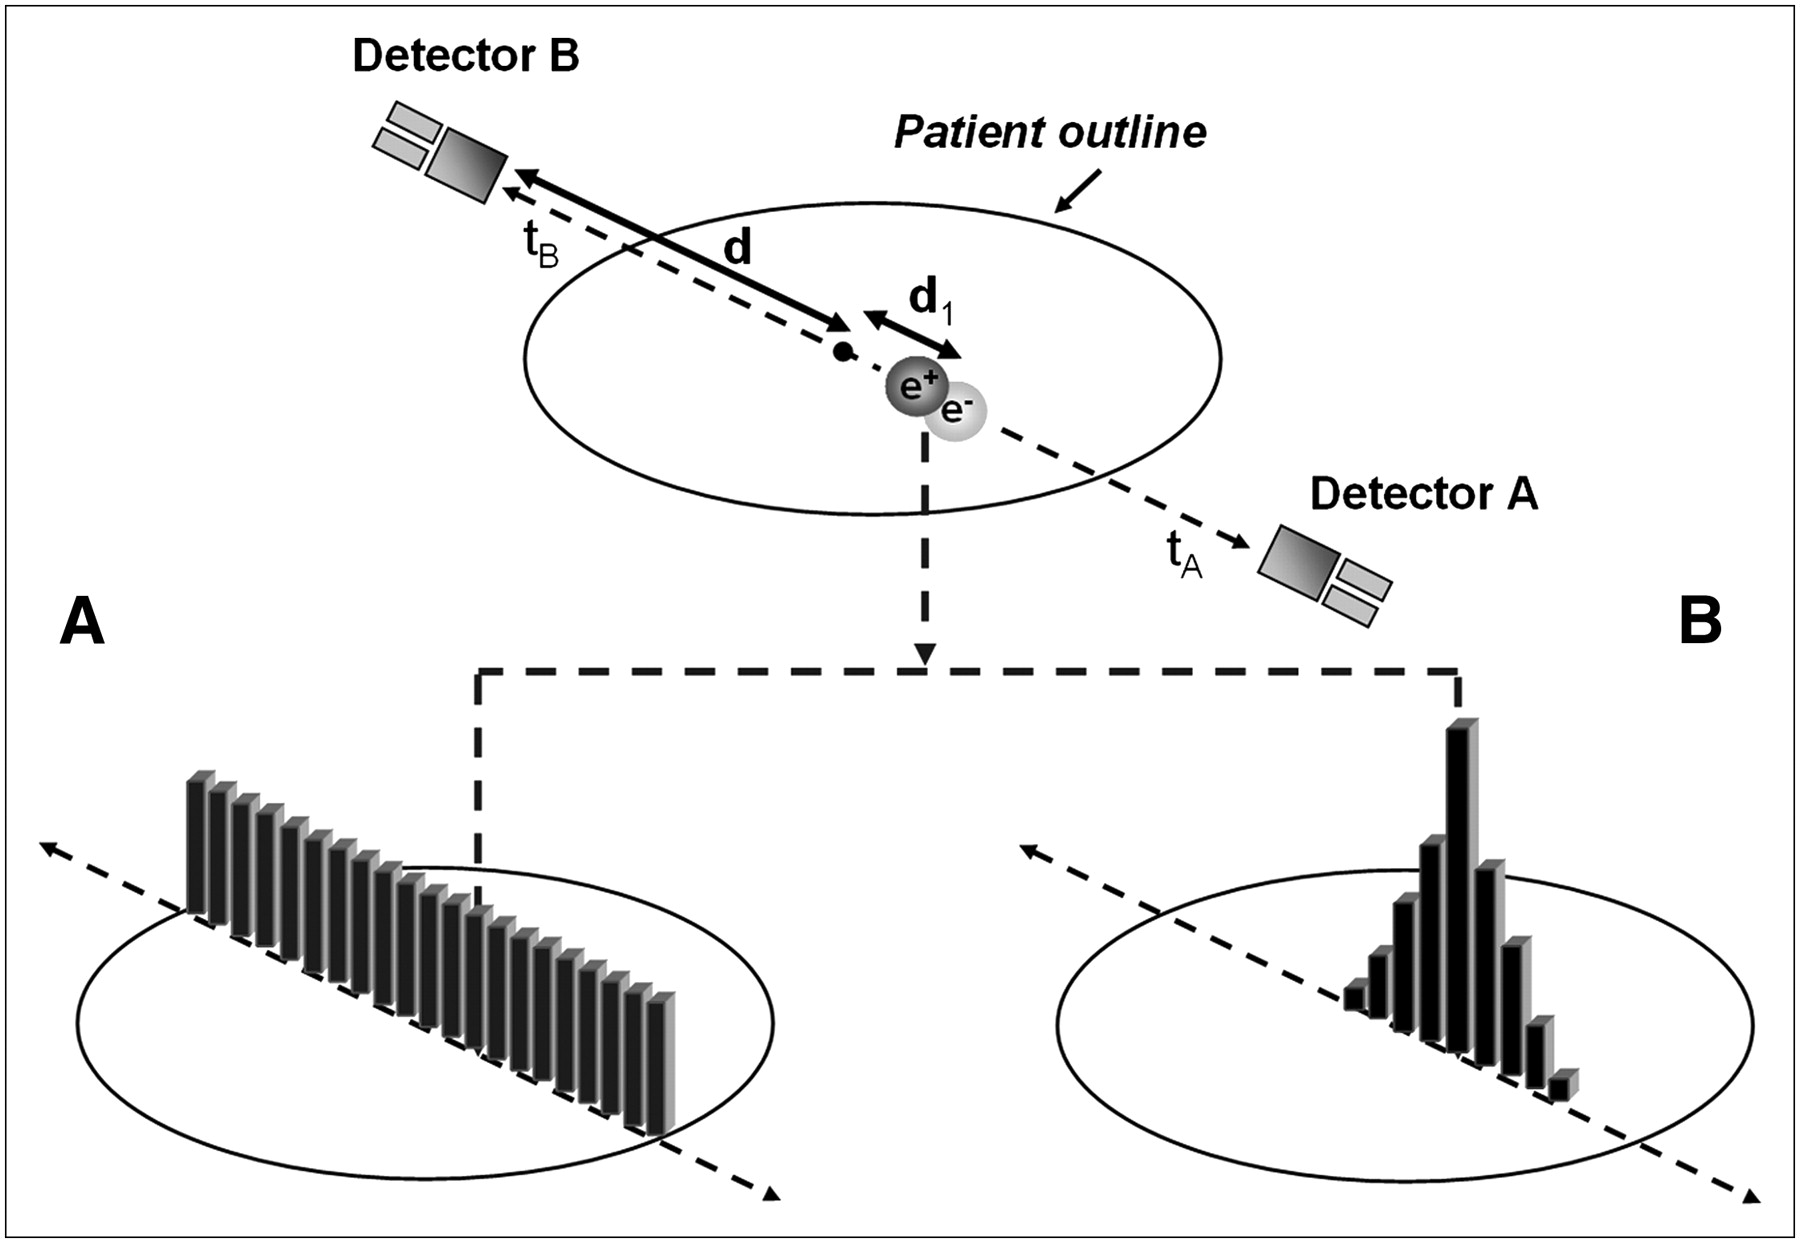
The availability of fast scintillators with high stopping power such as LSO and LYSO has revived interest in PET time of flight (TOF) (39), interest that has been further stimulated by the recent announcement of the first commercial PET/CT scanner with TOF—the Gemini TrueFlight (TF; Philips) (40). The principle of TOF PET is illustrated schematically in Figure 6; the radius of the detector ring is d, and positron annihilation occurs in the patient at a distance d1 from the center, which is d + d1 from one detector and d − d1 from the other, coincident, detector. For photons traveling at the speed of light (c), the arrival time difference between the 2 photons at the detectors is 2 d1/c. Photons originating from the center of the field of view (d1 = 0) obviously arrive in the detectors at the same time. Scanners with fast scintillators and electronics can measure this time difference to within a certain resolution. For example, for a scanner with a coincidence timing resolution of 500 ps, the spatial uncertainty on the position of the annihilation is 7.5 cm. This uncertainty is too large to place the annihilation within a 2-mm voxel (and thereby eliminate reconstruction) but is superior to having no timing information at all and assigning equal probability to all voxels along the line of response (Fig. 6A). Instead, the most probable location of the annihilation is at the center of the uncertainty distribution in Figure 6B. The TOF information is incorporated directly into the reconstruction algorithm, leading to an improvement in signal-to-noise ratio. The increase in signal-to-noise ratio is proportional to √ (D/δd) (39), where D is the diameter of the activity distribution and δd is the spatial uncertainty. For a 40-cm-diameter uniform distribution and a 7.5-cm uncertainty, the increase in signal-to-noise ratio is a factor of about 2.3. As the TOF resolution improves, the spatial uncertainty decreases and the signal-to-noise ratio increases by a larger factor. TOF PET was first explored in the early 1980s with scintillators that were fast but did not have good stopping power for 511-keV photons. Interest declined until the recent emergence of scintillators that are both fast and sensitive. The new TOF PET scanners based on LSO or LYSO must demonstrate a good timing resolution that is stable over time so as to avoid frequent detector recalibration. Although promising, the clinical impact of TOF PET has yet to be established.

Schematic illustrating PET data acquisition with incorporation of time-of-flight (TOF) reconstruction. By measuring time difference between arrival of the 2 annihilation photons, one can localize position of positron annihilation along line of response, with accuracy dependent on precision of temporal measurement. (A) Without TOF information, annihilation is located with equal probability along LOR. (B) With TOF information, annihilation point can be localized to limited range; for example, 500-ps timing resolution corresponds to 7.5-cm FWHM.
Advances in Reconstruction Techniques
There has been significant progress during the past few years in image reconstruction methods through the introduction of statistically based algorithms into the clinical setting. Previously, one of the earliest and most widely used 3D reconstruction methods was the reprojection algorithm (3DRP) based on a 3D extension of the standard 2D filtered backprojection algorithm (41). Although this algorithm works well for the lower-noise environment of the brain, the quality for whole-body imaging is less than optimal, particularly when rod source attenuation correction factors are applied to low-count emission data. Figure 7A shows a scout scan (topogram) of a patient with a body mass index (BMI) of 25. Figure 7B shows a coronal section through the patient reconstructed using the 3DRP algorithm. The development of Fourier rebinning (FORE) (42) was a breakthrough that enabled 3D datasets to be accurately rebinned into 2D datasets and reconstructed in 2 dimensions with a statistically based expectation maximization algorithm. However, it was not until the accelerated convergence achieved by the ordered-subset expectation maximization (OSEM) algorithm (43) that iterative methods could potentially be implemented clinically. Although FORE and OSEM offered better image quality than 3DRP, the incorporation of attenuation-based weights (AWOSEM) as suggested in the original paper by Hudson and Larkin further improves image quality. This is demonstrated in Figure 7C, where the same dataset as in Figure 7A has been reconstructed with FORE and AWOSEM (44). Further improvement has been achieved by eliminating the rebinning step and implementing Ordinary Poisson (OP) OSEM fully in 3 dimensions, with corrections for randoms, scatter, and attenuation incorporated into the system model (45,46). The result, again for the same dataset, is shown in Figure 7D. Finally, in a recent development termed high-definition PET, the detector spatial response function has also been included in the reconstruction model (47). The point spread function varies throughout the FOV because of the oblique penetration of the annihilation photons into the detectors. By measuring this variability and then modeling the point spread function, one can achieve improved and near-uniform spatial resolution throughout the field of view. The improvement can be seen by comparing Figure 7D with the point spread function reconstruction in Figure 7E; all reconstructions except 3DRP are unsmoothed.

(A) Coronal section of 18F-FDG PET whole-body scan of patient with BMI of 25 acquired in 3D mode with septa retracted. (B–E) Reconstructions of A using 3D filtered backprojection algorithm with reprojection (7-mm gaussian smoothing) (B), FORE + 2D OSEM (14 subsets, 2 iterations, no smoothing) (C), 3D Ordinary Poisson (OP) OSEM (14 subsets, 2 iterations, no smoothing) (D), and high-definition PET: 3D OSEM with point spread function reconstruction (14 subsets, 2 iterations, no smoothing) (E).
The images in Figure 7 are reconstructed with clinical software provided by a specific vendor (Siemens Molecular Imaging). Of course, all vendors provide comparable software capable of producing clinical images of high quality. The VUE Point algorithm (GE Healthcare) is an implementation of 3D OSEM that includes corrections for randoms, scatter, and attenuation and also axial smoothing of the volumetric data across adjacent image planes, that is, along the z direction. The Gemini TF has TOF capability and therefore the TOF information must be incorporated into the reconstruction (40). For Gemini scanners, Philips has implemented a distributed list-mode TOF algorithm that is based on a TOF list-mode maximum-likelihood approach developed by Popescu et al. (48). They have also used a row-action maximum-likelihood algorithm (49). The scatter correction algorithm also requires modification to incorporate TOF information. As will be discussed later, the greatest outstanding challenge to image quality is the size of the patient, a significant problem given the current levels of obesity among the U.S. population.
CT-BASED ATTENUATION CORRECTION (CT-AC)
A recognized benefit of PET/CT is the availability of CT images for attenuation correction of the PET emission data (23,50), eliminating the need for a separate, lengthy PET transmission scan. The use of the CT scan for attenuation correction not only reduces whole-body scan times by at least 40% but also provides essentially noiseless attenuation correction factors, compared with those from standard PET transmission measurements with external radionuclide sources. Because the attenuation values are energy-dependent, the CT scan at a mean photon energy of 70 keV must be scaled to the PET energy of 511 keV. The mean energy of a polychromatic x-ray beam is defined as the energy of a monochromatic beam that would give the same linear attenuation as the polychromatic beam integrated over energy (27). The polychromatic beam also results in beam hardening, the preferential interaction of lower-energy photons as the beam traverses the body, causing the mean energy to increase and the corresponding μ-values to decrease.
The attenuation of x-rays through tissue depends on the physical density and the effective atomic number (Zeff) of the material. At these energies, the physical processes by which x-rays are attenuated are the photoelectric effect and Compton scattering. The photoelectric probability varies approximately as  and scales as 1/E3 with photon energy (E). The Compton scattering probability has little dependence on Zeff and decreases linearly with 1/E. The linear attenuation coefficients for a given material are expressed by:
 where ρe is the electron density, Ex is the x-ray photon energy, Eγ is equal to 511 keV, and σph and σc are the photoelectric and Compton cross sections per electron, respectively. At photon energies above about 100 keV in tissue, the contribution to attenuation from the photoelectric effect is negligible (51). As a consequence of the 2 separate contributions to μ(Ex), a single measurement of μ(Ex) will not uniquely determine μ(Eγ), because, for example, an increase in Zeff could compensate for a decrease in ρe, resulting in no change to μ(Ex). In general, therefore, a simple energy scaling of μ(Ex) is insufficient to yield μ(Eγ) at 511 keV. However, by restricting the problem to biologic tissues for which Zeff values are all fairly comparable and noting that the contribution from σph is relatively small even at x-ray energies, one can see that changes in μ(Ex) are primarily due to changes in tissue electron density. Thus, for the limited range of biologic tissues, a single scaling factor can be used to convert μ(Ex) to μ(Eγ) for lung, liver, fat, muscle, and other soft tissues.
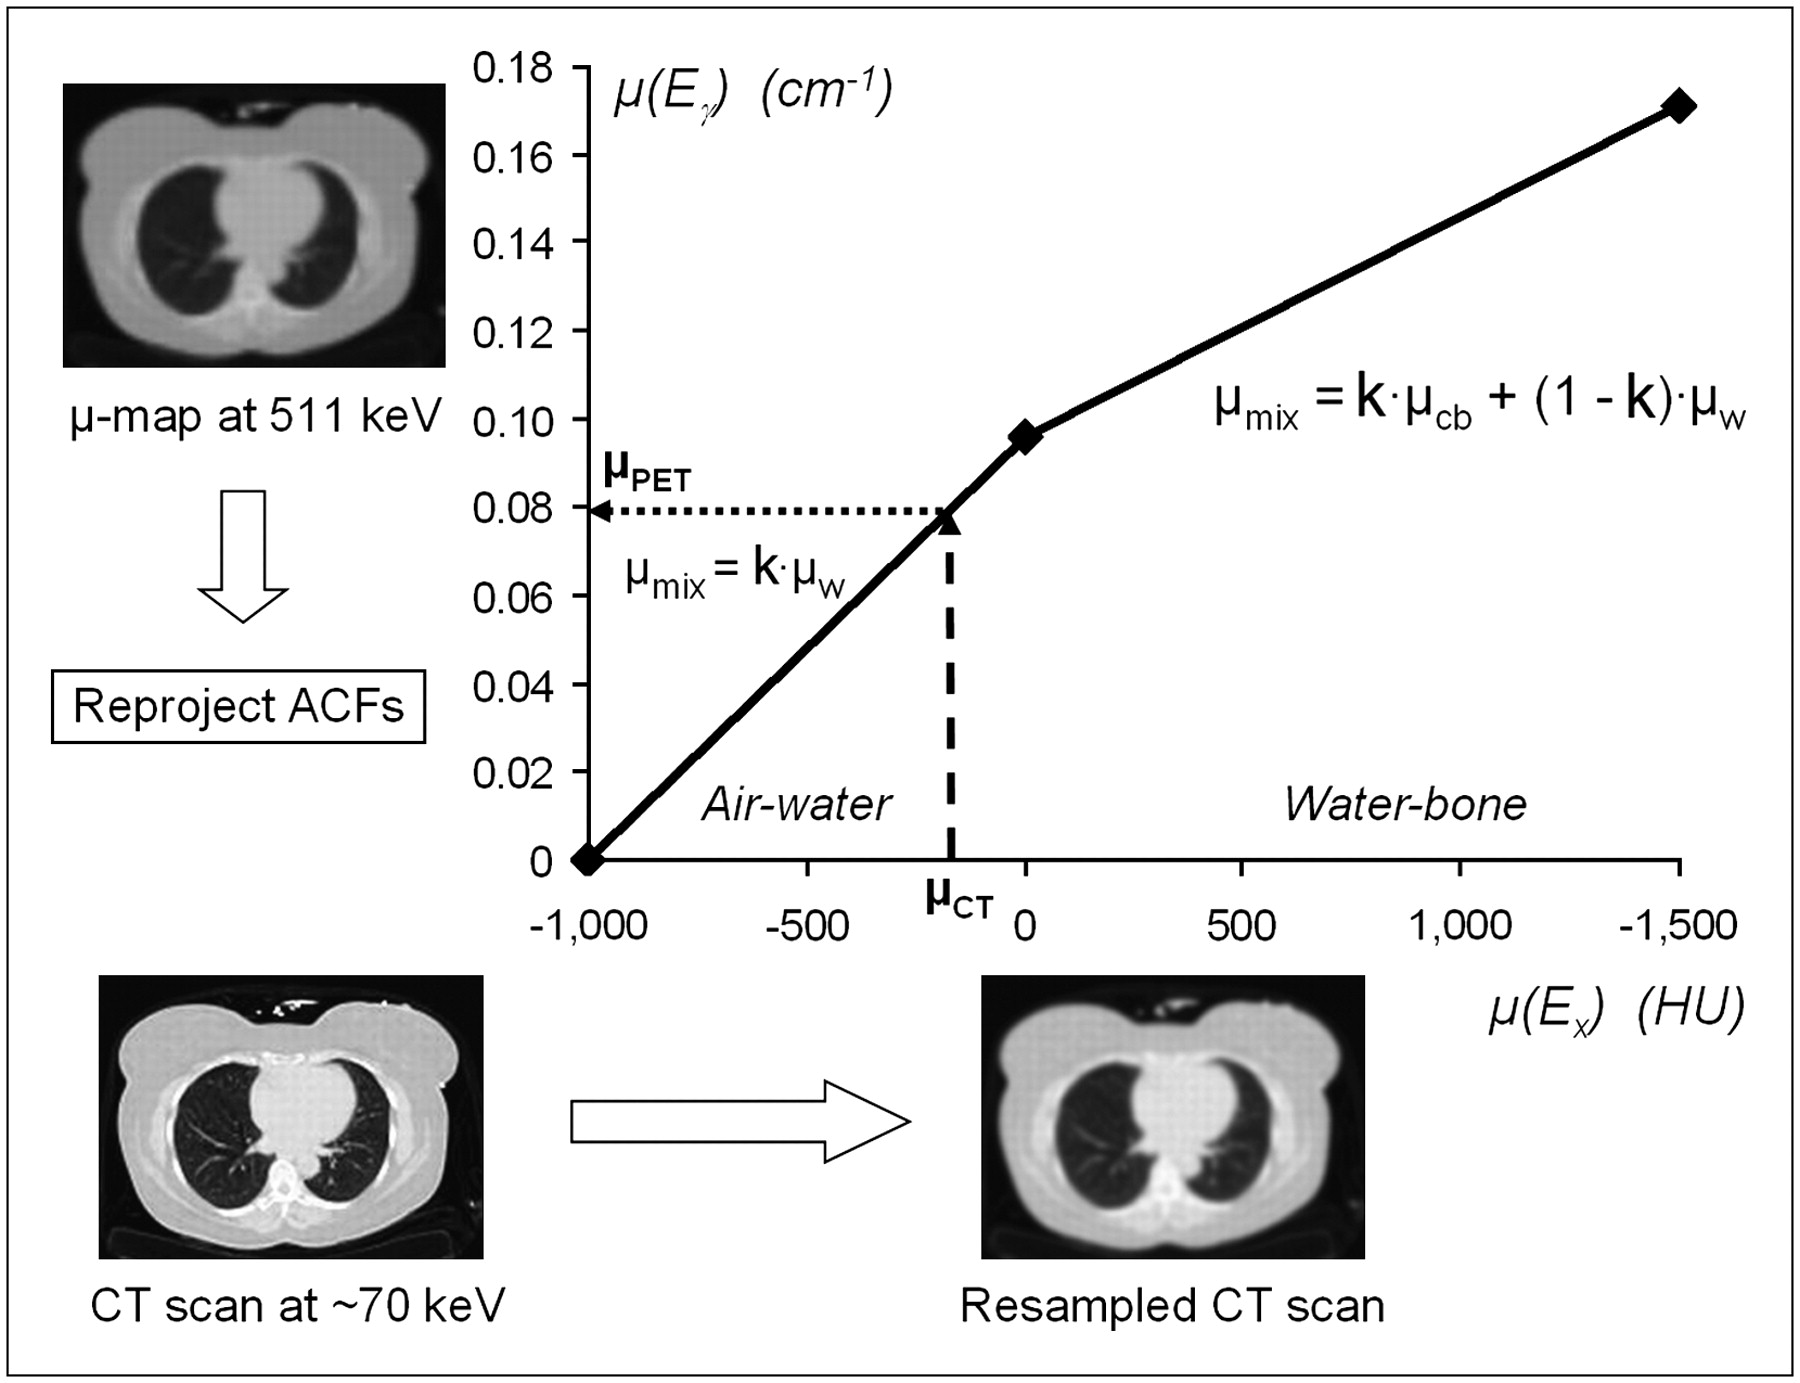
For spongiosa and cortical bone, however, the simple scale factor will not apply because of the significant calcium and phosphorous content of bone tissue. To address this issue, Kinahan et al. (23) segment bone from soft tissue at a threshold of 300 Hounsfield units (HU) and apply different scale factors to the 2 different tissue classifications—bone and nonbone. Watson et al. (27) propose a mixture model in which all tissues with μ < μ(water) are treated as a mixture of air and water at various concentrations, whereas tissues with μ > μ(water) are treated as a mixture of water and cortical bone. Because this approach limits the composition to a single value for a given μ(Ex), a bilinear scaling function can be defined for biologic tissues, as shown in Figure 8. Some recent publications propose a break point at 0 HU (μ-value for water) (52) although the most appropriate choice may be slightly greater than zero because some soft tissues and blood conform to the air–water mix but with densities greater than water. Therefore a break point of around 60 HU is more appropriate for the bilinear scaling function. This function, which is similar to that proposed by Blankespoor et al. (1) to scale CT values to SPECT energies (140 keV), has been validated with both tissue-equivalent materials and patient data (53). The calibration of the CT scanner ensures that the soft-tissue values (μ < 60 HU) are independent of the peak kilovoltage setting of the x-ray tube. This independence does not apply to bonelike tissue with μ > 60 HU, and therefore different regression lines are required for each peak kilovoltage setting (54).

Bilinear scaling function used to convert CT numbers (HUs) to linear attenuation values at 511 keV. CT scan at 70-keV effective x-ray energy is resampled to resolution of PET scan. Voxel value μCT in resampled CT image is scaled to μPET at 511 keV using range of bilinear function appropriate for μCT value. Attenuation correction factors are generated by reprojecting μ-map at 511 keV. w = water; cb = cortical bone; k = concentration of components of mixture.
The CT scan is acquired before the PET scan so the attenuation correction factors can be generated during the PET acquisition for the entire volume. The CT images at ≈70 keV (Fig. 8) are resampled to match the spatial resolution of the PET data, and thus the high resolution of the CT images is degraded for the generation of the attenuation correction factors. The images are then scaled voxel by voxel to 511 keV by applying the bilinear scaling function. The advantage of bilinear scaling is that it requires only a simple threshold and avoids a complex segmentation of the CT images. The scaled CT images are then forward projected to generate attenuation correction factors that match the sampling of the PET emission data.
Although the benefits of CT-based attenuation are well known and documented, several challenges have emerged as the technique became more widely adopted for PET/CT (55,56). The challenges are of 2 main origins: first, the presence of materials in the patient that have Zeff values that do not conform to the basic assumption in the bilinear model, and second, a mismatch between the CT and PET scans due to patient respiration, cardiac motion, and bowel movement (57). Since the first commercial PET/CT installation in 2001, these issues have received considerable attention. Examples of the first challenge include metallic objects (58,59), dental hardware (60), calcified lymph nodes, and intravenous (61,62) and oral (63,64) contrast material. Materials with high Zeff values may exceed the dynamic range of attenuation values measurable by the CT scanner, and severe artifacts are generated in the images. Of particular importance in the assessment of head and neck cancer is the presence of dental fillings (60). Several techniques to reduce metallic artifacts have been explored (65), including reconstruction methods (66) and segmentation approaches (67) that can significantly reduce the artifacts.
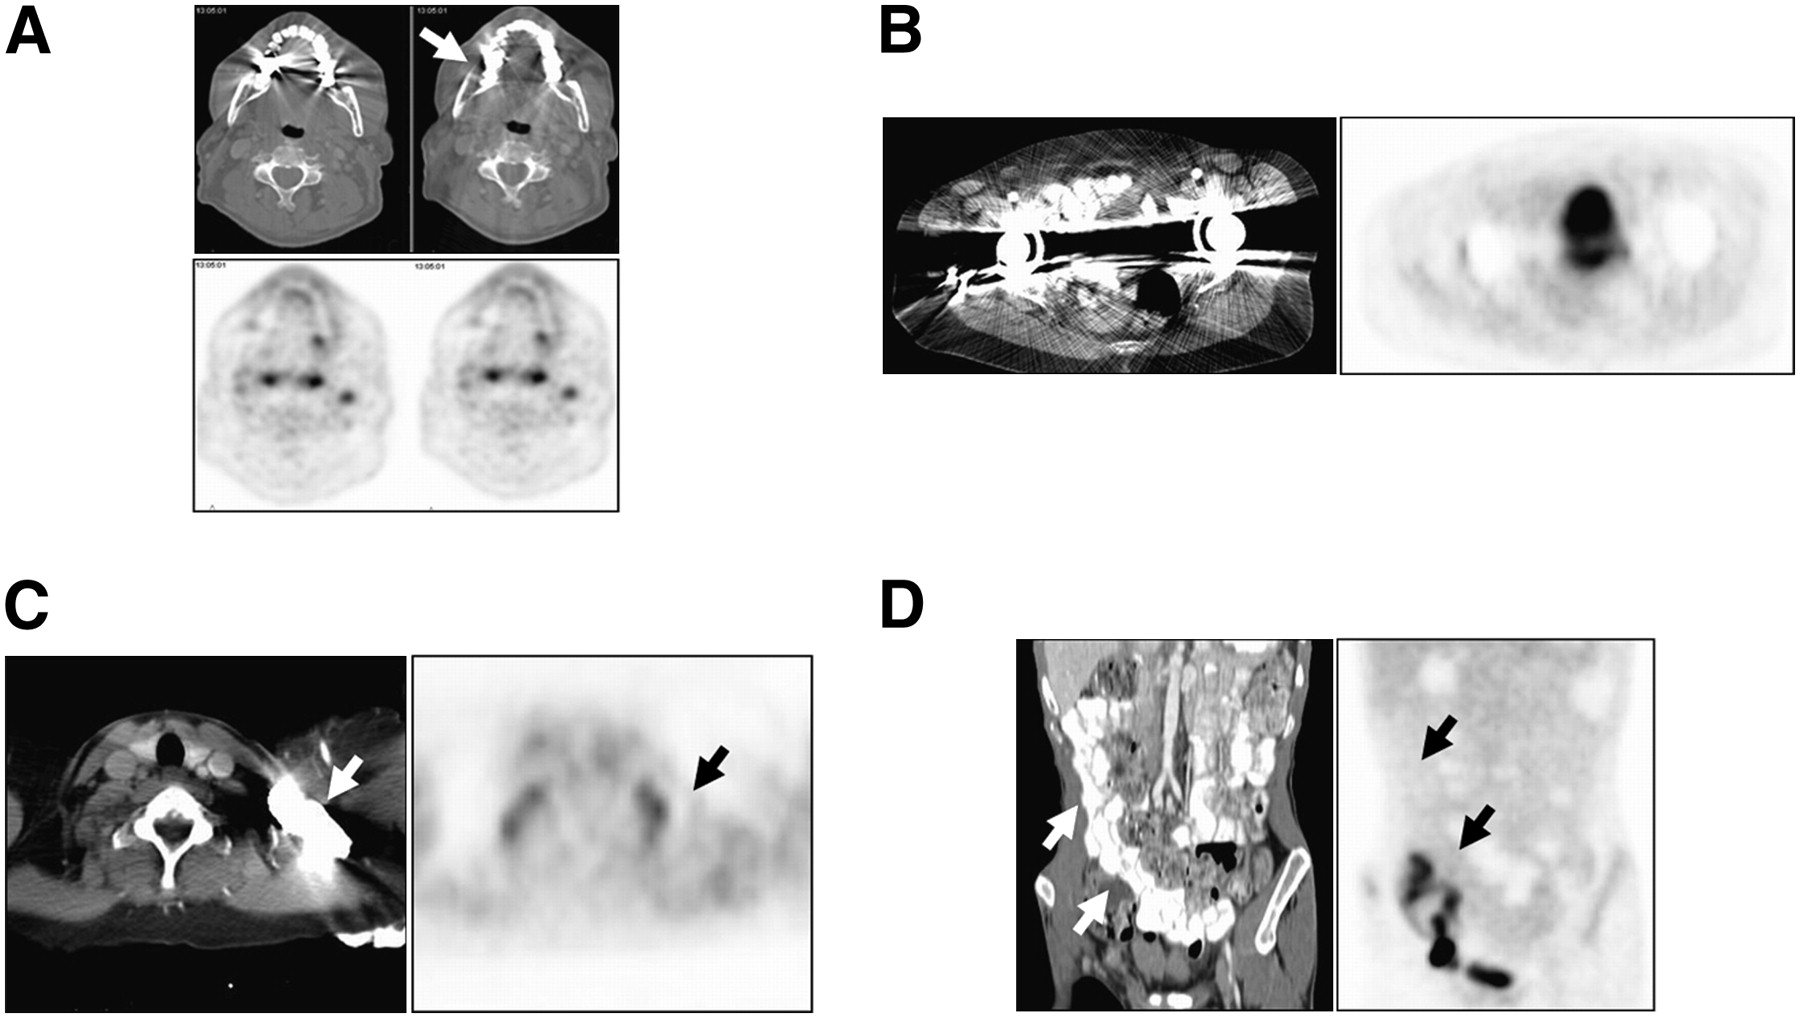
Some typical artifacts associated with CT-AC are illustrated in Figure 9. When a tidal breathing protocol is adopted for both CT and PET, respiration effects include an apparent displacement of the dome of the liver into the lower lobe of the right lung (68) (Fig. 9A), creating a corresponding region of apparent activity on the PET scan (arrow). A curved photopenic region at the top of the liver and spleen in the PET image (Fig. 9B) is also observed in some studies. Although such artifacts may occur for any patient who is following a tidal breathing protocol, the documented incidence is much reduced for the faster, higher-performance CT scanners. The clinical significance of respiratory artifacts has been studied for an early PET/CT design in a series of 300 patients (69). Figure 9C illustrates an artifact caused by a bolus of intravenous contrast material in a major vessel that generates focal uptake (arrow) on the PET image, and Figure 9D shows focal uptake (arrow) caused by the presence of a chemotherapy port. In many situations, however, artifacts on the CT images do not propagate through to the PET images, as illustrated in Figure 10. Dental artifacts can be corrected on CT through the use of novel reconstruction techniques (66), as shown in Figure 10A. The uncorrected (left) and corrected (right) images for CT (top) and PET (bottom) demonstrate that even though the reconstruction algorithm significantly improves the CT image, the impact on the PET image is only slight, verifying that CT-AC is actually a robust technique. Metallic implants such as artificial hip prostheses (Fig. 10B) can cause quite severe CT artifacts, although it would be somewhat rare for the specific pathology under study to be located in the region affected by the prosthesis. The PET images reconstructed without attenuation correction are generally available for confirmation.

Potential image artifacts generated from CT-AC: artifact due to respiration in which dome of liver is displaced into base of right lung (A), curved photopenic areas above liver and spleen caused by CT and PET mismatch from respiratory movement of diaphragm (B), artifact due to bolus of intravenous contrast material in major vessel (arrowed) (C), and artifact due to presence of abdominal chemotherapy port (D). Panel C courtesy of Todd Blodgett, MD, University of Pittsburgh.

Robustness of CT-based attenuation demonstrated by imaging situations in which artifacts might be anticipated but do not actually occur: presence of metal artifacts due to dental hardware (A), bilateral hip replacements (B), bolus of intravenous contrast material (C), and presence of oral contrast material in colon (D). Panel A courtesy of Claude Nahmias, PhD, University of Tennessee, Knoxville.
The use of intravenous or oral contrast material is indicated when the CT scan is performed for clinical purposes as opposed to low-dose CT performed for attenuation correction and localization only. Intravenous contrast material contains iodine at concentrations high enough to enhance CT values without a corresponding change in density and is used in CT to enhance attenuation values in the vasculature by increasing the photoelectric absorption, compared with the blood. CT contrast material increases photon attenuation by 40% at CT energies, whereas at 511 keV, where the photoelectric effect is negligible, the presence of contrast material has only a 2% effect on attenuation (70). However, if contrast-enhanced tissue pixels are misidentified as a water–bone mix, the scaling factor will be incorrect and the erroneously scaled pixels may generate artifacts in the PET image (71). Tens of thousands of PET/CT scans have now been performed in the presence of intravenous contrast material, and experience has shown that contrast administration does not generally cause a problem that could potentially interfere with the diagnostic value of PET/CT (61,72,73). This is largely due to the fact that intravenous contrast material is fairly rapidly dispersed throughout the vascular system. An exception may be the passage of the contrast bolus through a major vessel (Fig. 9C), although even this instance does not always generate an artifact on the PET image (Fig. 10C, arrow). Optimized CT protocols that avoid most of the issues have been developed for the administration of intravenous contrast material (74).
Oral contrast material is administered to enhance the gastrointestinal tract, and the distribution of the contrast material is somewhat variable, both spatially and in level of enhancement. Modifications to the basic scaling algorithm have been introduced to distinguish pixels enhanced by the presence of oral contrast material from pixels that represent bone (70). As with intravenous contrast material, there is no evidence that the presence of oral contrast material results in diagnostic errors of any significance. Figure 10D shows a patient imaged with oral contrast material; enhancement of the colon on the CT image (left; arrows) shows no corresponding artifactual uptake on the PET image (right). Nevertheless, in some protocols, contrast-enhanced CT is performed in addition to the low-dose CT for attenuation correction and localization, thereby increasing the radiation dose to the patient. However, a low-dose whole-body CT scan in addition to a clinical CT scan with contrast material over a limited axial range (single PET bed position) may involve less radiation dose than a whole-body clinical CT scan with contrast material.
Within the past 5 y, the most widely addressed issue related to CT-AC has been respiratory motion (75–78) and the artifacts created by the mismatch between CT and PET (79). Rotating 68Ge sources used in conventional PET scanners generated a transmission scan that averaged patient respiration in a way compatible with the corresponding emission scan. The use of CT-AC presents additional possibilities, including the freezing of respiration by acquiring the CT with breathhold. The advent of fast, spiral CT scanners makes it possible for the patient to hold their breath with full inspiration during the CT scan. Such an expansion of the chest does not match a PET scan acquired with shallow breathing and results in serious attenuation correction artifacts in the anterior chest wall. The appearance of artifacts due to respiratory motion and the spatial and temporal mismatch between CT and PET images has led to an intensive research initiative to identify the best respiratory protocol. Several different protocols have been explored, including the following: continuous shallow breathing for both CT and PET (75); CT acquired with a limited breath-hold over the diaphragm (75,80); breath-hold CT acquired with partial inspiration (75); motion-averaged CT acquired over many respiration cycles (81,82); cine CT acquiring a full breathing cycle per slice (83); respiration-gated CT and PET with shallow breathing (84); a deep inspiration breath-hold (85,86); breath-hold CT and gated PET (87,88); and respiration-gated CT and PET (89).
Currently, the most widely used protocol is shallow breathing for both CT and PET (75). Early single- or dual-slice PET/CT designs exhibited a high incidence of breathing artifacts (Figs. 9A and 9B) (90), but with the incorporation of fast, multidetector CT into PET/CT scanners, the incidence of such artifacts has been greatly reduced. However, the CT images still do not match exactly the motion-averaged PET acquisitions, and protocols such as slow CT acquisition have also been explored. The clinical significance of these attenuation correction effects continues to be debated, particularly with respect to lesions in the base of the lung and dome of the liver, where curved photopenic areas are observed (Fig. 9B). Displacement of such lesions may result in incorrect localization or, worse, a failure to identify them, leading to misdiagnosis. Shallow breathing during PET/CT has been shown to be inadequate for the comprehensive staging of lung cancer (91), primarily because of the respiratory-induced artifacts along the diaphragmatic border.
Despite the issues discussed above and a few opinions to the contrary (92), CT-AC has become the de facto standard for PET/CT oncology studies. The advantages, which include convenience and short acquisition times, largely outweigh the drawbacks. In a small number of studies, quantitative comparisons have been made between attenuation correction factors generated from standard PET transmission scans and from CT (77,93,94). In summary, advances in the technology have resolved some of the problems, and new strategies have been developed that address many of the outstanding issues. However, although CT-AC is now a widely used and generally accepted technique for whole-body oncology, there are still unsolved issues for CT-AC in cardiology (95) that will undoubtedly be the subject of future research.
COMBINED PET/CT SCANNERS IN CLINICAL PRACTICE
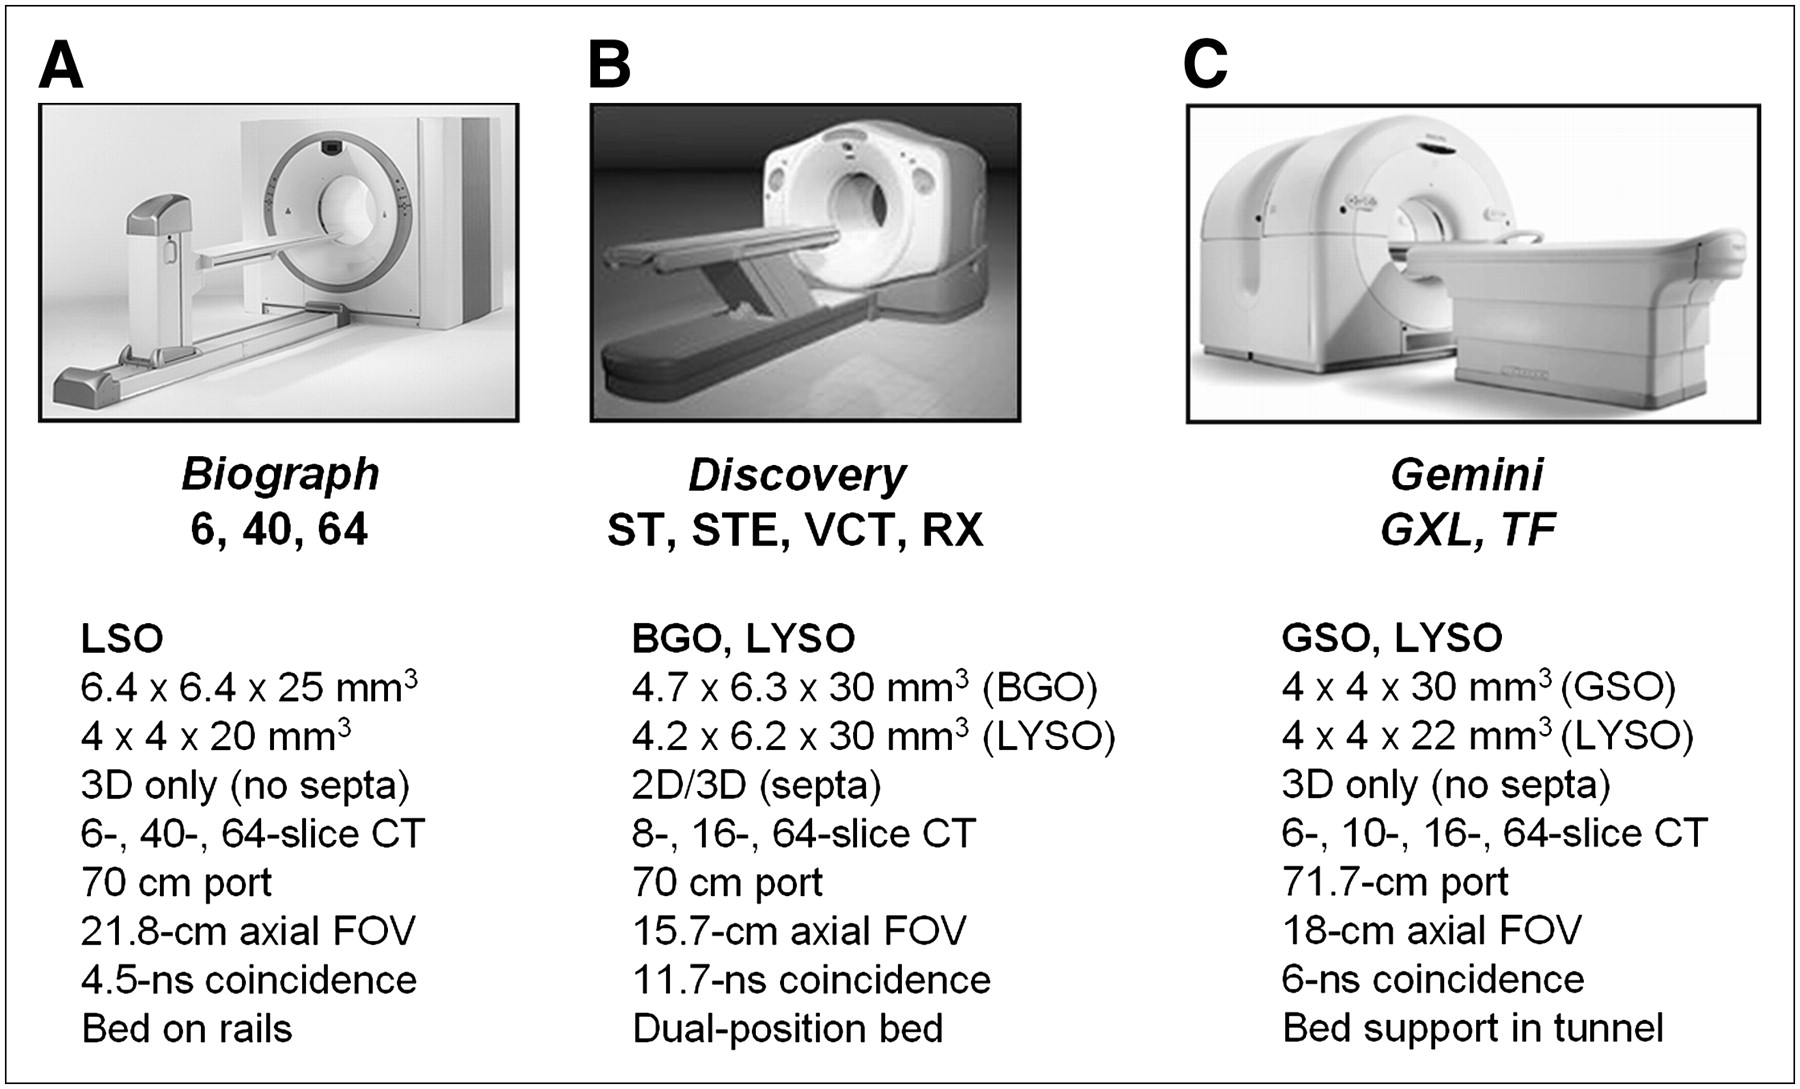
Five vendors worldwide offer PET/CT designs: GE Healthcare, Hitachi Medical, Philips, Toshiba Medical Corp., and Siemens Medical Solutions. Current PET/CT design features offered by Siemens Molecular Imaging, GE Healthcare, and Philips are summarized in Figure 11. The specifications and performance of the PET components are vendor-specific, with the Biograph HI-REZ TruePoint (Fig. 11A; Siemens Medical Solutions) offering approximately 4-mm spatial resolution in 3D mode (96). The Discovery ST (Fig. 11B; GE Healthcare) has BGO detectors in combination with a 4-, 8-, or 16-slice CT scanner. The higher-resolution Discovery STE also has BGO detectors, in combination with 8- or 16-slice CT scanners; the Discovery VCT is a Discovery STE configured with a 64-slice CT scanner. The Gemini GXL (Fig. 11C; Philips Medical) has GSO detectors and an open design with the capability to physically separate the CT and PET scanners for access to the patient. The Gemini GXL incorporates a 6- or 16-slice CT scanner. The most recent addition to PET/CT designs is the Gemini TF, the first commercial TOF PET scanner (40) combined with a 16- or 64-slice CT scanner. All designs now offer a 70-cm patient port for both CT and PET, thus facilitating the scanning of radiation therapy patients in treatment position, at least to some extent. Although the Discovery and Gemini also offer standard PET transmission sources as an option, in practice, most if not all institutions use CT-AC because of the advantages of low noise and short scanning times that facilitate high patient throughput. The Gemini and Biograph acquire PET data in 3D mode only, whereas the Discovery series incorporates retractable septa and can acquire data in both 2D and 3D modes. Other design features are listed in Figure 11.

Current PET/CT scanner designs from 3 major suppliers of medical imaging equipment: Siemens Biograph TruePoint (A), GE Healthcare Discovery range (B), and Philips Gemini series (C).
RADIATION DOSIMETRY FOR PET/CT
The exposure to the patient from a PET/CT scan is both external (from the CT) and internal (from the PET biomarker) (97). The effective dose, Eint, resulting from intravenous administration of a biomarker with activity A can be estimated from where Γ is a dose coefficient computed for the adult hermaphrodite MIRD phantom. For 18F-FDG, the dose coefficient is 19 μSv/MBq (98), although a higher dose coefficient of 29 μSv/MBq has also been published (99). The dose coefficient holds for standard patients with a body weight of about 70 kg and is generic rather than patient-specific since the patient's age, sex, and individual pharmacokinetic characteristics are not considered. In fact, the radiation risk is somewhat higher for female patients and for younger patients than for male patients and older patients. Age- and sex-specific dose coefficients can be found elsewhere (100). Based on the published value (98) for the dose coefficient, the average whole-body dose for a typical 370-MBq (10-mCi) injection of 18F-FDG is 7 mSv. However, most biomarkers do not distribute uniformly in the body, and the critical organ with 18F-FDG, for example, will be the bladder because of excretion through the urinary system.
Dose assessment in CT is challenging and depends not only on the body region exposed but also on a variety of scan-specific parameters including tube potential (kVp), tube current and exposure time (mAs), slice collimation, and pitch (101). In addition, the dose also depends on certain technical features of the scanner such as beam filtration, the beam-shaping filter, geometry, and the acquisition algorithm. Therefore, values for CT patient dose vary considerably between centers and between scanners. The tendency is to oversimplify the situation by not taking some of these factors into account. For whole-body CT scans that extend from the level of the thyroid to the symphysis, the effective CT dose, Eext, can be estimated approximately as where
where  (1.47 mSv/mGy) is the dose coefficient that relates the volume CT dose index, CTDIvol, to the effective dose. For a typical set of clinical scan parameters, the CTDIvol is 13 mGy (102), resulting in a total effective whole-body dose of 19 mSv. However, many centers acquire the CT scan for attenuation correction and localization only, reducing the whole-body dose to as low as 3 mSv or even less. In addition, there are several strategies to make better use of the radiation, such as tube current modulation and automatic exposure control (103,104).
The total effective dose for PET/CT is the sum of the internal and external doses, plus the small radiation dose associated with the scout scan (or topogram), which is in the range 0.2–0.8 mSv. For a fully clinical CT and PET scan, the effective dose will therefore be around 26 mSv. However, this can be reduced to 10 mSv or less when a low-dose CT scan is acquired for localization and attenuation correction only. In practice, the PET/CT dose to a specific organ will depend on the exact protocol; for example, if the CT scan does not include the bladder, the dose to the bladder wall will be due entirely to 18F-FDG. For a smaller patient and a high-sensitivity scanner, a lower 18F-FDG dose can be used, potentially limiting the effective dose to 5 mSv or less. The worldwide average annual dose due to the natural radioactive background is 2.4 mSv.
CLINICAL PROTOCOLS FOR 18F-FDG PET/CT
Clinical protocols for 18F-FDG PET/CT have progressively evolved as the operational capabilities and flexibility of new generations of scanners have improved since their introduction in 2001. Currently, an 18F-FDG PET/CT procedure for a typical oncology application will involve the following steps:
The patient fasts for at least 6 h before the scan.
Oral contrast material is administered if required for the study.
The patient receives an intravenous injection of 370–555 MBq (10–15 mCi).
A 60- to 90-min uptake period is allowed before the scan commences.
The patient is positioned in the scanner with arms up (except for scans of the head and neck).
The patient is immobilized and comfortable throughout the scan.
A low-dose scout scan is first acquired over the full potential scan range.
The required scan range for the study is defined on the scout scan.
Intravenous contrast material is administered if indicated by the protocol.
The spiral CT scan is initiated over the selected range.
All CT-AC factors are generated for the PET data.
The PET scan is obtained as a series of acquisitions at discrete bed positions.
The ranges of the CT and PET scans cover the same axial extent.
Reconstructed images are available within about 3 min of the end of the scan.
For each specific study, a decision is made as to whether intravenous or oral contrast material is required and whether the CT scan should be acquired at 150–200 mAs for clinical purposes or at a low dose of 40–80 mAs for attenuation correction and localization only. Such decisions are usually based on the requirements of the referring physician and on whether the patient already has undergone a recent, clinical CT scan of acceptable quality. For follow-up studies, and particularly when monitoring response to a therapeutic intervention, it is important to follow well-defined and repeatable protocols to ensure consistent results (105). Careful monitoring of glucose levels, injected dose, scan starting time, and scan duration are required to ensure reproducible conditions.
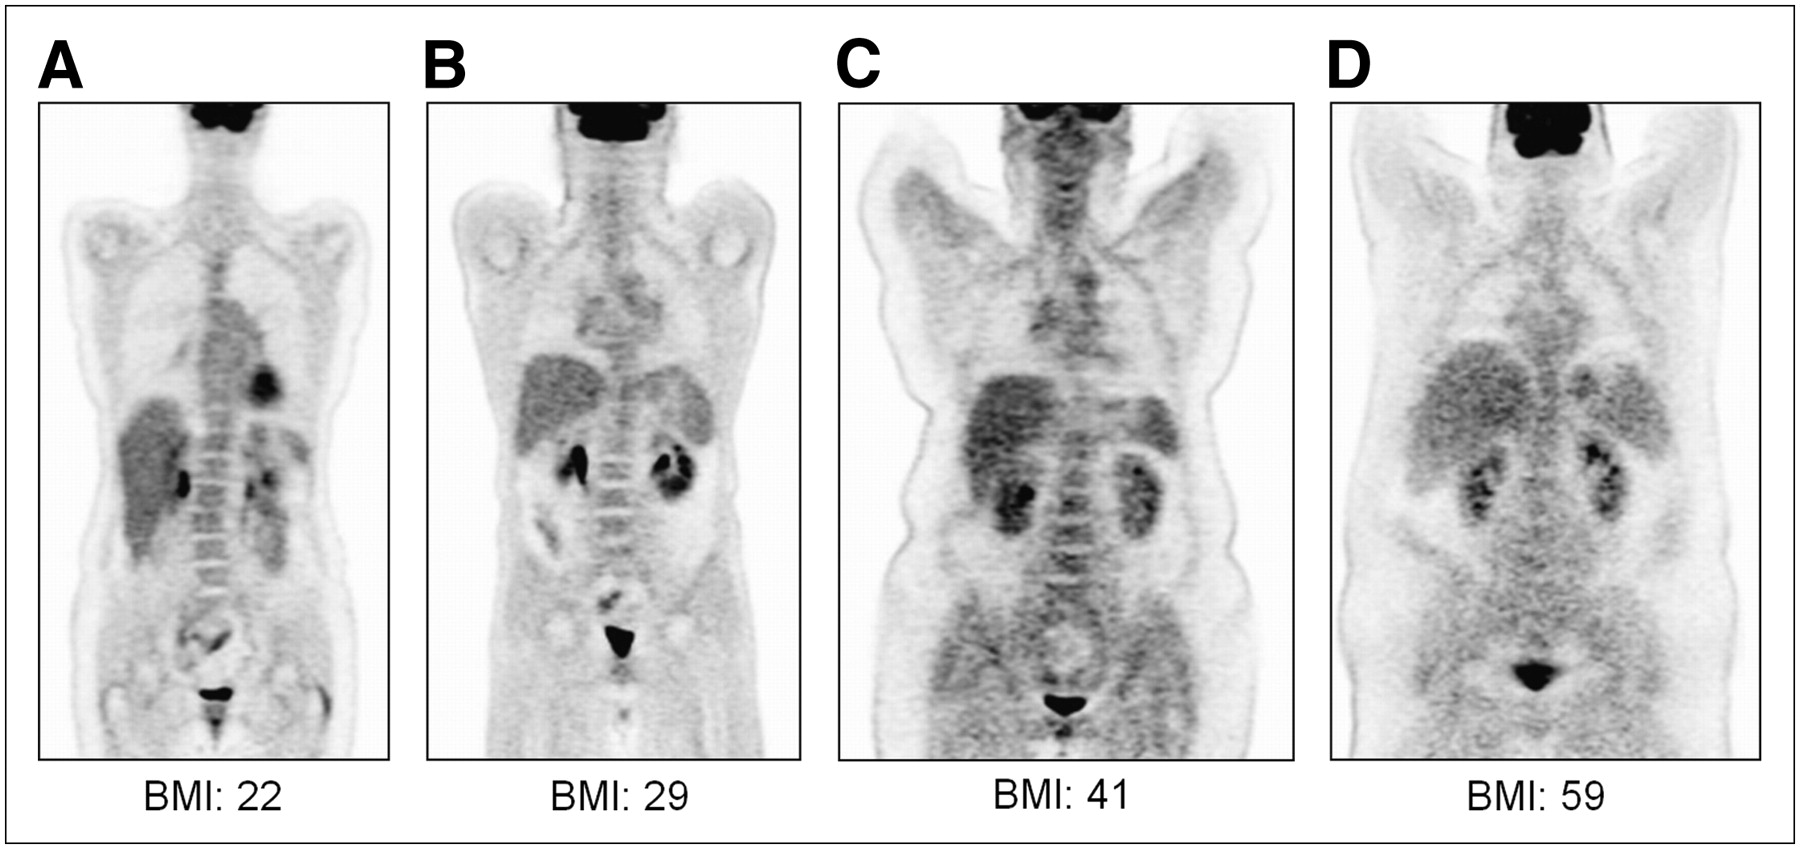
As mentioned earlier, a factor that defines the scan protocol is patient size. The current levels of obesity within the U.S. population and elsewhere are such that the BMI of the patient is often the most important parameter determining scan quality. For a typical U.S. population, patient weight may vary from 45 to 204 kg (100–450 lbs), a range that cannot be compensated by an increase in injected dose or scan duration. For a given PET/CT scanner, image quality degrades as body weight increases (33), largely because of the increase in attenuation associated with the higher-BMI patients. This degradation is shown visually in Figure 12 for patients with BMIs in the range of 22–59. For the BGO-based PET/CT scanners with septa, the recommendation for large patients is to acquire PET data in 2D mode with the septa extended, whereas for the LSO- and LYSO-based scanners, 3D acquisition appears to give better results even for large patients (34,35). The incorporation of TOF information, as in the Gemini PET/CT, should further improve the signal-to-noise ratio for imaging larger patients (40).

Degradation of image quality as function of patient BMI. Coronal section is shown for each patient. (A) BMI, 22; height, 160 cm; body weight, 57.6 kg (127 lb); 432.9 MBq (11.7 mCi) injected; 95-min uptake; 5 bed positions at 2 min per position. (B) BMI, 29; height, 173 cm; body weight, 86.6 kg (191 lb); 392.2 MBq (10.6 mCi) injected, 88-min uptake, 5 bed positions at 3 min per position. (C) BMI, 41; height, 165 cm; body weight, 112.5 kg (248 lb); 377.4 MBq (10.2 mCi) injected, 91-min uptake, 5 bed positions at 3 min per position. (D) BMI, 59; height, 175 cm; body weight, 180.5 kg (398 lb); 370 MBq (10 mCi) injected, 90-min uptake, 6 bed positions at 5 min per position. All data were acquired in 3D mode on Siemens Biograph TruePoint TrueV PET/CT scanner with 21.8-cm axial FOV. For purposes of comparison, all studies were reconstructed with 3D OSEM: 3 iterations, 8 subsets, and 6-mm gaussian smoothing filter.
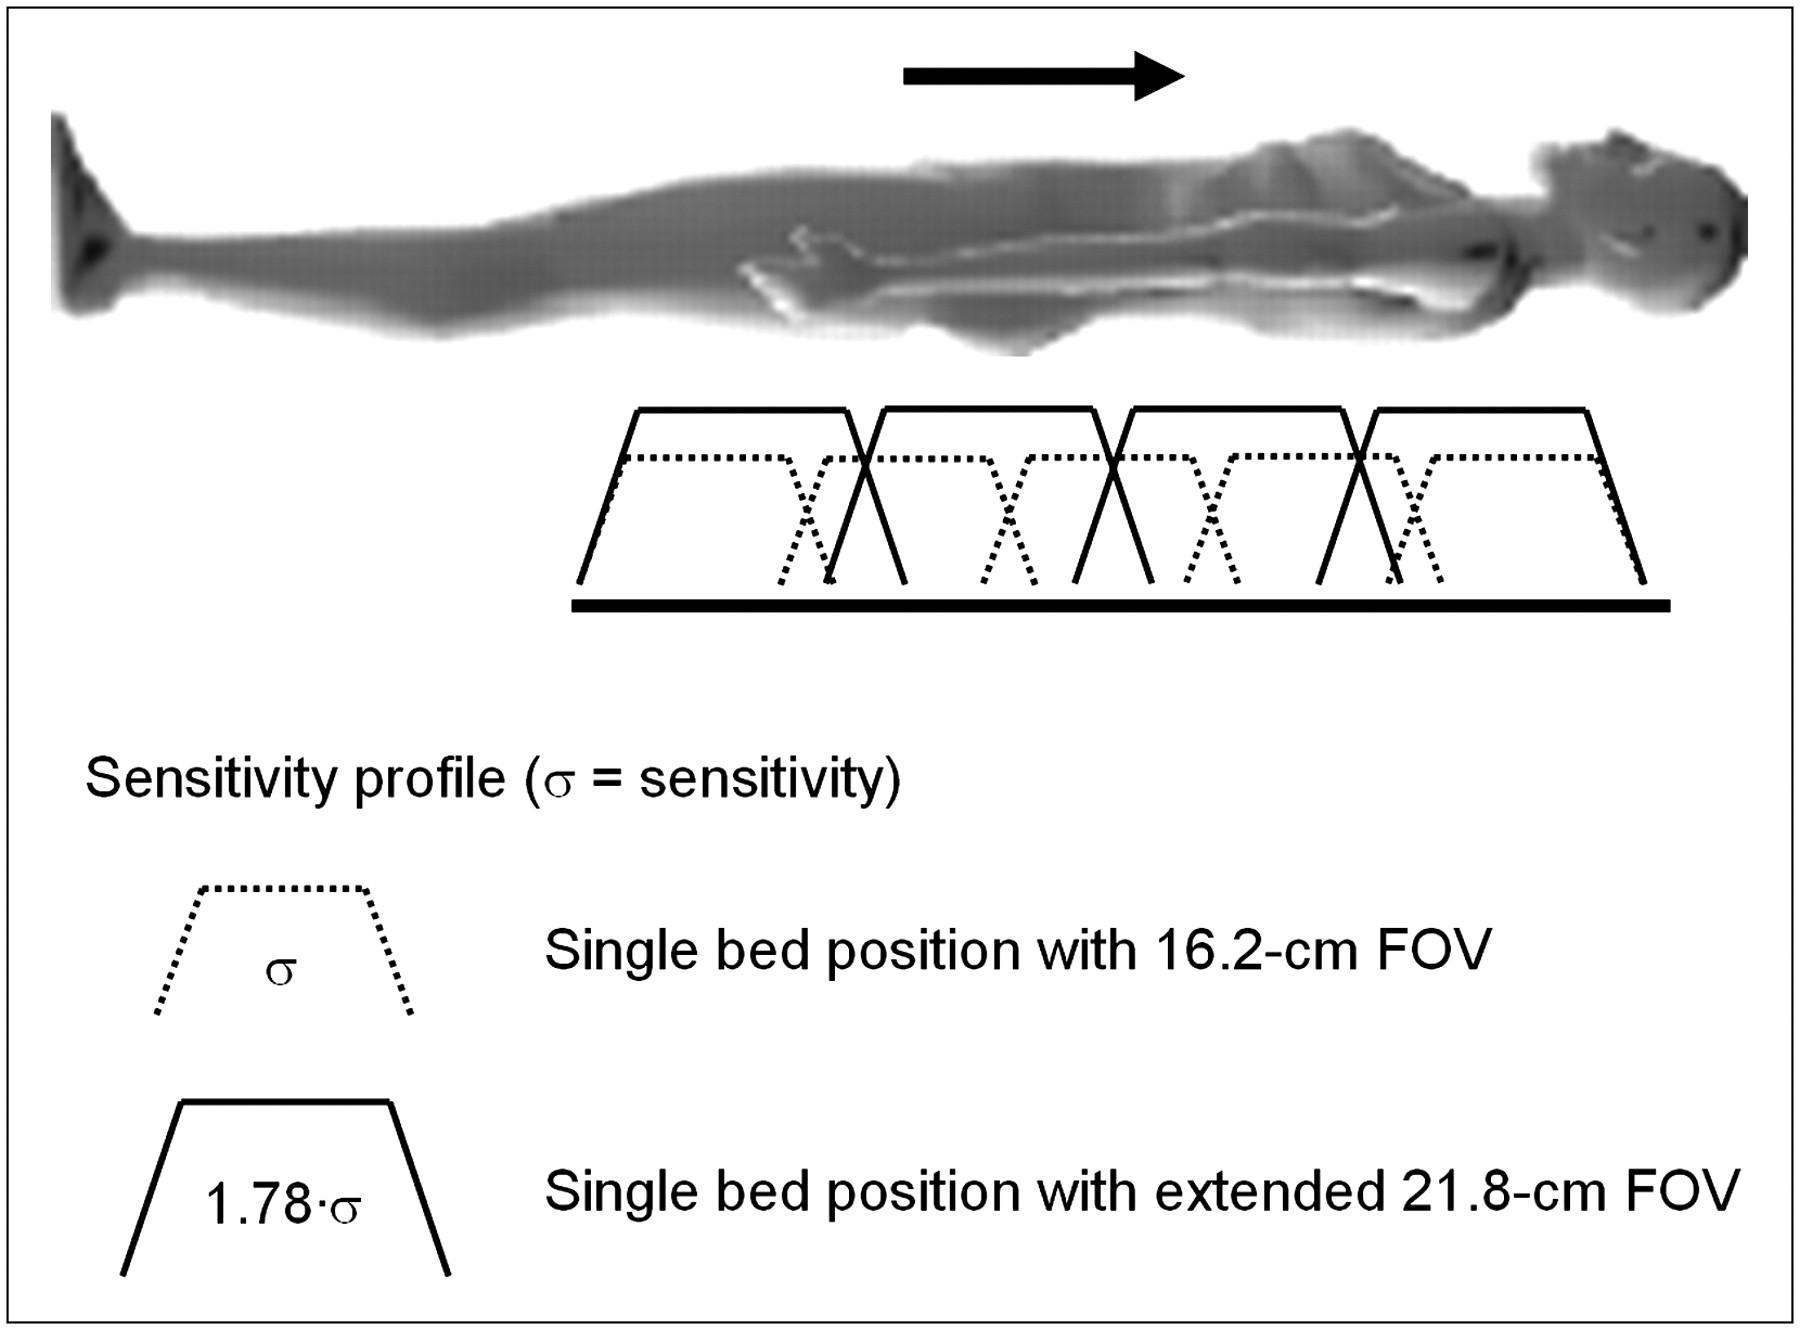
The extended-FOV PET/CT scanner (37,38), with a 21.8-cm axial coverage, allows rapid scan protocols to be implemented for high patient throughput. With the advances in both CT and PET performance in the past few years, the overall scan duration has been reduced from the 45–60 min required for a PET-only scan to 10–15 min for a PET/CT scan. A CT scan from the base of the brain to the upper thigh can now be acquired in 15–20 s, and a PET scan with extended axial FOV PET/CT requires only 5 bed positions at 2–3 min per position. The extended FOV not only reduces the scan time at each bed position because of the increased intrinsic sensitivity, but fewer bed positions are required to cover the standard whole-body imaging range, as illustrated schematically in Figure 13. This is especially advantageous when imaging melanoma patients from head to toe.

Advantages for whole-body imaging obtained by increasing axial coverage of PET/CT scanner. When axial FOV is increased from 16.2 to 21.8 cm, overall sensitivity σ for each bed position increases by 78%, resulting in shorter imaging times per bed position and fewer bed positions to cover whole body.
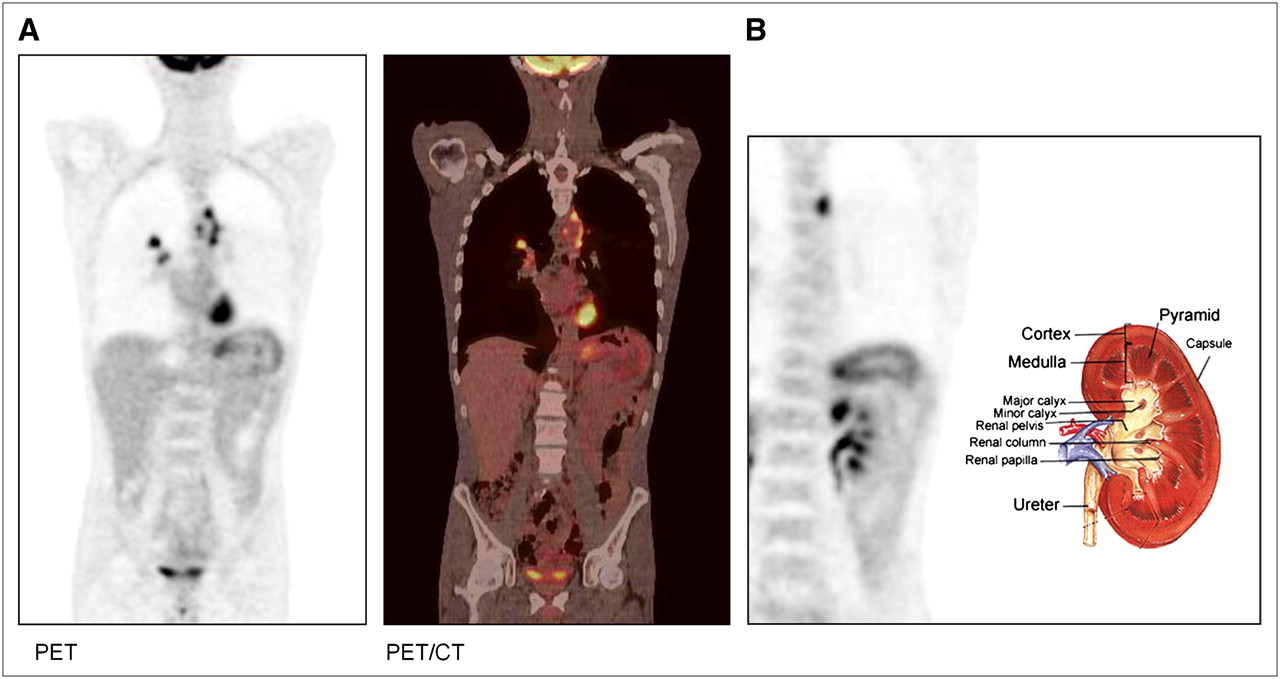
There are now numerous published examples of PET/CT studies demonstrating the attainable image quality and highlighting the benefits of the technology; only 2 examples will be presented here to illustrate state-of-the-art performance in PET/CT. Figure 14 shows a PET/CT scan of a 44-y-old man (BMI, 16) with a recent diagnosis of lung cancer. The patient was a smoker for 26 y and presented recently with shortness of breath, an 11-kg (25-lb) weight loss in 1 mo, and chest pain. The PET/CT scan (Fig. 14A) demonstrated multiple bilateral pulmonary nodules, including a medial right upper lobe nodule surrounding the pulmonary vessels. Figure 14B illustrates in the same patient the capability of the technology to image the functional architecture of the kidneys due to the excretion of 18F-FDG. The second study, shown in Figure 15, is that of a 50-y-old woman (BMI, 31.2) with a history of non-Hodgkin's lymphoma (diagnosed in 1995). The patient was referred for PET/CT for restaging of vulvar cancer (diagnosed and removed surgically in 2005). The CT scan, however, was negative for disease recurrence (Fig. 15A). The PET/CT scan demonstrated focal uptake in the right aspect of the vulva (Fig. 15B, arrowed; SUV, 10.3) with adjacent rectal uptake suggestive of malignancy. The suggestive region is shown on coronal and sagittal sections in Figure 15C. This study illustrates the importance of combined PET/CT, especially when the CT findings are negative and the PET findings reveal abnormal focal uptake of 18F-FDG; the CT scan provides precise localization of the functional abnormality.

PET/CT study of 44-y-old man (BMI, 16) with recent diagnosis of lung cancer. Patient had been smoker for 26 y and presented with shortness of breath, 11.3-kg (25-lb) weight loss in 1 mo, and chest pain. PET/CT scan demonstrated multiple bilateral pulmonary nodules, including medial right upper lobe nodule surrounding pulmonary vessels (A), and capability of technology to image functional architecture of kidneys because of excretion of 18F-FDG (B). Scan was obtained after injection of 399.6 MBq (10.8 mCi) of 18F-FDG and 92-min uptake period. Acquisition is at 5 bed positions, for 2 min per position; CT was acquired at 130 kVp and 50 mAs; PET reconstruction is for 3 iterations and 8 subsets, with 5-mm gaussian smoothing.
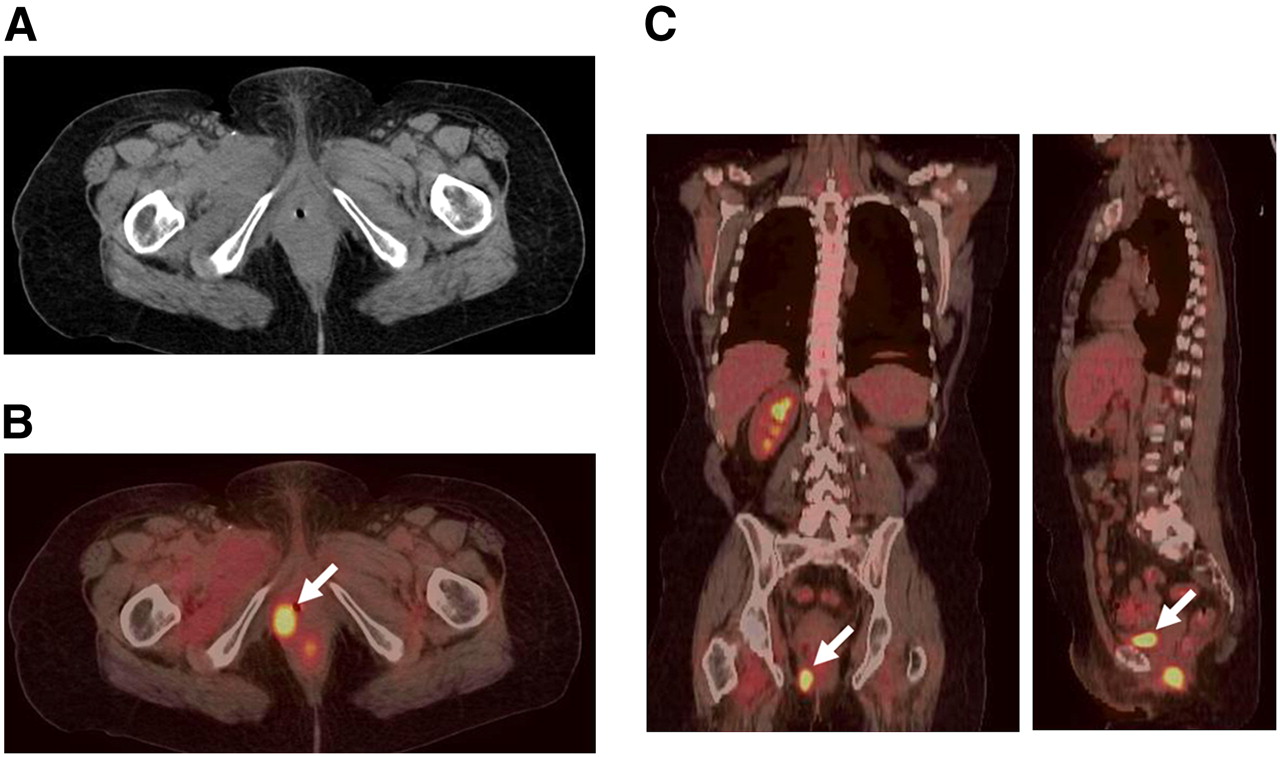
PET/CT study of 50-y-old woman (BMI, 31.2) with history of non-Hodgkin's lymphoma diagnosed in 1995. She was referred for PET/CT for restaging of vulvar cancer (diagnosed and resected surgically in 2005). (A) CT scan is negative for disease recurrence. (B) PET scan demonstrates focal uptake in right aspect of vulva (arrow; SUV, 10.3) with adjacent rectal uptake also suggestive of malignancy. (C) Uptake in vulva can be localized from coronal and sagittal sections. Scan was obtained after injection of 392.2 MBq (10.6 mCi) of 18F-FDG and 90-min uptake period. Acquisition is at 5 bed positions, for 3 min per position; CT was acquired at 130 kVp and 175 mAs; PET reconstruction is for 3 iterations and 8 subsets, with 6-mm gaussian smoothing.
Obviously, the effects of cardiac and respiratory motion are critical for these studies. The problems of mismatch associated with CT-AC are potentially more serious for cardiac studies than they are for oncology in that all cardiac studies are affected rather than just those with lesions in specific regions. This misregistration results in what appears to be perfusion deficits in segments of the heart associated with the misalignment. A recent publication (95) has suggested that up to 40% of cardiac PET/CT studies could be affected by misregistration. Several different strategies are being developed to address this issue, including manual realignment of CT and PET, acquiring cine CT of the breathing motion and generating an average CT scan for attenuation correction, and acquiring multiple CT scans to ensure at least one matches the PET scan. Obviously, the role of PET/CT in cardiology has yet to be established, and if a strong clinical demand exists it is to be expected that transient technical challenges such as misalignment will ultimately be solved.
CONCLUSION
The field of medical imaging has now had a decade to adapt to the introduction of PET/CT (106). Obviously, combined PET/CT technology cannot resolve all the issues associated with accurate alignment of 2 modalities. As discussed previously, artifacts are created through the use of CT for attenuation correction, artifacts that do not occur with a traditional radionuclide transmission scan. In addition, there is debate over any additional radiation dose associated with the CT scan and what should happen when a patient presents with a previously acquired clinical CT scan. This situation has created the demand for cross training of both the technologists who operate the devices and the physicians who interpret the studies. Guidelines have been published (107) and new standards established creating a very different situation today from the way radiology and nuclear medicine have traditionally operated. Clearly, as recently proposed (108), what is needed is a “new world order” addressing the training of “clinicians for a new era in imaging.” Although the initial PET/CT designs may have appeared excessively costly by combining 2 expensive modalities, high-performance PET/CT scanners are now available for a financial outlay comparable to that of many PET-only devices before 2001. An initial concern that the 45-min PET scan would make inefficient use of the associated CT scanner (because CT scans typically take only a few minutes to complete, including patient preparation) has been proven unfounded because the advances in PET technology ensure a more temporally balanced study; an entire PET/CT examination can now be completed in 10–15 min.
An expanding body of literature now supports the improved accuracy of staging and restaging with PET/CT, compared with either CT or PET acquired separately (109,110). Most of these conclusions have been published within the past 2 or 3 y, documenting significant improvements in specificity and, to some extent, sensitivity and in early detection of cancer recurrence (111). These are incremental improvements that are compared with a technique (PET) that already demonstrates high levels of sensitivity and specificity for a wide range of disease states. Based on published results from major medical centers, the conclusion that the accuracy of PET/CT is clinically unproven (112) now seems to be untenable. This also applies to the suggestion that the diffusion of the technology is some sort of marketing strategy devised by the vendors to promote their equipment. The future of PET/CT is being, and will be, decided by actual contributions to patient care such as those described in the publications cited here and not by any form of commercial promotion. To suggest otherwise does a disservice to the medical community and to its patients.
The perception that software fusion is a competitive alternative to PET/CT and indeed offers several advantages, including lower cost and the ability to fuse images from any 2 (or more) modalities, is somewhat simplistic. Software fusion techniques will always have a clinical role, whether improving the registration of images acquired with PET/CT, aligning images from modalities for which there is no alternative hardware solution, or fusing PET/CT images with MRI for treatment planning. Fusion software may be widely available, but that is not the same as being routinely available. It is the routine, almost effortless, availability of coregistered CT and PET images for every patient that gives PET/CT the advantage. The most appropriate device may not always be the top of the line in instrumentation, and it is here that vendors have the responsibility to offer the best design for the clinical task. PET/CT users have recently been joined by a growing body of SPECT/CT users and, soon, by the early PET/MRI adopters, with applications initially to the brain (113). The diffusion of PET/CT and SPECT/CT into the clinical arena has been driven by physician demand based on increasingly well-established clinical results (109,110). As long as this trend continues, the future of hybrid imaging and of PET/CT, in particular, will be assured.
Acknowledgments
I express my gratitude to Misty Long, research technologist at the University of Tennessee, Knoxville, for providing most of the clinical images presented in this article and to Linda Paschal for help in preparing the final version of the manuscript. The development of the PET/CT prototype was supported in part by NIH grant R01 CA65856.
Footnotes
-
↵* NOTE: FOR CE CREDIT, YOU CAN ACCESS THIS ACTIVITY THROUGH THE SNM WEB SITE (http://www.snm.org/ce_online) THROUGH JUNE 2009.
-
David W. Townsend reports having an affiliation with Siemens Molecular Imaging, the company that manufactures one of the PET/CT scanner designs. No other potential conflict of interest relevant to this article was reported.
-
COPYRIGHT © 2008 by the Society of Nuclear Medicine, Inc.
References
- 1.↵
- 2.↵
- 3.↵
- 4.↵
- 5.↵
- 6.↵
- 7.↵
- 8.↵
- 9.↵
- 10.↵
- 11.↵
- 12.↵
- 13.↵
- 14.↵
- 15.↵
- 16.↵
- 17.↵
- 18.↵
- 19.↵
- 20.
- 21.↵
- 22.↵
- 23.↵
- 24.↵
- 25.↵
- 26.↵
- 27.↵
- 28.↵
- 29.↵
- 30.↵
- 31.↵
- 32.↵
- 33.↵
- 34.↵
- 35.↵
- 36.↵
- 37.↵
- 38.↵
- 39.↵
- 40.↵
- 41.↵
- 42.↵
- 43.↵
- 44.↵
- 45.↵
- 46.↵
- 47.↵
- 48.↵
- 49.↵
- 50.↵
- 51.↵
- 52.↵
- 53.↵
- 54.↵
- 55.↵
- 56.↵
- 57.↵
- 58.↵
- 59.↵
- 60.↵
- 61.↵
- 62.↵
- 63.↵
- 64.↵
- 65.↵
- 66.↵
- 67.↵
- 68.↵
- 69.↵
- 70.↵
- 71.↵
- 72.↵
- 73.↵
- 74.↵
- 75.↵
- 76.
- 77.↵
- 78.↵
- 79.↵
- 80.↵
- 81.↵
- 82.↵
- 83.↵
- 84.↵
- 85.↵
- 86.↵
- 87.↵
- 88.↵
- 89.↵
- 90.↵
- 91.↵
- 92.↵
- 93.↵
- 94.↵
- 95.↵
- 96.↵
- 97.↵
- 98.↵
- 99.↵
- 100.↵
- 101.↵
- 102.↵
- 103.↵
- 104.↵
- 105.↵
- 106.↵
- 107.↵
- 108.↵
- 109.↵
- 110.↵
- 111.↵
- 112.↵
- 113.↵
- Received for publication January 31, 2008.
- Accepted for publication February 6, 2008.


Jump to section
Related Articles
Cited By...
- Image Quality and Activity Optimization in Oncologic 18F-FDG PET Using the Digital Biograph Vision PET/CT System
- Performance Evaluation of G8, a High-Sensitivity Benchtop Preclinical PET/CT Tomograph
- Feasibility of 18F-FDG Dose Reductions in Breast Cancer PET/MRI
- David Versus the Goliaths for the Detection of Bone Metastases
- Forward to the Past: The Case for Quantitative PET Imaging
- IMAGING IN ENDOCRINOLOGY: 2-[18F]-fluoro-2-deoxy-D-glucose positron emission tomography/computed tomography in differentiated thyroid carcinoma: clinical indications and controversies in diagnosis and follow-up
- Qualitative and Quantitative Comparison of PET/CT and PET/MR Imaging in Clinical Practice
- Subregional Patterns of Preferential Striatal Dopamine Transporter Loss Differ in Parkinson Disease, Progressive Supranuclear Palsy, and Multiple-System Atrophy
- FDG-PET/CT-guided biopsy of bone metastases sets a new course in patient management after extensive imaging and multiple futile biopsies
- Molecular Mechanisms of Bone 18F-NaF Deposition
- PET/MRI: Paving the Way for the Next Generation of Clinical Multimodality Imaging Applications
- Quantitative Analysis of Myocardial Perfusion SPECT Anatomically Guided by Coregistered 64-Slice Coronary CT Angiography
- Software Fusion: An Option Never Fully Explored