


Abstract
G8 is a benchtop integrated PET/CT scanner dedicated to high-sensitivity and high-resolution imaging of mice. This work characterizes its National Electrical Manufacturers Association NU 4-2008 performance where applicable and also assesses the basic imaging performance of the CT subsystem. Methods: The PET subsystem in G8 consists of 4 flat-panel detectors arranged in a boxlike geometry. Each panel consists of 2 modules of a 26 × 26 pixelated bismuth germanate scintillator array with individual crystals measuring 1.75 × 1.75 × 7.2 mm. The crystal arrays are coupled to multichannel photomultiplier tubes via a tapered, pixelated glass lightguide. A cone-beam CT scanner consisting of a MicroFocus x-ray source and a complementary metal oxide semiconductor detector provides anatomic information. Sensitivity, spatial resolution, energy resolution, scatter fraction, count-rate performance, and the capability of performing phantom and mouse imaging were evaluated for the PET subsystem. Noise, dose level, contrast, and resolution were evaluated for the CT subsystem. Results: With an energy window of 350–650 keV, the peak sensitivity was 9.0% near the center of the field of view. The crystal energy resolution ranged from 15.0% to 69.6% in full width at half maximum (FWHM), with a mean of 19.3% ± 3.7%. The average intrinsic spatial resolution was 1.30 and 1.38 mm FWHM in the transverse and axial directions, respectively. The maximum-likelihood expectation maximization reconstructed image of a point source in air averaged 0.81 ± 0.11 mm FWHM. The peak noise-equivalent count rate for the mouse-sized phantom was 44 kcps for a total activity of 2.9 MBq (78 μCi), and the scatter fraction was 11%. For the CT subsystem, the value of the modulation transfer function at 10% was 2.05 cycles/mm. Conclusion: The overall performance demonstrates that the G8 can produce high-quality images for molecular imaging–based biomedical research.
PET is a widely used imaging modality for noninvasive, in vivo studies of biologic processes and has found wide application in pharmacology, genetics, pathology, and oncology (1,2). The demand for in vivo experiments with animal models of disease in translational research has been a driving force behind the advances in dedicated small-animal PET instruments (3,4).
In molecular imaging applications, an anatomic reference is commonly required to help localize the molecular signal and assist quantification of tracer concentration (5,6). CT is a modality that can provide fully tomographic anatomic information for better molecular signal localization (7). Volumetric CT data also facilitate tracer quantification by guiding corrections for attenuation (8), scattering of γ-energy in the object (9), and partial-volume effect (10). Besides, CT leads to accurate organ registration and image analysis when used with the mouse atlas registration algorithm developed at our institute (11).
G8 is an integrated PET/CT system implemented by Sofie Biosciences. It incorporates a cone-beam CT scanner and digital data acquisition electronics (PicoDigitizer). Compared with the previous G4 system (12,13), each panel detector uses 2 extra rows of crystals at the transverse edges of the field of view (FOV), reducing the gap between detectors. Instead of 1-mm clear glass in G4, a tapered, pixelated lightguide is used in G8 to couple each crystal array to a single photomultiplier tube (PMT), improving scintillation light collection and its uniformity.
This work aims to characterize the overall performance of the G8 PET/CT system. Studies including sensitivity, spatial resolution, energy resolution, scatter fraction, count-rate performance, and image quality were performed for the PET subsystem following the National Electrical Manufacturers Association (NEMA) NU 4-2008 standards (14) when possible. The noise, dose level, contrast, and spatial resolution were evaluated for the CT subsystem. In vivo rodent studies using radiolabeled tracers were acquired to demonstrate the capability of the G8 for high-sensitivity, high-resolution molecular imaging. Representative animal images are shown to emphasize the complementary nature of the molecular and anatomic information provided by this integrated PET/CT imaging platform.
MATERIALS AND METHODS
System Description
The G8 uses 4 opposing panel detectors placed at a face-to-face spacing of 5 cm, arranged in a compact, boxlike geometry. The effective area of each panel is 47.44 × 94.95 mm, large enough to cover the whole body of a laboratory mouse (18–40 g). Each panel consists of 2 modules, and each module comprises a 26 × 26 pixelated bismuth germanate (BGO) scintillator array with individual crystals measuring 1.75 × 1.75 × 7.2 mm (±0.05 mm) and a pitch of 1.83 mm (Proteus). The 4 long sides of each individual crystal and the entrance surface of the scintillator array were bonded with specular optical reflector (3M). A tapered, pixelated glass lightguide was used to couple the crystal array to the photosensitive area of an H8500 multianode PMT (MAPMT; Hamamatsu Photonics). The scintillator array, lightguide, and MAPMT were permanently bonded with epoxy.
The front-end read-out electronics of each detector are integrated in a printed circuit board directly connected to the PMT. A charge-division readout circuit is used to convert the 64 anode outputs from each MAPMT into energy and 2 position signals (x and y), whereas the timing signal is obtained directly from the 12th dynode on the PMT. The signals from all 8 detector modules (4 signals per module) are digitized by 32 free-running 125-MHz analog-to-digital converters, at 14 bits per sample (PicoDigitizer). These digital samples are then processed in a Xilinx Virtex-6 field programmable gate array (Xilinx) in real time for event triggering, validation (15), and coincidence sorting. Energy discrimination is performed offline in software, during event histogramming. A delayed timing window is implemented in the field-programmable gate array to estimate random coincidence event rates (16).
All measurements in this work were postprocessed with an energy window of 350–650 keV (17). The only exception was the sensitivity measurement, for which the lower energy threshold was varied between 150 and 350 keV to show the influence of energy window on sensitivity. The coincidence timing window was set to 20 ns. The acquired list-mode data were histogrammed into projection files, with delayed events subtracted to correct for random coincidences. Component-based normalization (18) was applied to compensate for the differences in individual detector efficiencies, estimated from measurements of a cylindric source filled with 18F. The acceptance angles were not restricted by the system hardware, and all geometrically possible lines of response were acquired. For image reconstruction, the line of response with the largest acceptance angle crossing the FOV was 76° in the transverse direction and 59° in the axial direction. Fully 3-dimensional tomographic images were reconstructed by a maximum-likelihood expectation-maximization (MLEM) algorithm with incorporation of a system model based on a parameterized detector response (19). The system response matrix used in the MLEM reconstruction corresponds to symmetric cubic voxels with a side equal to one fourth the pitch of the crystals in the detector, and the cubic voxel size is 0.46 × 0.46 × 0.46 mm. A total of 60 full iterations (no subsets) was used for image reconstruction, with no regularization and no postreconstruction smoothing. The rectangular system geometry precludes the use of conventional linear image reconstruction algorithms.
A cone-beam CT scanner consisting of a MicroFocus x-ray source (50 kV Magnum; Moxtek) and a complementary metal oxide semiconductor detector (Dexela 1512) was implemented to provide anatomic information, assisting PET signal localization and quantification. The CT scanner runs in continuous rotation mode and acquires 720 projections over one full 360° rotation in about 1 min. The x-ray source operates at 50 kVp with a maximum anode current of 200 μA. Images were reconstructed with a Feldkamp filtered backprojection algorithm (ramp filter) and a voxel size of 0.2 mm (20). The reconstructed FOV of the CT scanner was 5 × 5 × 10 cm. The CT and PET subsystems in the G8 are mounted on a common gantry with a shared life-supporting chamber (21). The inherent coregistration of the functional PET images and anatomic CT images is achieved with a calibration step in a common spatial frame (22). A schematic of the G8 PET/CT scanner is shown in Figure 1, and the characteristics of the G4 and the G8 systems are summarized in Table 1.

Schematic of G8 PET/CT tomograph.
Characteristics of G4 and G8 Systems
Energy Resolution
A 0.22-MBq 68Ge cylindric source (Eckert and Ziegler Isotope Products) with a diameter of 37 mm and a length of 100 mm was placed at the center of the field of view (CFOV) of the PET subsystem to acquire a 2-dimensional flood irradiation for each detector module. A semiautomated program defined the crystal look-up tables that classify regions in the flood image into the proper crystal of the scintillator array. Energy spectra of individual crystals were extracted on the basis of the look-up tables, and a gaussian function was fitted to the photopeak of each energy spectrum. Energy resolution was measured for every crystal in the scanner as the full width at half maximum (FWHM) of the gaussian function divided by the energy corresponding to the center of the photopeak, expressed as a percentage.
Spatial Resolution
A 0.34-MBq 22Na point source with a nominal size of 0.3 mm, embedded in a 1-cm3 piece of acrylic was used (NEMA NU 4–compliant, Eckert and Ziegler Isotope Products). Measurements were not corrected for the physical source dimensions, positron range, or noncollinearity of positron annihilation γ-energy.
Intrinsic Spatial Resolution
Starting from the CFOV of the PET subsystem, the point source was attached to a translation stage and stepped at 0.4-mm steps across 13 crystals along the long axis of the FOV (half the axial length of a detector module). Because of geometric restriction by the side detectors, the point source could not be stepped across half the detector module along the short axis. Instead, the source was stepped across the central 14 crystals in a transverse plane of a detector module. Acquisition time was 60 s at each location. Coincidence counts for directly opposing crystal pairs were plotted as a function of source location. The count distribution of each crystal pair was fitted with a gaussian function, and the FWHM determined the intrinsic spatial resolution of the detectors.
Image Spatial Resolution
The point source was imaged at 2 axial locations: the axial CFOV and one fourth the axial FOV, 23.8 mm from the center along the axial direction. For each of these locations, the source was placed at 0, 5, 10, and 15 mm from the geometric center along the transverse FOV. Acquisition time was 1 min at each position, and more than 105 prompt counts were acquired per measurement. The NEMA NU 4 document also recommends measurements at 20 and 25 mm from the center, which were not included in this study because of the geometric restriction. Because of the box-shaped geometry of the tomograph, conventional filtered backprojection reconstruction was not available and therefore, in a significant deviation from the NEMA protocol, images were reconstructed using the MLEM algorithm. As specified in the NEMA NU 4-2008 protocol, the response function was formed by summing 1-dimensional profiles that were parallel to the radial, tangential, and axial directions. A parabolic fit of the peak point and its 2 nearest neighboring points was used to determine the maximum value of the response function. Linear interpolation between adjacent pixels was used to determine the position of half and one tenth the parabolic curve maximum.
Sensitivity
A 68Ge pointlike source (Eckert and Ziegler Isotope Products) embedded in thin steel tubing was used to measure absolute sensitivity. The thin steel casing ensures annihilation of all the positrons, with only nominal attenuation of the 511-keV γ-rays—an amount that was assumed to be insignificant in this study. The activity of the point source was 1.62 kBq measured in a calibrated well-type γ-counter (Wallac Wizard 1480; Perkin Elmer). The activity was low enough to keep the counting losses to less than 1% and the randoms rate to less than 5% of the true event rate, fulfilling the NEMA NU 4-2008 recommendations. The axial sensitivity profile was measured with the 68Ge source stepped from end to end of the axial FOV, with the axial positions of the source determined from the reconstructed images. The number of coincidences was recorded at each position for 60 s. Delayed coincidences were subtracted from prompts before the true coincidences were divided by the actual source activity. This ratio was corrected for the branching ratio of 68Ga (0.89), but the attenuation of the steel material surrounding the source was not compensated for. The average sensitivity for a mouse-sized object (with a 7-cm axial length) was calculated from the measured axial sensitivity profile.
Scatter and Count-Rate Performance
Count-rate performance was evaluated using the NEMA NU 4 mouse-sized phantom, which is a 70-mm-long and 25-mm-diameter solid cylinder made of high-density polyethylene (0.96 g/cm3), with a 3.2-mm-diameter hole drilled parallel to the central axis at a radial offset of 10 mm. A flexible tube filled with 18F solution was inserted into the 3.2-mm hole of the phantom. The initial activity was measured to be 18.8 MBq using a dose calibrator (Atomlab 300; Biodex Medical Systems) at the start of the acquisition. The phantom was centered in the FOV and rotated by 45° to achieve a more symmetric source distribution that also more closely represents the expected spatial distribution in mouse studies. A life-supporting chamber was included in the FOV for this measurement, creating a more realistic scatter environment.
The data were processed as specified by NEMA NU 4. The scatter fraction was measured using a prompt sinogram with an activity of 185 kBq. This low-activity frame was chosen to ensure that dead time and randoms did not affect the measurement. The scattered count rate was then calculated by Equation 1:
 Eq. 1
Eq. 1where Rscatter, Rprompt, Rtrue, and Rrandom are the scatter, prompt, true, and random event rates, respectively. The scatter fraction (SF) was calculated by Equation 2:
 Eq. 2
Eq. 2The noise-equivalent count rate (NECR) for each prompt sinogram was determined using the following equation:
 Eq. 3
Eq. 3CT Subsystem Performance
For the CT subsystem, we measured noise, dose, contrast, and spatial resolution. First, a 25-mm-diameter plastic cylinder filled with water was imaged, and noise was calculated as the ratio of the SD over the average value in a 4,000-mm3 uniform region. Dose was measured by placing a 10-cm-long, pencil-shaped ionization chamber, model 10X5-3CT (Radcal Corp.), in a life-supporting chamber (including the cover) and acquiring a scan with the standard protocol. The 10-cm wire was entirely in the x-ray cone beam (10.6 cm). The dose was measured 5 times and averaged. For image contrast, a 25-mm-diameter acrylic glass phantom containing six 2-mm-diameter rods containing 4 iodine concentrations (750, 250, 50, and 0 mg/mL) was scanned. The average image value in each rod was calculated and plotted against the nominal rod iodine concentration. Linearity was assessed by the coefficient of determination (R2) of a linear regression (ordinary least squares). Finally, resolution was measured with a micro-CT wire phantom (QRM GmbH) containing a 25-μm-diameter tungsten wire. The Fourier transform of a profile across the image (line-spread function) was used to calculate the modulation transfer function, and we report the resolution as the value of the modulation transfer function at 10% of the maximum.
Imaging Studies
NEMA Phantom Study
Image-quality studies were performed using the NEMA NU 4 image-quality phantom. The phantom (Data Spectrum Corp.) consists of 3 regions: a main fillable uniform region allowing the uniformity to be measured; a lid that attaches to the main fillable region, containing 2 smaller cold regions (filled with water and air) used to quantify the spillover ratio; and a solid acrylic region with 5 cylindric holes for measuring the recovery coefficients as a function of rod diameter. Because the G8 was designed for use with a low injection dose, the image-quality phantom was filled with 1.85 MBq of 18F solution measured with a dose calibrator (Atomlab 300; Biodex Medical Systems). This activity is half the activity level recommended by the NEMA NU 4 protocol. The phantom was placed on a life-supporting chamber to simulate in vivo imaging, and data were acquired for 20 min as prescribed in the NEMA NU 4 protocol. Detector efficiency normalization and random event corrections were applied, but no scatter correction was applied. A CT scan of the phantom and its supporting bed was acquired, and the reconstructed CT image defining the data acquisition geometry was forward-projected through the PET system response matrix to generate attenuation correction of the PET data.
A 22.5-mm-diameter and 10-mm-high cylindric volume of interest was drawn over the center of the uniform region of the image-quality phantom. The average concentration values and SD in this volume of interest were measured to estimate the noise performance as a measure of uniformity. The image slices covering the central 10-mm length of the rods were averaged to obtain a single image slice of lower noise. Circular regions of interest were drawn in this image around each rod, with diameters twice the physical diameters of the rods. The maximum values in each of these regions of interest were measured and divided by the mean value obtained in the uniformity test to obtain the recovery coefficient for each rod size. The transverse image pixel coordinates of the locations with the maximum region-of-interest values were recorded and used to create 10-mm-long line profiles along the rods in the axial direction. The SD of the pixel values measured along each of these line profiles was calculated. Although no scatter correction was applied to the acquired dataset, the spillover ratio of the water- and air-filled cold-region chamber was calculated as specified in the NEMA NU 4 standard to provide a rough estimation of the scatter effects. The diameter of the volume of interest was 4 mm and encompassed the central 7.5-mm length in the axial direction. The ratio of the mean in each cold region to the mean of the hot uniform area was reported as spillover ratio.
Mouse Study
The UCLA Animal Research Committee approved the animal studies, which were performed according to the guidelines of the Department of Laboratory Animal Medicine at UCLA. C57BL6 mice were anesthetized with 2% isoflurane in oxygen and injected via the tail vein with 2.78 MBq of 18F-FDG or 2.70 MBq of 89Zr-anti-CD8 antibody. The animals were kept warm on heating pads throughout the imaging procedures. After 60 min (18F-FDG) or 6 d (89Zr-anti-CD8 antibody) of tracer biodistribution, the mice were anesthetized and placed in dedicated G8 imaging chambers for PET/CT imaging. PET scans were acquired for 10 min (18F-FDG) or 20 min (89Zr-anti-CD8) with an energy window of 350–650 keV reconstructed using MLEM, followed by CT acquisition. All PET images were corrected for CT-based photon attenuation, detector normalization, and radioisotope decay (scatter correction was not applied) and converted to units of percentage injected dose per gram. Images were analyzed using AMIDE, version 1.0.4 (23), and OsiriX (http://www.osirix-viewer.com).
RESULTS
Energy Resolution and Flood Histograms
Supplemental Figures 1A and 1B show the flood images acquired from 2 detector modules in 1 panel (supplemental materials are available at http://jnm.snmjournals.org). For the crystals in all 4 panels, the measured energy resolution ranged from 15.0% to 69.6% FWHM, with a mean of 19.3% ± 3.7%. Supplemental Figure 1C shows a vertical profile across 1 column of crystals shown in Supplemental Figure 1A with a peak-to-valley ratio of 4.5, and Supplemental Figure 1D shows a horizontal profile across 1 row of crystals shown in Supplemental Figure 1B with a peak-to-valley ratio of 4.8.
Spatial Resolution
Intrinsic Spatial Resolution
The intrinsic spatial resolution of an opposing detector pair is shown in Figure 2. For crystal pairs along the detector short axis, the measured FWHM ranged from 1.16 to 1.41 mm, with an average value of 1.30 ± 0.08 mm. For crystal pairs along the detector long axis, the measured FWHM ranged from 1.27 to 1.64 mm, with an average value of 1.38 ± 0.10 mm.

Intrinsic spatial resolution measured with 22Na point source in direction along detector short axis (A) and along detector long axis (B).
Image Spatial Resolution
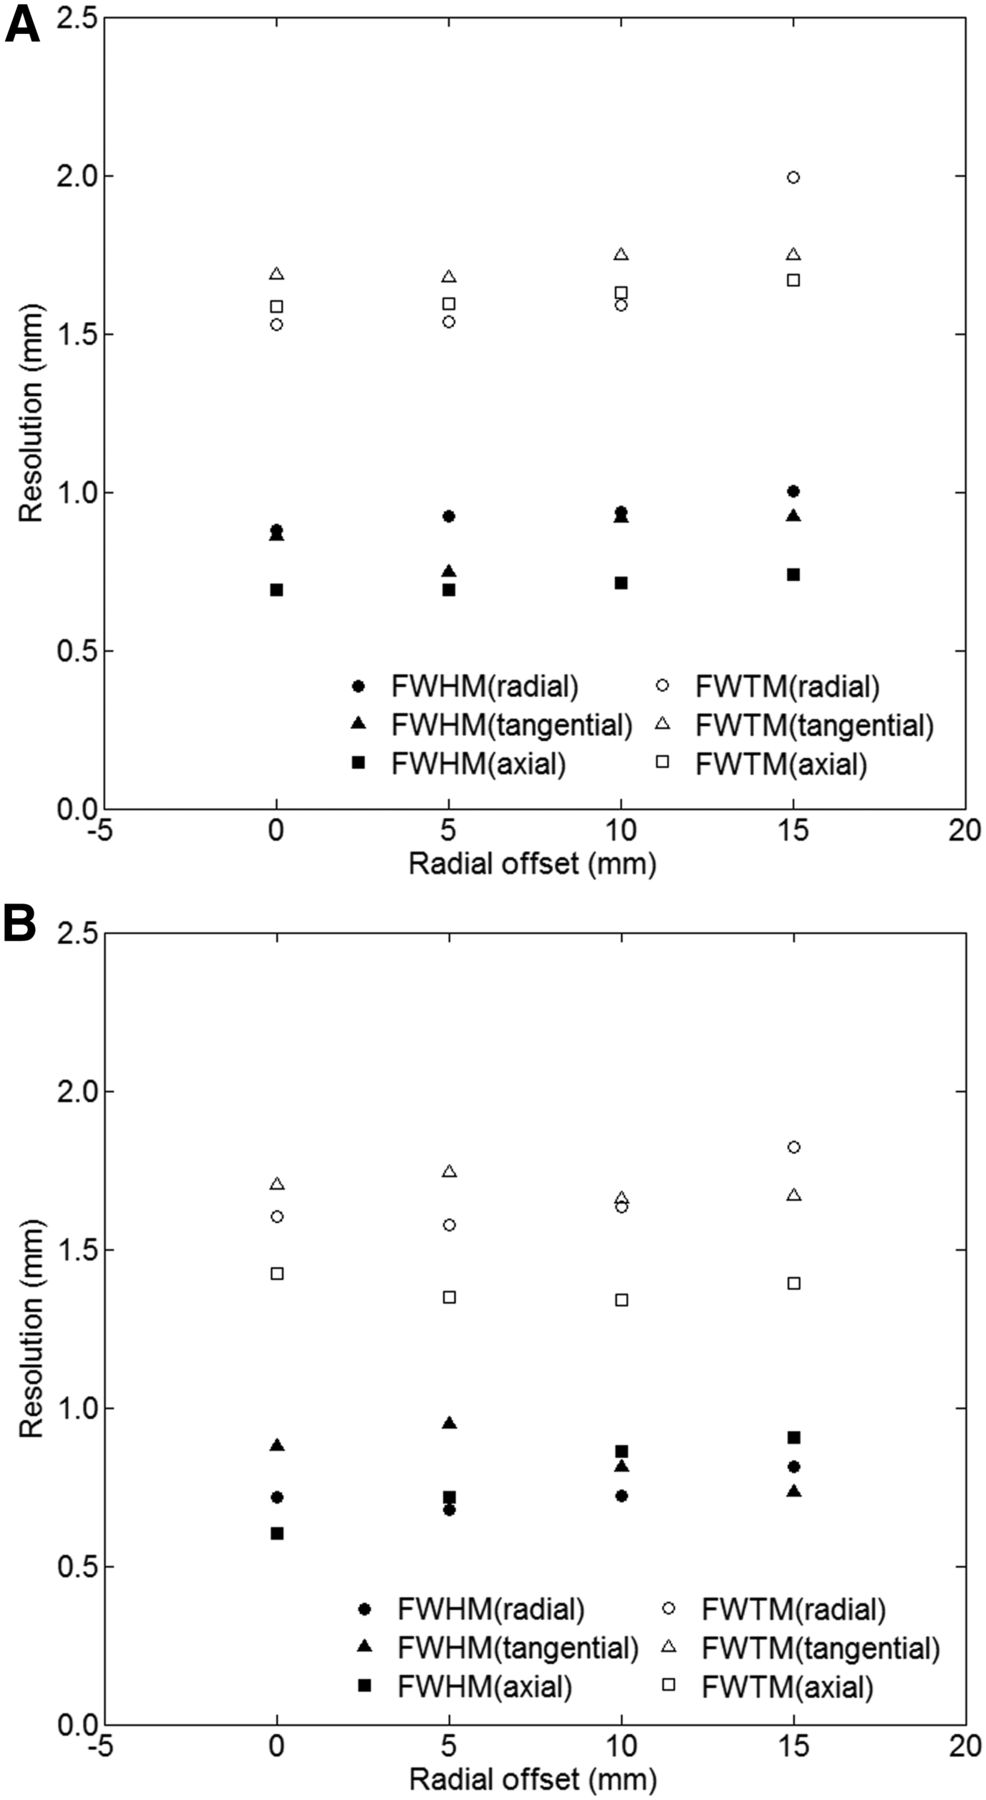
Figures 3A and 3B show the reconstructed image spatial resolution in the radial, tangential, and axial directions measured in the central and one fourth axial transverse plane, ranging from 0.60 to 1.01 mm, with an average value of 0.81 ± 0.11 mm.

MLEM reconstructed image spatial resolution of G8 system, showing FWHM and full width at tenth of maximum (FWTM) of radial, tangential, and axial image resolution at axial CFOV (A) and 23.75 mm from axial CFOV toward axial edge of FOV (B).
Sensitivity
Table 2 summarizes the absolute system sensitivity for different energy window settings at 10 mm from the axial CFOV toward the axial edge of the FOV, as well as for the axial CFOV. The maximum system sensitivity was 17.8% measured 10 mm from the axial CFOV and with a lower-level discriminator of 150 keV.
Absolute System Sensitivity as Function of Lower-Level Discriminator at 10-mm Axial Offset and at Axial CFOV
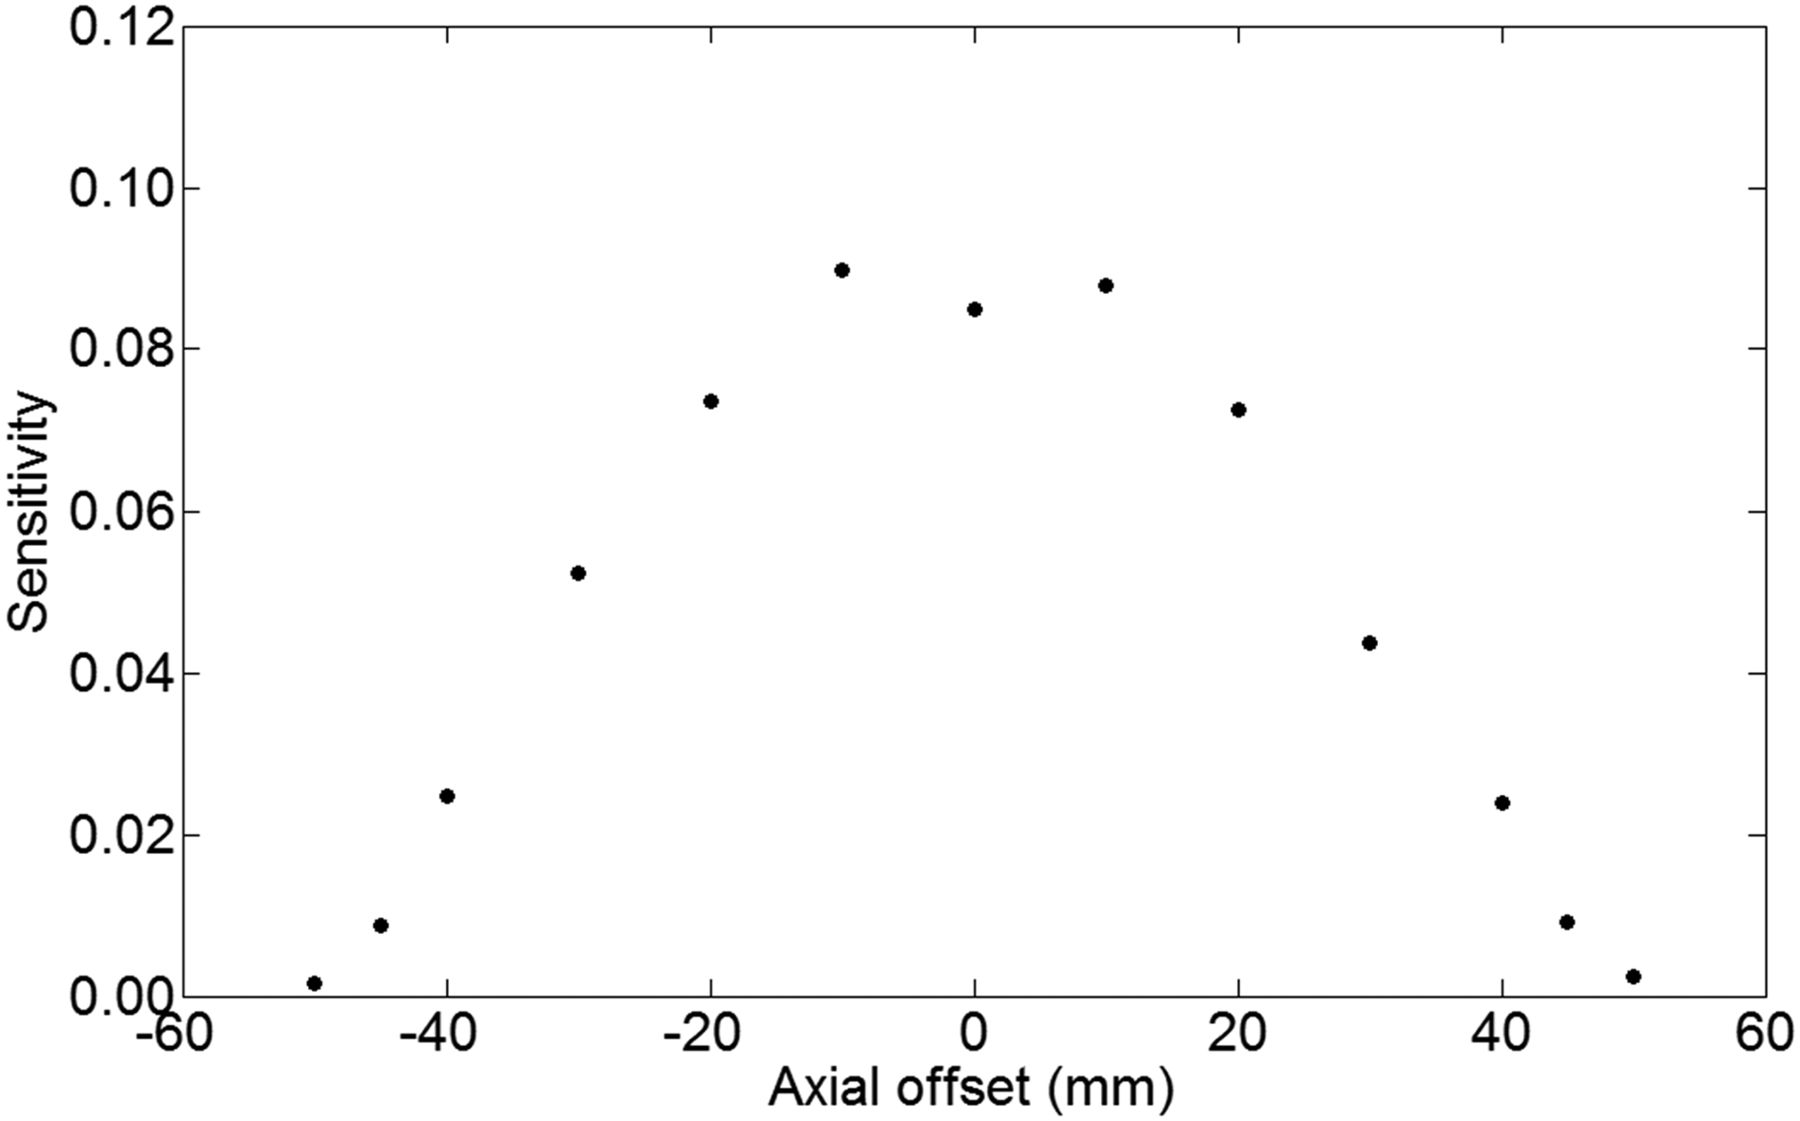
In previous work, a lower-level discriminator of 350 keV was recommended as the optimized energy threshold for PET systems with detector geometries such as the G8 (17). With the optimal energy window of 350–650 keV, the G8 had a peak system sensitivity of 9.0% measured 10 mm from the axial CFOV. At the axial CFOV, the sensitivity was 8.6%. The axial sensitivity profile with the energy window of 350–650 keV is shown in Figure 4. The average sensitivity for a mouse-sized object (7-cm axial length) was 6.8%.

Absolute system sensitivity as function of axial position. Energy window was 350–650 keV.
Scatter and Count-Rate Performance
The prompt, random, and NECRs as a function of total activity in the mouse-sized phantom are plotted in Figure 5. The prompt rates peaked at around 3.6 MBq of total activity. With this activity, the random events accounted for approximately 7% of the total prompt counts. The peak NECR was 44 kcps achieved at a total phantom activity of 2.9 MBq. The scatter fraction for the mouse-sized phantom was 11%.

Count rate of G8 system as function of line source activity.
CT Subsystem Performance
The calculated noise level in the uniform region of the water cylinder was 2.8%. The average dose per scan was 50.1 ± 1.2 mGy. The G8 CT component does not have a mechanical shutter in front of the x-ray source and therefore, while the system is waiting for the source voltage to ramp-up and the current to stabilize, some dose is given to the subject. This contribution was estimated to be about 7 mGy, or 14% of the total dose received. The contrast linearity (the CT value in the reconstructed image against the iodine concentration for each rod) was excellent both visually and as expressed by the coefficient of determination (R2 = 0.9998). The modulation transfer function (10%) of the CT system was 2.05 cycles/mm. This value approximately corresponds to a FWHM of 0.4 mm.
Imaging Studies
NEMA Phantom Study
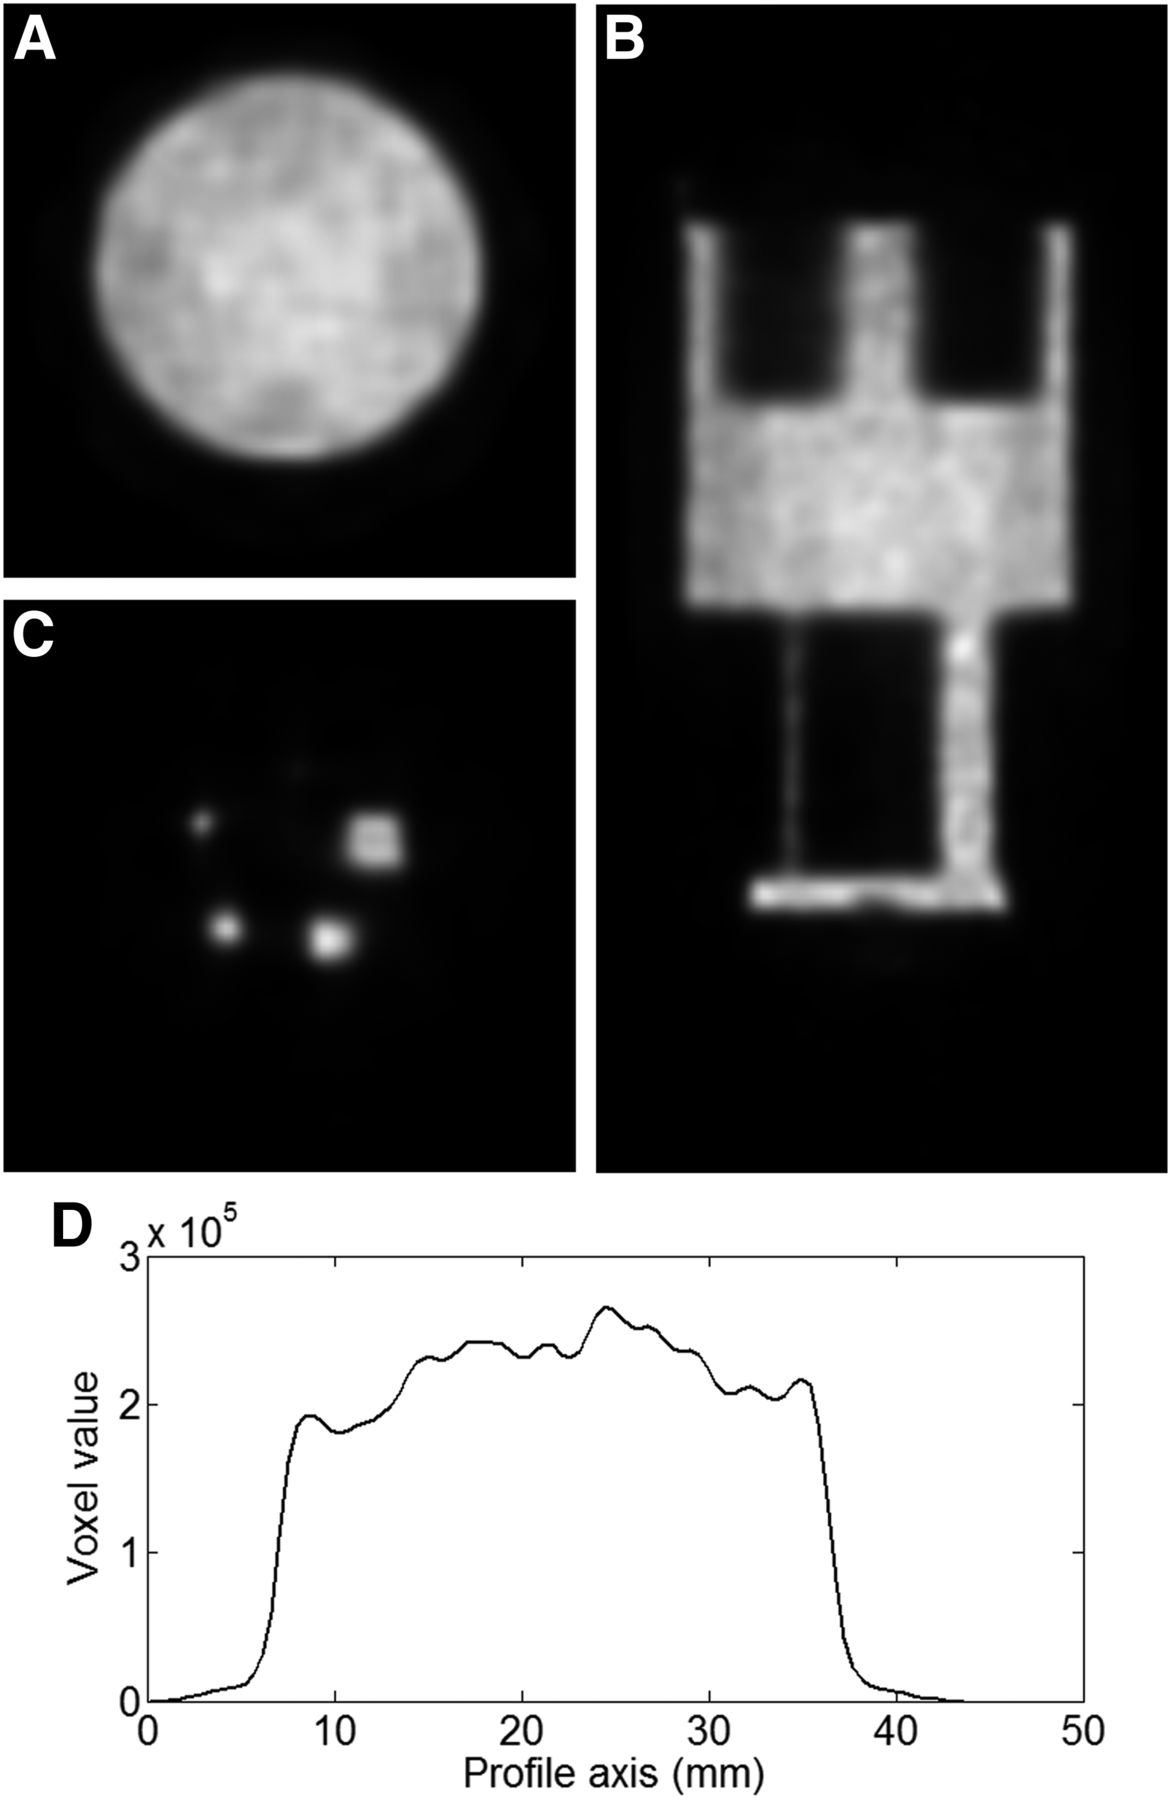
Figure 6 shows the images (single slice, 0.46 mm thick) of a transverse plane of the uniform region, a coronal plane, a transverse plane with the 5 resolution recovery rods, and a profile across the uniform area of the NEMA image-quality phantom. With the MLEM reconstruction, the SD in the uniform region was 7.7%. The recovery coefficients for the 5 different rod sizes from 1 to 5 mm in diameter were 0.11 ± 0.01, 0.70 ± 0.08, 1.07 ± 0.09, 1.10 ± 0.11, and 1.04 ± 0.09. The spillover ratios in the water- and air-filled cold-region chambers were 7.5% ± 2.1% and 5.4% ± 1.2%, respectively.

Reconstructed images of NEMA NU 4 image-quality phantom, filled with 18F (1.85 MBq) and imaged for 20 min: transverse slice of uniform region (A); coronal slice (B); transverse slice of rod region (C); profile across uniform area (D).
Mouse Study
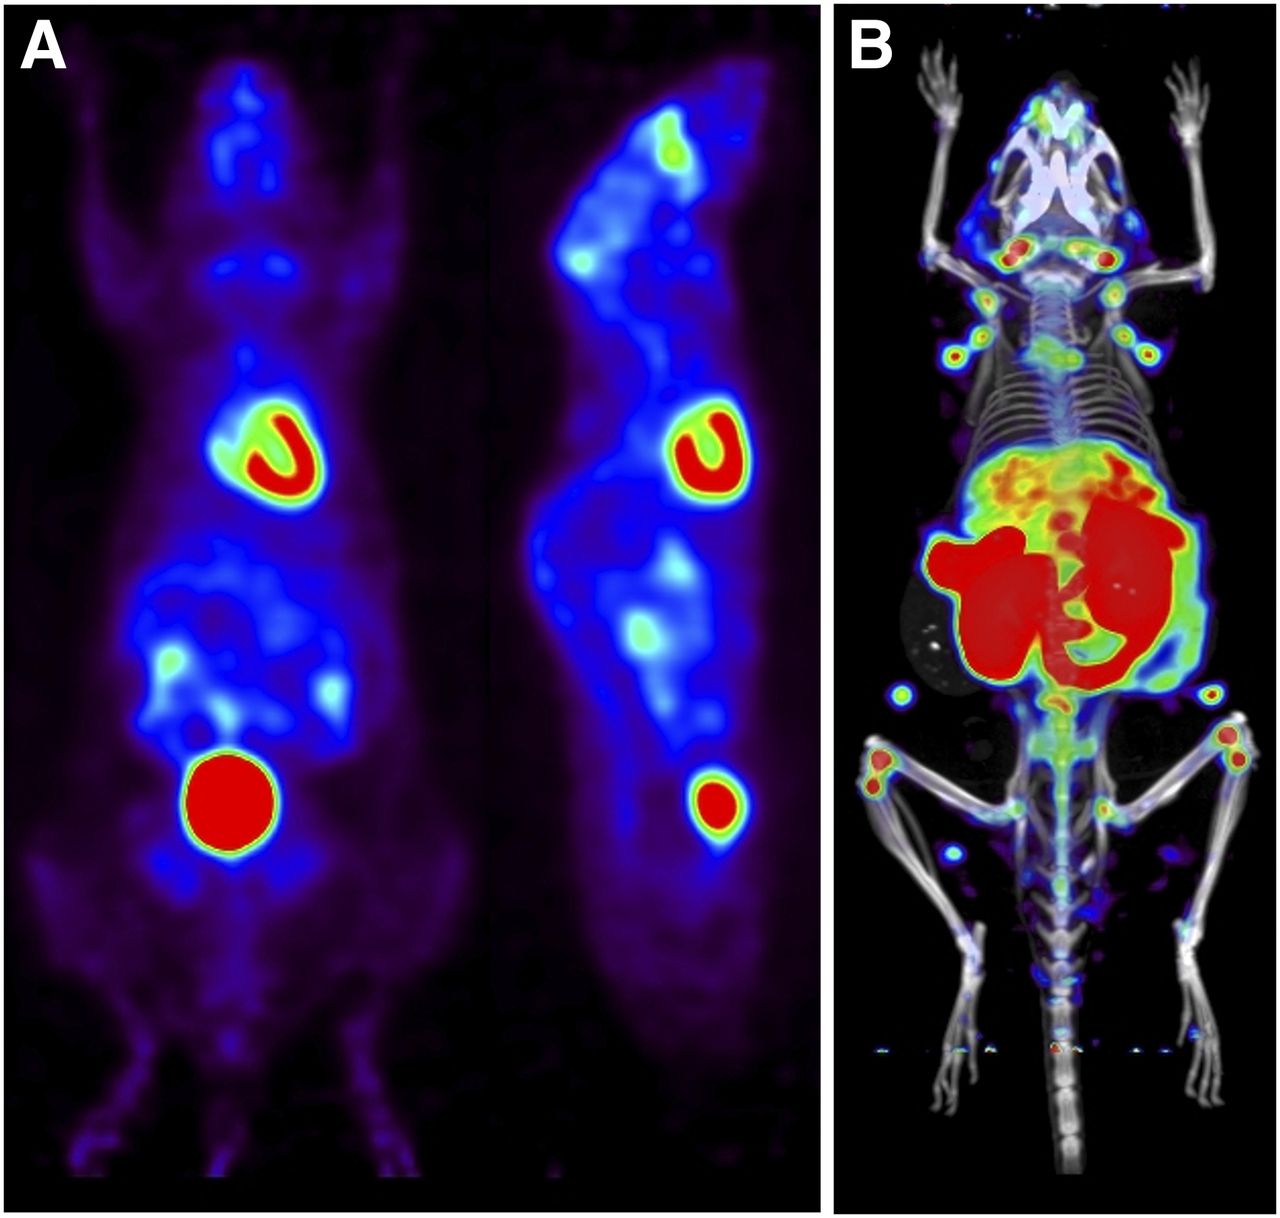
Representative images of the biodistribution of 2 PET tracers radiolabeled with different radioisotopes, 18F-FDG and 89Zr-anti-CD8 antibody, are shown in Figure 7. Figure 7A shows coronal and sagittal images from a 10-min 18F-FDG study on C57BL6 mice, distinguishing the myocardium from the blood pool and identifying other tissues such as the Harderian glands, brain including cerebellum, spinal column, intestines, kidneys, and bladder. The activity in the entire mouse was 1.96 MBq at scan time. Figure 7B illustrates the capabilities of the PET/CT combination system in a study of immunocompetent C57BL6 mice injected with 89Zr-anti-CD8 antibody. A reconstructed 3-dimensional volumetric PET image was registered with the CT dataset. The maximum-intensity-projection image of a 20-min scan shows well-defined mappings of the lymphoid organs spleen, thymus, and lymph nodes, particularly the axillary, brachial, cervical, inguinal, and popliteal lymph nodes. The expected biodistribution to the liver, kidneys, and bone was also observed. The activity in the entire mouse was 0.34 MBq at scan time.

Reconstructed images of C57BL6 mice injected with 18F-FDG and 89Zr-anti-CD8 antibody. (A) 10-min static PET coronal and sagittal slices of mouse 60 min after injection of 18F-FDG (1.96 MBq at scan time). (B) 20-min static PET/CT maximum-intensity projection of mouse 6 d after injection of 89Zr-anti-CD8 antibody (0.34 MBq at scan time).
DISCUSSION
This investigation has evaluated the overall performance of the G8 PET/CT preclinical system. The PET component was evaluated according to the NEMA NU 4 standards with modifications as necessary. Noise, dose level, contrast, and resolution were evaluated for the CT component.
Besides an addition of 2 extra rows of crystals at the transverse edges of the FOV to reduce the gap between detectors, slightly different crystal dimensions, and segmented lightguides, a major change from the G4 to the G8 system is the data acquisition electronics used for detector signal digitization and processing. The G8 uses upgraded data acquisition electronics with twice the number of analog-to-digital converter channels. The outputs from each of the MAPMTs in 1 detector panel are separately multiplexed into 4 signals (energy, x, y, and dynode), and 8 analog-to-digital converters are used to process the signals from each detector panel.
The increased granularity of the detector readout scheme in the G8 leads to an extended system dynamic range and better count rate performance. In the G4, the NECR peak was reached at lower total activity than for comparable instruments, because of its compact system geometry, the long decay time of BGO, and the multiplexed electronics (12,15). For each γ-interaction in a detector module, the BGO signal is integrated for 800 ns, during which no new event detection is possible. In the G8, when a γ-photon interacts with one of the 2 modules in a detector panel, the other module is still capable of event detection because the 2 modules in the panel are optically isolated and are read out separately. As a result, the activity at the NECR curve peak for the G8 is nearly double, at 2.9 MBq, the 1.5 MBq for the G4. Because the design goal of the G8 has been high-sensitivity imaging of mice at a low injected dose, imaging with a dose higher than the NECR peak activity is not recommended. The detector would be saturated with pulse pileup, which may introduce image artifacts and compromise the spatial resolution. The system, though, can be used with much lower amounts of injected activity than are typical in the field (e.g., 0.34 MBq of 89Zr, as shown in Fig. 7).
The new readout scheme also includes modifications of the detector and lightguide design. For each detector panel in the G4, 1 BGO scintillator array is coupled to 2 MAPMTs via 1 mm of clear glass. The scintillation light from crystals at the junction of the 2 MAPMTs is distributed to both MAPMTs. Light collection for these crystals is diminished because of the large insensitive area at the junction, degrading crystal identification and energy resolution. In the G8, each detector panel consists of 2 separate and optically isolated BGO scintillator arrays. Each array is coupled to the sensitive area of 1 MAPMT using a tapered, pixelated lightguide. As a result, the loss of light at the PMT junction area is reduced (24).
The sensitivity measured at the CFOV is lower than that at ±10-mm axial offsets, as shown in Figure 4, which also results from the new detector readout scheme used in the G8. When an annihilation γ-photon interacts via scattering in 2 crystal arrays within 1 detector panel, the energy deposited in each crystal array will be detected as a separate event. This increases the probability that neither of the 2 detections is qualified in the energy window of 350–650 keV. As a result, a fraction of the events happening at the edge crystal between the 2 detectors in 1 panel will be rejected, reducing the measured sensitivity at the CFOV. This loss of events could also be observed in the intrinsic spatial resolution result. The number of counts for the left 2 profiles in Figure 2B, which correspond to the edge crystals close to the junction of 2 crystal arrays, is lower than that for other profiles. The use of measured sensitivity at the CFOV (8.6%) as the system peak sensitivity significantly underestimates the G8 system performance. The sensitivity for mouse imaging (6.8%), averaged from the 7-cm axial length of the sensitivity profile, is a more suitable parameter and compares favorably with other systems (25). For the measured sensitivity reported in this work, the attenuation of the steel material surrounding the source was not compensated for.
The MLEM-reconstructed-image spatial resolution shown in Figure 3 is fairly homogeneous within the entire FOV, because the flat-panel boxlike geometry of the G8 leads to depth of interaction errors that are more uniformly distributed in the FOV. Figure 3 also demonstrates that the implemented MLEM reconstruction accurately models the physical response of the scanner in the system matrix, despite the fact that the detection of coincidences along very oblique angles is allowed because of the close geometry of the scanner. The image spatial resolution averaged 0.8 mm FWHM, as is consistent with the choice of the reconstructed image voxel size (0.46 × 0.46 × 0.46 mm), showing that the reconstruction is implemented properly. However, this value is not representative of the actual image spatial resolution of the system during in vivo imaging, since the method of measuring the image spatial resolution defined in the NEMA NU 4-2008 standard is incompatible with the iterative reconstruction algorithm. Because the G8 system does not provide traditional filtered backprojection image reconstruction, we report here the iterative image reconstruction results as a reference. For in vivo studies, the crystal size and the detector intrinsic spatial resolution (∼1.4 mm) are better indicators of the reconstructed image spatial resolution.
CONCLUSION
This study evaluated the performance of the G8 integrated PET/CT system. With an energy window of 350–650 keV, the peak absolute sensitivity was 9.0% near the CFOV, and the average sensitivity for imaging a mouse-sized object (7-cm axial length) was 6.8%. The total activity at the peak NECR for the mouse-sized phantom was 2.9 MBq (78 μCi). The dynamic range of the G8 is significantly better than that of the previous-generation G4. The overall performance demonstrates that the G8 scanner is suitable for producing high-quality images for molecular imaging–based biomedical research.
DISCLOSURE
Nam T. Vu and Zheng Gu are currently employees of Sofie Biosciences, Inc. Nam T. Vu and Arion F. Chatziioannou are shareholders of Sofie Biosciences, Inc. This work was supported by the UCLA Foundation from a donation made by Ralph and Marjorie Crump for the UCLA Crump Institute for Molecular Imaging and in part by the National Cancer Institute P30 CA016042 Cancer Center Support Grant. No other potential conflict of interest relevant to this article was reported.
Acknowledgments
We thank Richard Tavaré and Kirstin Zettlitz from the Anna Wu Lab at the Crump Institute for Molecular Imaging at UCLA for providing the 89Zr-anti-CD8 antibody, and we thank the staff of the UCLA Ahmanson Biomedical Cyclotron Facility for providing 18F-ion and 18F-FDG. We also thank Waldemar Ladno and Olga Sergeeva of the Crump Institute’s Preclinical Imaging Technology Center for their assistance with the imaging for this study.
Footnotes
Guest Editor: David Townsend, National University of Singapore
Published online Jun. 14, 2018.
- © 2019 by the Society of Nuclear Medicine and Molecular Imaging.
REFERENCES
- Received for publication February 2, 2018.
- Accepted for publication June 12, 2018.


