


Abstract
Lung cancer remains responsible for more deaths worldwide than any other cancer, but recently there has been a significant shift in the clinical paradigm regarding the initial management of subjects at high risk for this disease. Low-dose CT has demonstrated significant improvements over planar x-ray screening for patient prognoses and is now performed in the United States. Specificity of this modality, however, is poor, and the additional information from PET has the potential to improve its accuracy. Routine screening requires consideration of the effective dose delivered to the patient, and this work investigates image quality of PET for low-dose conditions, in the context of lung lesion detectability. Reduced radiotracer doses were simulated by randomly discarding counts from clinical lung cancer scans acquired in list-mode. Bias and reproducibility of lesion activity values were relatively stable even at low total counts of around 5 million trues. Additionally, numeric observer models were developed and trained with the results of 2 physicians and 3 postdoctoral researchers with PET experience in a detection task; detection sensitivity of the observers was well correlated with lesion signal-to-noise ratio. The models were used prospectively to survey detectability of lung cancer lesions, and the findings suggested a lower limit around 10 million true counts for maximizing performance. Under the acquisition parameters used in this study, this translates to an effective patient dose of less than 0.4 mSv, potentially allowing a complete low-dose PET/CT lung screening scan to be obtained under 1 mSv.
Lung cancer is still the cancer with one of the worst prognoses and is a major source of mortality and morbidity. There were about 1.8 million new cases (12.9% of all cancers) and 1.5 million deaths from lung cancer worldwide in 2012 (1). Approximately 158,040 Americans died from the disease in 2015, accounting for 27% of all cancer deaths in the United States (2). Data from the Surveillance, Epidemiology and End Results program of the National Cancer Institute show that about 80% of patients are diagnosed with regional or distant disease, which is strongly associated with a poor overall survival rate (3).
CT lung cancer screening has been shown to improve survival over chest radiography. The National Lung Screening Trial recruited 53,454 current or former heavy smokers aged 55–74 in multiple centers over a 21-mo period (4). The study showed a relative reduction in mortality from lung cancer with low-dose CT screening of 20% relative to chest x-ray screening (5). After a systemic review, including this and several smaller studies (6), the U.S. Preventive Services Task Force now recommends screening with helical CT instead of chest x-ray radiography. The Centers for Medicare and Medicaid Services now provides coverage for this procedure annually, making this the first time that lung cancer screening has been covered.
Despite the recognized benefits of CT screening, there are important considerations. The diagnostic advantage of CT over chest x-ray is attributed to its high sensitivity for detecting small cancerous lesions, but this can potentially lead to misclassification of nonmalignant nodules and patient overdiagnosis. The National Lung Screening Trial researchers reported that CT screening yielded a false-positive rate around 96% (5). The addition of metabolic information from PET has been shown to improve accuracy for detecting lung cancer compared with CT alone (7). Hence, recent work has focused on potential screening applications of the combined modality PET/CT in high-risk groups (8). Currently, PET/CT is used clinically for staging (9,10), monitoring treatment response (11–13), and long-surveillance (14,15). The application of this hybrid modality as a screening tool, whereby subjects are scanned annually, would need low-dose alternatives to current scanning protocols (16–19). For PET/CT, the CT component is typically responsible for a larger effective radiation dose delivered to the patient, relative to its PET counterpart, but although significant work has focused on developing appropriate low-dose CT protocols, far less attention has been paid to reducing the PET tracer dose. This would require efforts to understand these effects on image quality, in the medical setting.
PET is an intrinsically noisy modality, and the quality of the reconstructed images depends greatly on the number of acquired coincident counts. Many previous works have focused on the behavior of statistical PET reconstructions in low-count conditions (18,20–25) and typically characterized image quality in terms of noise and bias. However, more work is needed to translate the implications of these findings for specific clinical tasks. A platform has been presented to evaluate the noise effects of reducing the amount of PET data on the performance in the specific task of detecting small isolated lung nodules. The analysis tools were developed for patients with infectious lung lesions, scanned with simultaneous PET/MR (26).
The present work applied these analysis methods to a cohort of patients with malignant lung nodules scanned with PET/CT. It aimed to investigate the lowest practical limits for accurate image quantification while maximizing sensitivity for detecting small, isolated lung lesions.
MATERIALS AND METHODS
Twenty patients (weight range, 37.2–91 kg) were enrolled in this Institutional Review Board–approved study after written informed consent was obtained. Inclusion criteria were patients with biopsy-proven primary lung cancer or patients with suggestive radiologic abnormalities planned for definitive lung surgery. All scans were obtained on the Biograph mCT (Siemens Healthcare Molecular Imaging) after an uptake period of 60 min, after injection of 218.3 ± 5.18 MBq of 18F-FDG. PET data were acquired in list-mode, and the true scan counts were found by subtracting the smoothed delayed counts from the total prompts (throughout this article, true counts refer to prompts minus randoms, which are actually the true and scattered events). All subjects were scanned with 2 bed positions covering the lungs at 10 min each, resulting in 120 ± 25 million mean true coincident counts per bed position.
Reduced effective doses were simulated by randomly discarding events in the PET list-mode according to 9 predefined true count levels, defined as prompts minus delayed: 0.25 × 10⁶, 0.5 × 10⁶, 1 × 10⁶, 2 × 10⁶, 5 × 10⁶, 7.5 × 10⁶, 10 × 106, 15 × 106, and 20 × 106. For each patient–true count combination, the highest possible number of independent realizations was generated and reconstructed, up to a maximum of 50. The reconstruction algorithm was ordinary Poisson ordered-subset expectation maximization (OSEM) (27,28), incorporating time-of-flight information and system resolution modeling, with 2 iterations, 21 subsets, and 3-mm smoothing, producing 400 × 400 image matrices with a voxel size of 2.04 × 2.04 × 2.03 mm. The CT images were 512 × 512 with a voxel size of 1.52 × 1.52 × 5 mm. All PET reconstructions included attenuation and scatter corrections.
This work focused on PET image quality in the context of lung lesion detection. The images reconstructed from the original full statistical set, that is, all acquired events, were used to identify isolated lung lesions of various sizes and contrasts, consistent with those expected of early-stage, subclinical lung cancer. Cubic volumes of interest (VOIs), with dimensions of 32.6 × 32.6 × 32.5 mm, centered on each selected lesion, were delineated and stored. Additionally, for each patient, 1 cubic VOI including only healthy lung tissue was also stored, generating a population of matched, lesion-absent test samples. Hence, each patient contained 1 background and at least 1 signal subvolume. The bias and stability of the lesion activity measurements were evaluated across all simulated dose levels, and detectability was determined by various human-trained, numeric observer models.
At each simulated dose, the selected lesions were classified by 6 parameters: metabolic PET lesion volume, 18F-FDG signal-to-background contrast, mean lesion activity concentration, lesion VOI SD, lesion-to-background signal-to-noise (SNR), and channelized Hotelling observer (CHO) SNR (29). Masks delineating lesion VOIs were generated in the full-count images by selecting all voxels within the cubic volume with values equal to or greater than 40% of the maximum value. The VOI segmentations are illustrated in Figure 1, which shows coronal slices containing lesion and background regions.

Coronal slices containing signal and background regions. Isolated nodule is seen in CT volume (yellow arrow). PET analyses of each lesion consists of 2 segmented signal regions and 1 background region. Lesion VOI (red) was used to calculate volume and other metrics, and target cubic subvolume (blue) was used in CHO. Background segmentation required only cubic subvolume (green) to calculate contrast and noise metrics and for input into CHO.
The metabolic PET volume is the first parameter and was defined as the number of voxels included in the lesion VOI multiplied by the individual voxel volume, in this case 8.45 mm3. The mean activity concentrations in the lesion and background VOIs were used to calculate the second parameter, lesion contrast  , given by
 where
where  and
and  are the means of the lesion and background regions of interest in the full-count images. These first 2 parameters were measured only in the full-count images, providing stable representations of size and contrast for each lesion.
The mean activity concentration in the lesion VOI was measured for all the independent realizations at each simulated dose; the mean of these realization measurements was recorded as the third parameter, lesion activity mean, and the SD in these measurements was the fourth parameter, lesion VOI SD, providing a way to assess the reproducibility of the lesion. The fifth parameter was lesion SNR and was defined as the mean lesion activity divided by the mean of the noise (i.e., the SD in the background VOI, averaged across realizations). The last parameter used to characterize the lesions was included to reflect observer detectability. A CHO was implemented to provide a surrogate estimate of performance in a lesion-detection task. For every lesion, at each dose, the target and background subvolumes extracted from the independent noise realizations were used to train the model and test the observer SNR (30,31).
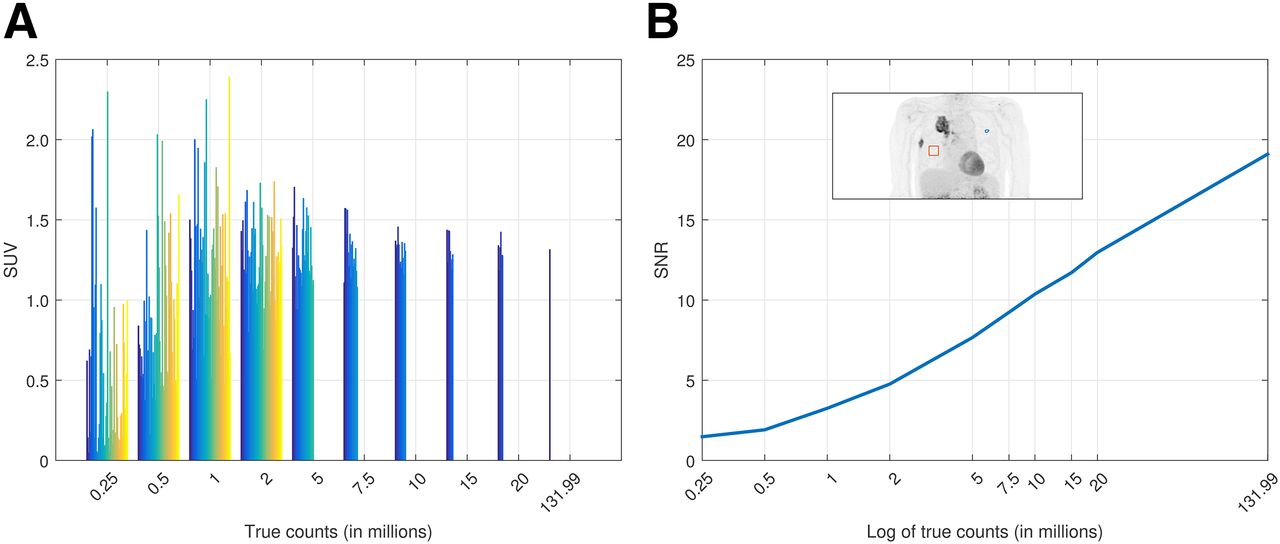
As an example, we demonstrate in Figure 2 the analyses for a sample lesion (the same lesion shown in Fig. 1).

Typical example of SUV reproducibility (A) and SNR analyses (B) for 1 lesion over all count levels. Plot A shows SUVmean as a function of true counts in scan for 50 independent noise realizations, represented by individual colored bars. Plot B shows calculated lesion SNR at each point. For higher count levels, when 50 independent realizations were not possible, actual number of realizations at each point were 26, 17, 13, 8, and 6 for 5, 7.5, 10, 15, and 20 million true counts, respectively. Last point with only 1 realization corresponds to full dataset.
Defining each lesion by the 6-dimensional point comprising its parameter values provided a simplified and convenient way to represent all lesion samples in a space spanning their morphologic, physiologic, and distinguishable characteristics.
A lesion-detection task to survey performance for distinguishing lesions from healthy lung tissue was previously administered to 2 radiologists, board certified in nuclear medicine, and 3 postdoctoral researchers experienced with PET (26). Five hundred fifty images of patients (weight range, 45–79 kg) containing hypermetabolic lung lesions were randomly presented to the observers, with 3 orthogonal slices intersecting an outlined VOI. The observers were instructed to report if there was a lesion at the center of the VOI or not. Each observer then rated the confidence of the decision on a scale from 1 to 5, with 5 meaning 100% confidence of a lesion, 1 meaning 100% confidence of no lesion, and 3 meaning an equivocal interpretation. A lesion with a score of 4 or higher was assumed to be detectable by the observer. For each count category, sensitivity was calculated as where each sample point was classified as detected or not detected, according to a human-trained linear observer model.
The human observer decision data were used to classify the retrospective lesion data into 2 classes, detectable or not detectable; these were the training data for the linear observer models. The task of the numeric observer was to determine to which class a given sample belonged. The discriminant function  was calculated by
 Here
Here  is the mean of the
  class, and K is the covariance derived from the combination of the individual class covariances according to
 where
where  is the number of samples belonging to the
  class
class  . This approach, namely, linear discriminant analysis for discrete samples, ensured that SNR for class discrimination was maximized.
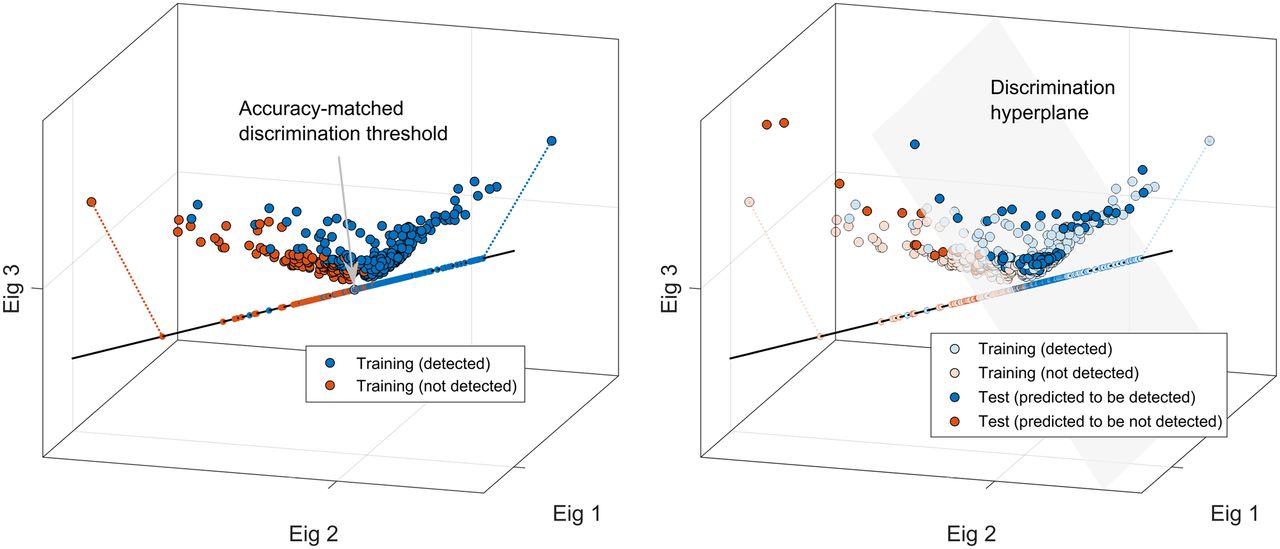
By representing the retrospective lesion data (and defining the corresponding linear discriminants) in the same vector space as the prospective lesions—that is, comprising combinations of the 6 measurement parameters—the observer models could be directly applied to the new lesion data. By choosing the binary decision threshold that resulted in overall accuracy most closely matching that of the original observer, the numeric model could thus allow trained predictions for classifying the new lesions as detectable or not detectable. The scatterplots in Figure 3 show this approach. The lesion samples are represented as points comprising their respective parameters, along with the corresponding linear discriminant function.

Training of numeric observer model by human detection responses is shown here (for illustration purposes, 6-dimensional lesion data are represented in 3-dimensional space defined by principal eigenvectors). Linear discriminant function was defined by maximizing classification SNR within projected lesion sample points. Discrimination threshold point on linear function was set so as to best match overall accuracy between model and original observer (gray arrow). This point defined orthogonal discrimination hyperplane, and trained model was then used to classify different set of lesion data.
RESULTS
In all 20 prospective patients, only isolated and relatively small lesions were chosen to simulate a typical screening situation; 12 lesions were selected as having suitable morphologic and physiologic characteristics for inclusion in the analyses. The mean lesion volume was 1.25 ± 1.21 cm3 (range, 0.18–3.80 cm3), as measured by PET, and the mean lesion activity concentration was 13.9 ± 11.4 kBq/mL (range, 3.3–37.5 kBq/mL) (SUV 6.2 ± 5.5; range, 1.31–18.63). The mean volume was 2.61 ± 2.86 cm3 (range, 0.15–7.15 cm3), as measured by CT, using the same thresholding approach used to delineate the lesions in the PET volumes. The lesion characteristics are described in Table 1.
Characteristics of 12 Lesions
For all comparative analyses reported here, the images generated from the full-count data were used to draw VOIs and taken to be the gold standard for evaluating the quantification accuracy of the reconstructions at reduced counts.
The lesion metrics (aside from volume and contrast, which were constant across count levels) are shown as a function of true count level in Figure 4. Lesion SUV was relatively stable until the count level approached 1 million, and only when the counts were decreased to 5 million did the average SD become greater than 10%. Lesion SNR and CHO SNR exhibited continuous increase with count level.

Lesion metrics averaged across realizations, as function of count level: lesion SUV (A), SD in lesion SUV (B), lesion SNR (C), and CHO SNR (D). Error bars show SD over all lesion measurements.
Noisy data led to bias in statistical reconstructions, and this effect on lesion SUV was investigated. The SUVmean and SUVmax measurements were relatively stable at all count levels, and as seen in Figure 5, it was only when the true counts approached 1 million that measurement bias was observed. As expected, in low-count conditions, SUVmax showed positive bias because increases in the variability within a VOI yield maximum voxel values further from the mean. Negative bias was observed for SUVmean under these extreme conditions because of 2 phenomena, the backprojection of the sparse data within the OSEM framework (24) and, to a greater extent, the failure of the scatter simulation, namely the scaling part (32), which greatly overestimates the scatter at extremely low counts. Both of these phenomena are shown in Figure 6 for the same patient dataset used in Figure 2.

SUV measurements at various count levels, relative to true SUVs as measured in full-count images: from left to right, 20 × 106, 10 × 106, 5 × 10⁶, 1 × 10⁶, and 0.25 × 10⁶ net true counts. Lesion SUV was relatively stable until count level approached 1 million, in which case SUVmax (A) demonstrated positive bias and SUVmean (B) demonstrated slightly negative bias. Unity line is shown in each plot.

Two phenomena cause instability in PET reconstruction at true count levels around 1 million. First, scatter fraction estimates based on simulation models are overestimated in noisy conditions (A), which causes negative image bias from oversubtraction. Second, ordered-subset framework can cause negative bias in limited statistics. This bias is reduced when using pure maximum likelihood expectation maximization (MLEM), that is, using all projections for each update (B); OSEM reconstruction used 2 iterations and 21 subsets and MLEM used 40 iterations. Error bars denote SD across measurements made in 10 independent realizations at each true count level, except for 15 and 20 million, which used 8 and 6, respectively.
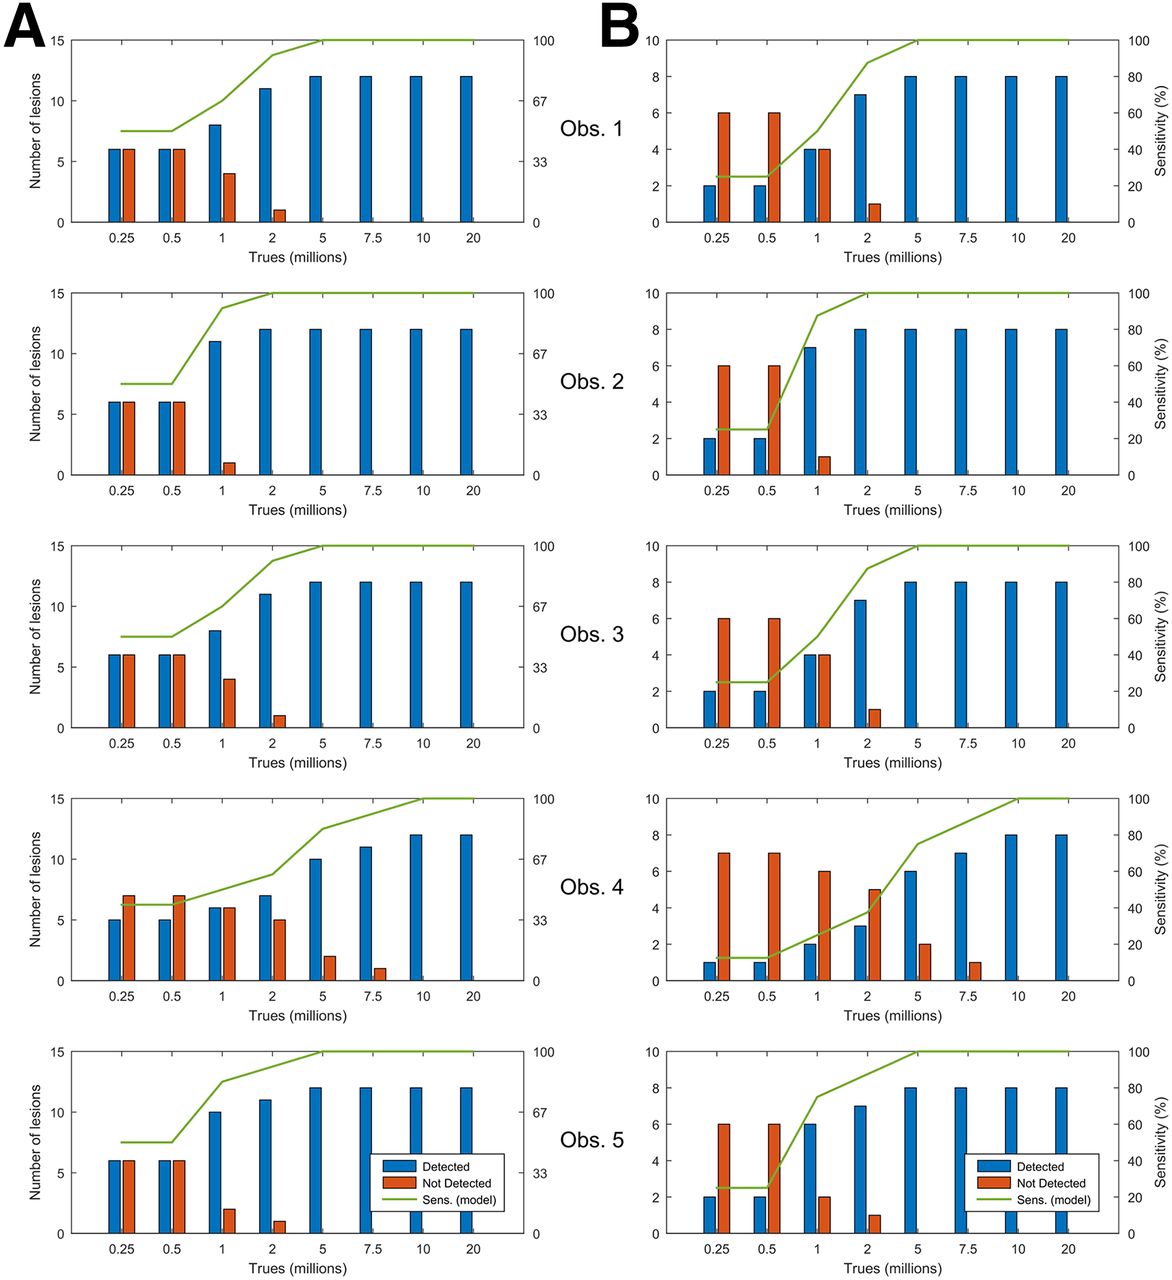
Validations of the best numeric models to accurately predict the respective human observers’ decisions were first performed using the retrospective data from the detection task. Once the linear discriminant was defined (and corresponding accuracy-matched decision threshold calculated) in each case, the model was used to classify the lesion data as detectable or not detectable. Once the predictive utility of the linear discriminators was established, the observer models were applied to the new lesions from the prospective lung cancer patients. The models predicted different performance for each observer, but for all 5 human observers, as seen in Figure 7, performance was optimized near 10 million true counts.

Predicted detection sensitivity of prospective data in all 12 lesions (A) and in just 8 lesions smaller than 1 cm3 on PET (B). Predicted performance varied across 5 human observers, but was maximized for all observers around 10 million counts.
DISCUSSION
This work was primarily motivated by the need for improvements to current lung cancer screening protocols. The poor specificity of CT lung screening, with a false-positive rate around 96%, leads to potential overdiagnoses and, in some cases, unnecessary invasive procedures that are not without risk. The addition of complementary or confirmatory information needs to be incorporated into the screening process so that the referring physician can make an informed decision. Hybrid PET/CT has consistently proved superior to CT alone because PET can provide information that improves the poor specificity of current screening methods. This has the potential to considerably improve the clinical management of high-risk patients by increasing overall diagnostic accuracy. If PET is to become a routine screening tool for patients at risk, however, the dose should be kept as low as practically possible. Investigative efforts must focus on defining the lowest reliable limits of PET. Here, we present a task-based evaluation, specific to detection of small focal lesions in lung cancer patients. This work combines objective and subjective analyses to provide a comprehensive understanding of the behavior of clinical PET and lesion detectability in noisy conditions.
All experimental findings presented here are based on reduced PET tracer doses, emulated by randomly discarding count events from larger sets of PET list-mode data. This approach is predicated on the assumption that the ratio between the prompt and delayed events is constant throughout a given dataset, regardless of the randomly emulated counting rates. However, although the prompts and singles rates scale linearly with the in-field activity, the randoms rates scale by the square of the singles. Hence, in this work, we essentially create a worst-case situation, in which we emulate low-count levels but with the higher randoms rates of the original data, which was 38.8% (range, 34.8%–44.4%) in this study. With actual lower injected activities, the randoms fraction and deadtime would be lower, and so image quality would be improved.
Generating smaller datasets from a larger one has the advantage that several random realizations of the same activity distribution can be realized, permitting the characterization of the noise associated with the reconstruction process. For this work, only independent realizations were created to eliminate possible correlations between test images. Of course, for any set of data, one is limited to the number of fully independent subsets that can be realized. For the current work, we felt that there was an appropriate balance between count level and maximum realization number. High-count levels yielded fewer realizations but the reconstructions were supported by high statistics and low variability, and lower count groups produced greater numbers of realizations to compensate instability of the increasing noise levels. This was not an issue for the lowest count levels (≤2 million), as 50 independent realizations could be extracted.
Analyses of bias and reproducibility in the lesion activity values showed that the measurements were stable until the count levels approached extreme conditions; in fact, bias in the lesion VOI mean and SUVmax appeared relatively negligible until the true count level was decreased to 1 million. Variance on the reproducibility of lesion values showed a more dramatic trend, but the SD was still around 10% at 5 million counts. It could easily be argued that this level is acceptable because PET is generally associated with a test–retest error on this order (33,34).
As seen in Figure 6, instability in the reconstruction at extremely low counts is caused by 2 phenomena, estimation of the scatter fraction and handling of the sparse projection data within the OSEM framework. At extremely low counts, the scatter simulation, and in particular the associated tail-fitted scaling, fails because of noisy data in the sinogram tails. This results in an overestimation of the scatter: we verified that below 1 million true counts, the scatter fraction increases to unrealistic high values, and it is the main reason for the strong negative bias in SUV at the lower limits of our statistical range. In addition, ordering the subsets in iterative PET reconstruction, which is designed to accelerate reconstruction convergence using a limited number of projections for each image update, increases the probability of back-projecting zeros into the image at low statistics. This, along with the multiplicative nature of the updates in the expectation maximization framework, can essentially trap image voxels at zero, resulting in negative bias. This problem is somewhat reduced using pure maximum likelihood expectation maximization, that is, using all projections for each update, but this would not be clinically practical.
Although, the objective analyses of lesion metrics suggested that image quality may be acceptable at low-count levels, the results of the subjective observer study were more conservative and likely better represent the actual limits to which clinical protocols should adhere. Translational research, applying technical analyses in the context of the medical setting, is often challenging and requires the involvement of a multidisciplinary team. In this case, the input of experienced physicians was essential to the development of the numeric observer model used to predict lesion detectability. The performance of this model was rigorously evaluated within the lesion population, using various combinations of the lesion parameters, to find the characteristics that best allowed it to accurately predict the human observers’ decisions. From these experiments, we found that observer detection was indeed well correlated with lesion SNR, because this metric yielded the smallest residual differences between the human and model observers in the sensitivity curves. Models using only the volume, contrast, and measurement variance of the lesions yielded relatively poorer agreement. The human-trained numeric models showed good predictive utility and may also provide a convenient surrogate for realistic interpretation in future lesion-detection studies.
Many works investigating lesion-detection performance use the SNR of a numeric observer, for example, the CHO, as the figure of merit because it has been shown to be a good predictor of human performance in certain tasks. However, in this work, we chose a discrimination model using a more comprehensive set of lesion parameters, intended to characterize each lesion objectively and subjectively. Channelized observer models use spatial frequencies to reduce dimensionality while extracting the important features of each class, but here we reduce the dimensionality, while retaining important discriminatory characteristics, through 6 lesion parameters. Hence, instead of depicting each lesion by only spatial frequency responses, we thought that the combination of many different properties (including CHO SNR) would better characterize the lesion population and improve discrimination. Although we found the model using lesion SNR to provide the discrimination performance most closely matching that of the original observers, the use of CHO SNR alone provided a close second best. This might not be unexpected because both metrics use similar lesion properties, that is, lesion mean, contrast, and noise (though the CHO uses channelized versions of these).
The findings of the observer studies pointed to a practical lower limit around 10 million true counts, which is certainly supported by the results of the bias and reproducibility analyses. It was at this level that the sensitivity for detecting lesions matched that in the full-count images. Of course the detection limits are set by the smallest lesions, which is clear from Figure 7 where the sensitivity is poor for the small lesions in the low-count levels but is optimized at the same point, in both populations. It is not the intent of this work to propose changes to current clinical protocols, only to investigate the limits of clinical utility, in a highly constrained lesion-detection task, under low-count conditions. In this regard, for this system, acquisition, reconstruction, patient population (62.4 ± 13.7 kg), and in this specific task, the 10 million true count level was the lowest limit for accurate image quantification and reliable detection performance; this would be equivalent to a patient injected with 18.5 MBq and scanned with 2 bed positions for 10 min each. With this dose and scan time, the effective patient dose from PET would be less than 0.4 mSv.
Ultra-low-dose CT protocols combined with iterative reconstruction techniques, which can further reduce the patient radiation dose by 80% (35,36), have produced promising results for the detection of pulmonary nodules (37,38). Hence, this could potentially allow a complete PET/CT lung screening scan to be obtained at a total dose under 1 mSv, which is roughly equivalent to 30% of 1 y of average natural background. Notwithstanding this, it is likely that the best dose for routine PET screening would be higher than the lower limits presented here, because the potential health risks associated with these levels of radiation are negligible compared with the factors that already designated the population as high risk for lung cancer (e.g., smoking). In other words, the benefit of improved accuracy from PET would far outweigh the small risk associated with the radiation.
CONCLUSION
Image quality was investigated in the context of lesion detectability using objective image metrics and subjective observer models. The analyses in this study suggested that accurate image quantification may be preserved at levels around 2–5 million trues, but detection sensitivity, which is more important for a screening task, was acceptable at trues levels around 10 million. This would mean an effective PET patient dose of less than 0.4 mSv with the acquisition parameters used in this work. Detection sensitivity of the observers was found to be well correlated with lesion SNR.
DISCLOSURE
This study was funded by the National University Cancer Institute, Singapore Centre Grant Seed Funding Program. Ross A. Soo was supported by the National Research Foundation, Singapore, and the Singapore Ministry of Education under its Research Centers of Excellence initiative. No other potential conflict of interest relevant to this article was reported.
Footnotes
Published online Sep. 29, 2016.
- © 2017 by the Society of Nuclear Medicine and Molecular Imaging.
REFERENCES
- Received for publication May 2, 2016.
- Accepted for publication August 22, 2016.


