


Abstract
Intratumoral uptake heterogeneity in 18F-FDG PET has been associated with patient treatment outcomes in several cancer types. Textural feature analysis is a promising method for its quantification. An open issue associated with textural features for the quantification of intratumoral heterogeneity concerns its added contribution and dependence on the metabolically active tumor volume (MATV), which has already been shown to be a significant predictive and prognostic parameter. Our objective was to address this question using a larger cohort of patients covering different cancer types. Methods: A single database of 555 pretreatment 18F-FDG PET images (breast, cervix, esophageal, head and neck, and lung cancer tumors) was assembled. Four robust and reproducible textural feature–derived parameters were considered. The issues associated with the calculation of textural features using co-occurrence matrices (such as the quantization and spatial directionality relationships) were also investigated. The relationship between these features and MATV, as well as among the features themselves, was investigated using Spearman rank coefficients for different volume ranges. The complementary prognostic value of MATV and textural features was assessed through multivariate Cox analysis in the esophageal and non–small cell lung cancer (NSCLC) cohorts. Results: A large range of MATVs was included in the population considered (3–415 cm3; mean, 35; median, 19; SD, 50). The correlation between MATV and textural features varied greatly depending on the MATVs, with reduced correlation for increasing volumes. These findings were reproducible across the different cancer types. The quantization and calculation methods both had an impact on the correlation. Volume and heterogeneity were independent prognostic factors (P = 0.0053 and 0.0093, respectively) along with stage (P = 0.002) in non–small cell lung cancer, but in the esophageal tumors, volume and heterogeneity had less complementary value because of smaller overall volumes. Conclusion: Our results suggest that heterogeneity quantification and volume may provide valuable complementary information for volumes above 10 cm3, although the complementary information increases substantially with larger volumes.
For diagnosis and staging in oncology, 18F-FDG PET/CT is a powerful tool (1). Its use in therapy assessment (2,3) is increasing. Within this context, more emphasis is being given to image-derived indices (4). On the one hand, features extracted from PET images, including metabolically active tumor volume (MATV), mean standardized uptake value (SUV), and total lesion glycolysis, have provided potentially higher prognostic value than standard maximum SUV in various cancer types (5). On the other hand, more recently the heterogeneity of 18F-FDG uptake within tumors has been associated with treatment failure (4,6–8). Proposed approaches to assessing the heterogeneity of intratumoral activity distribution include visual evaluation (9), SUV coefficient of variation (10), area under the curve of the cumulative histogram (11), and fractal (12) or textural feature analysis (10,13). The last of these can provide several parameters quantifying tumor heterogeneity on a scale of voxels or groups of voxels. A recent study, based on the use of one of these parameters (local entropy calculated from co-occurrence matrices) has suggested that a minimum MATV of 45 cm3 is required to estimate heterogeneity independently of MATV-confounding effects (14). However, that study investigated a single heterogeneity parameter, in a single cancer type, and used an image quantization scheme with more than 150 gray levels. Another recent study investigating the relationship between MATV and textural features (15) had a relatively small number of tumors (including patients who already had distant metastases) and cancer types and did not explicitly report on the lesion sizes considered or make conclusions about the minimum tumor volume that should be considered. In addition, that study used Pearson correlation to test the linear relationship between MATV and textural features, which would miss nonlinear trends that may exist between these parameters.
To our knowledge, the potential interaction between MATV and textural features has not been previously considered within the context of patient outcome prognosis.
This study was therefore designed to investigate in detail, and across a large number of primary tumors and cancer types, the relationship between tumor MATV and derived heterogeneity measurements using textural features, in order to determine whether a minimum MATV should be considered in such analyses and whether tumor heterogeneity quantified through textural features can provide complementary prognostic value relative to MATV.
MATERIALS AND METHODS
18F-FDG PET Images
Several patient cohorts were retrospectively collected into a dataset of 555 baseline 18F-FDG PET images of different primary locally advanced tumors, excluding patients with distant metastases because they usually have a very different prognosis and treatment management. In all cohorts, patients were selected as consecutive patients with an 18F-FDG PET/CT scan at diagnosis before any treatment.
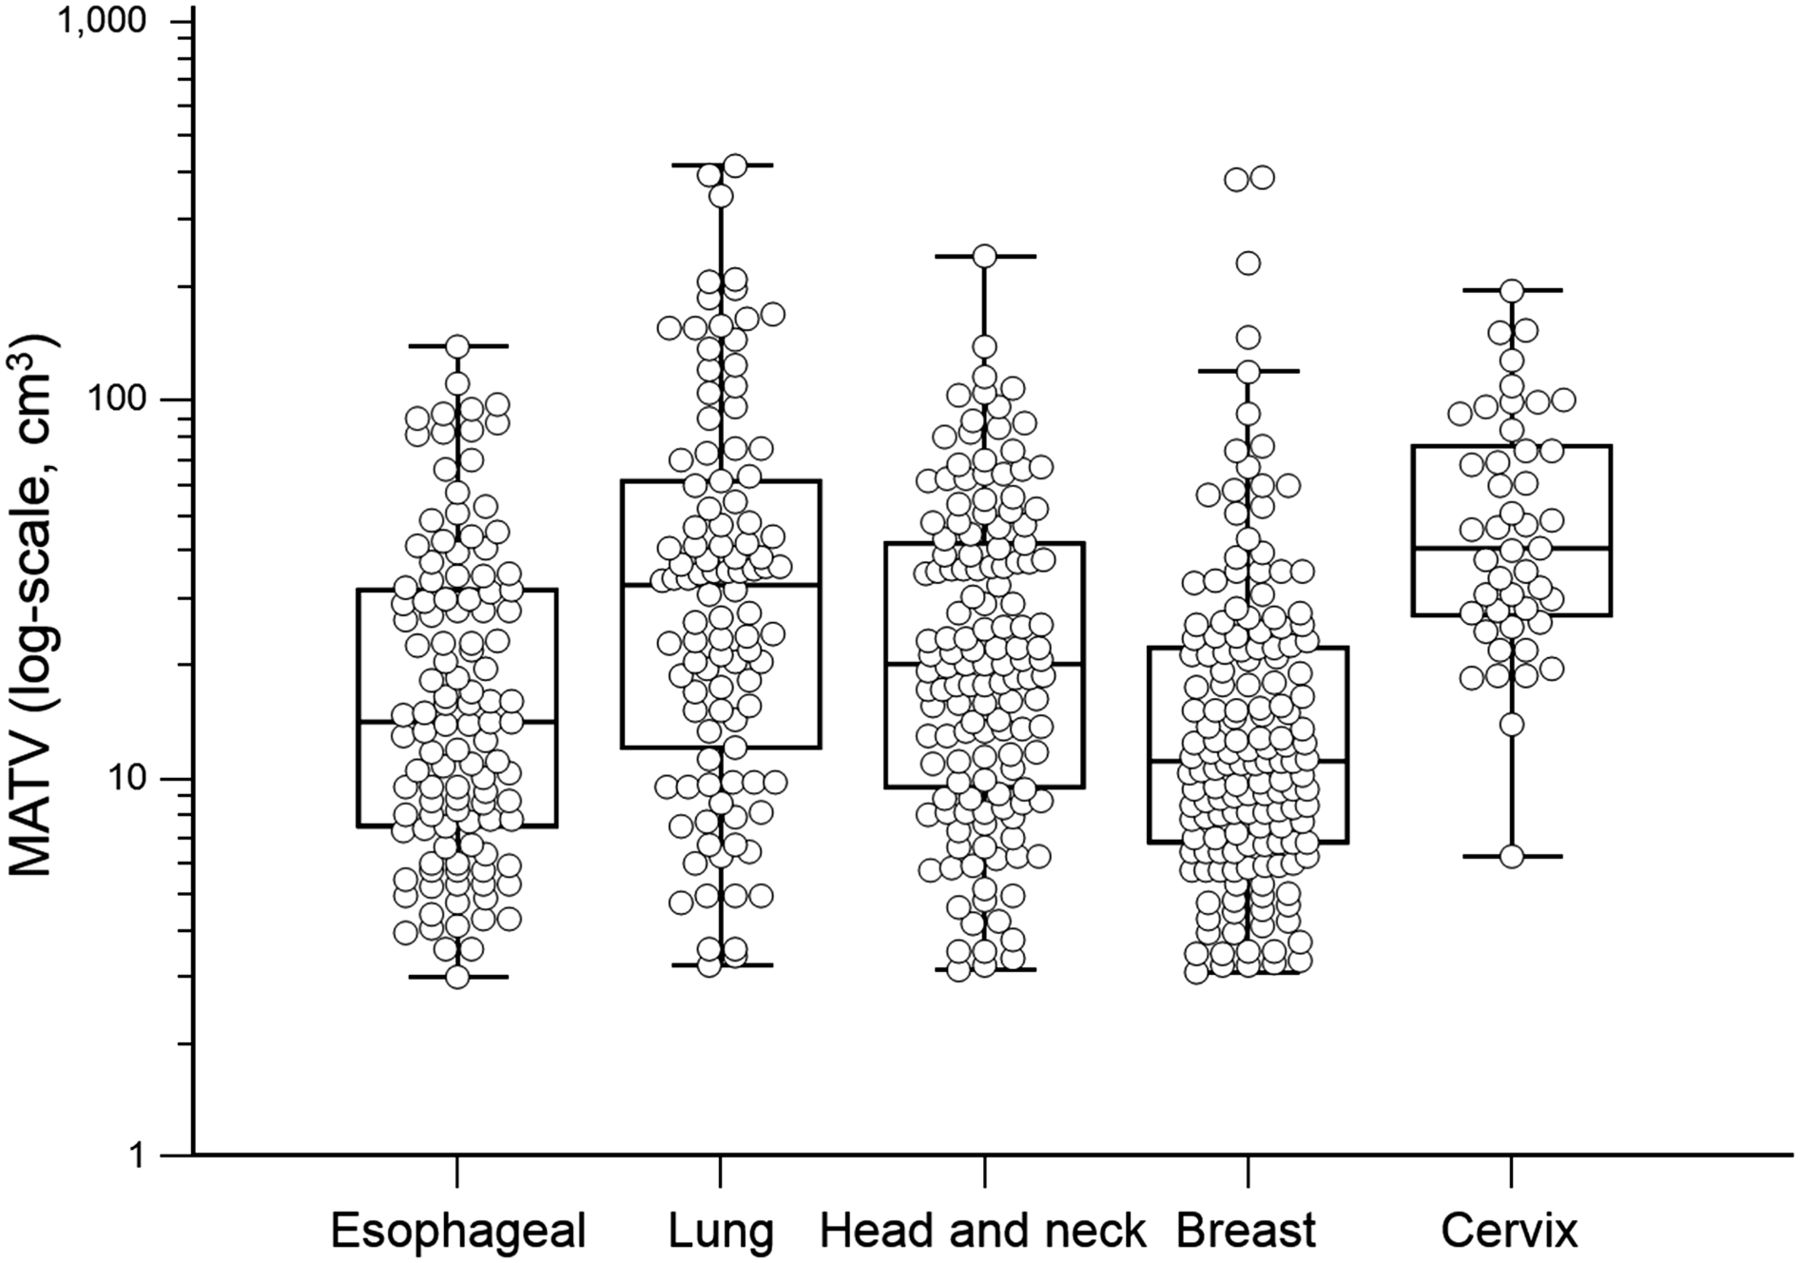
The resulting dataset consisted of 158 breast tumors of 3 different subtypes (luminal, HER2-positive/ER-negative, and triple-negative), 45 cervix tumors, 112 esophageal tumors, 139 head and neck tumors, and 101 non–small cell lung cancer (NSCLC) tumors (Fig. 1). These tumor entities were chosen because they have often been considered in the literature for studying 18F-FDG uptake heterogeneity. They have a wide range of tumor size, significant 18F-FDG uptake, and a high rate of treatment failure. Each cohort for a given cancer site came from one clinical center, except head and neck tumors, which involved 2 different university hospitals (Supplemental Table 1, available at http://jnm.snmjournals.org). Within each cohort, all acquisitions followed the corresponding institutional protocols. All cohorts except the 66 head and neck tumors from McGill were acquired using the same acquisition settings and protocols: a GEMINI PET/CT scanner (Philips), CT-based attenuation correction, reconstruction with a 3-dimensional row-action maximum-likelihood algorithm with 4 × 4 × 4 mm voxels and 5-mm full-width-at-half-maximum gaussian postfiltering, a 6-h fasting period, a 3-dimensional whole-body acquisition performed 60 min after injection of 18F-FDG, and SUV normalized using body weight. The acquisitions for the 66 head and neck tumors from McGill shared the same settings expect for the scanner model (a Discovery ST; GE Healthcare) and reconstruction using ordered-subset expectation maximization (3.52 × 3.52 × 3.27 mm voxels) without postfiltering.

MATV distribution in each cancer site.
Only primary tumors (not lymph nodes) with MATVs of more than 3 cm3 (which, assuming a spheric shape, corresponds to an ∼1.8-cm diameter) were included, because of the limited spatial resolution and resulting partial-volume effects when PET imaging is used to characterize tracer distribution within smaller tumors.
The institutional review boards of each involved group in this work approved this retrospective study, and the requirement to obtain informed consent was waived.
Image Analysis
MATVs were first delineated using the fuzzy locally adaptive Bayesian algorithm (16), which has been previously validated for accuracy and robustness using simulated and clinical datasets, including homogeneous and heterogeneous MATVs (17,18). This algorithm was used with 2 or 3 classes to adequately cover the entire MATV, including low-uptake areas. The head and neck tumors from McGill were manually delineated by an experienced radiation oncologist on fused PET/CT images as part of radiotherapy planning.
The differences in scanner, reconstruction, and delineation between the head and neck McGill dataset and the other cohorts were taken into account by considering only features that were shown to be the most robust with respect to partial-volume effects and segmentation (19) or reconstruction settings (20), as well as test–retest reproducibility (21).
Consequently, the present analysis included 4 textural features that have been previously shown to have a predictive and prognostic value in different cancer types. The 2 local textural features calculated using co-occurrence matrices (13) were entropy and dissimilarity. Dissimilarity and entropy were calculated according to 2 different methods: the first used 13 matrices, one for each spatial direction, followed by averaging the values calculated separately in each matrix; the second used only one matrix taking into account all 13 directions simultaneously without an averaging step. From a conceptual point of view, the second method is more accurate, as it fully describes the 3-dimensional co-occurrence properties within the volume. The first method results in taking an average from fewer co-occurrence measurements; thus, information may be lost and the complexity of the distribution of gray levels may not be optimally captured. On the other hand, averaging may artificially reduce the effect of the residual noise from the quantization process. The parameters related to the first method (averaging 13 matrices) will be denoted as E13 and D13, where E is entropy and D is dissimilarity, whereas the parameters from the second method (1 matrix) will be denoted as E1 and D1.
Regional textural features calculated using size–zone matrices (13) were high-intensity large-area emphasis (HILAE) and zone percentage. Other textural features were not included in the present analysis because of high correlation with dissimilarity or entropy (correlation > 0.8) or previously shown poor reproducibility or robustness (19–21) (Supplemental Table 2).
Although an optimal quantization of 64 gray levels was identified in our previous work concerning reproducibility (19), we also investigated the impact of the quantization preprocessing step by considering values from 4 to 256.
Finally, maximum SUV, mean SUV, and SUV coefficient of variation were included for comparison purposes.
Statistical Analysis
Statistical analyses were performed using MedCalc software. Spearman rank correlation (rs) was used to study relationships between parameters, since such relationships are nonlinear and these parameters frequently are not normally distributed. To assess the potential complementarity or additional clinical value of MATV and derived heterogeneity parameters, a survival analysis was performed in the esophageal and NSCLC cohorts for which overall survival (OS), follow-up, and other clinical data were available (Supplemental Tables 3 and 4), which was not the case for the other cohorts. Association with OS was assessed using univariate Cox proportional hazards regression including features as continuous variables (i.e., no dichotomization). Correction for multiple testing was performed using the false discovery rate Benjamini–Hochberg step-up procedure. It consists in declaring positive discoveries at level α (here, α = 0.05), among the k = 1…K tested variables ordered according to their P values in increasing order, those ranked above the one satisfying the condition P(k) ≤  × α (22). After univariate analysis, a stepwise multivariate Cox analysis (significant variables are entered sequentially and then removed if they become nonsignificant) was performed to identify independent prognostic factors. Kaplan–Meier survival curves (with optimal cutoff values determined through receiver operating characteristic curve analysis) were subsequently used to assess the prognostic value of previously identified independent factors. Median survival, percentage of deaths in each group, and hazard ratios (HRs) were reported for each risk factor separately and for their combination, to quantify any improved patient stratification.
RESULTS
Correlation Between Parameters
A large range of MATVs was found in the 555 images, from 3 to 415 cm3 (mean, 35; median, 19; SD, 50) (Fig. 1). To avoid confusion, absolute rs values are reported, and correlation direction results can be found in Figure 2. Three important observations can be emphasized.
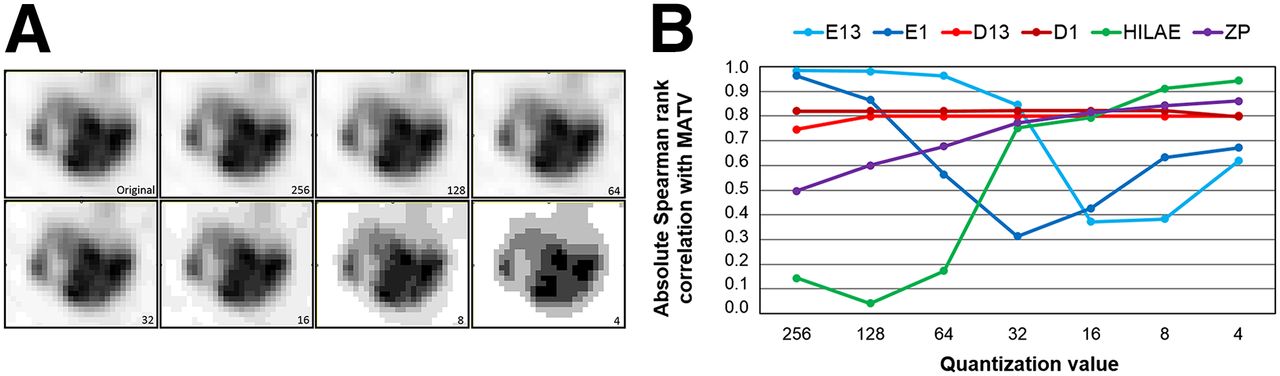
Illustration of quantization (A) and impact on correlation between textural features and MATV (B).
First, significant details on the gray-level distribution are lost when using a quantization of less than 32 (Fig. 3), and the quantization had an important impact on the correlation between volume and E1, decreasing from almost 1 for a quantization of 256 to less than 0.6 for a quantization of less than 64. Correlation with MATV was much lower for E1 than for E13, except for a quantization of less than 16. In contrast, dissimilarity (either D1 or D13) was insensitive to the quantization value (rs ∼ 0.8) and there was no difference between D1 and D13. The correlation of HILAE and zone percentage with MATV was sensitive to the quantization although, contrary to entropy, rs increased from less than 0.5 to more than 0.8 with decreasing quantization (Fig. 3). For a quantization of 32, the correlation with volume was more than 0.75 and less than 0.85 for all textural features except E1 (0.3), whereas with a quantization of 64 there was a wider range (rs < 0.2 for HILAE to rs ∼ 1 for E13), and several textural features had a correlation of less than 0.7, suggesting a higher potential of complementary information with respect to MATV for 64 than for 32. A quantization of 64 was also previously shown to provide the highest textural feature reproducibility (21) and robustness (19). A quantization into 64 gray levels was thus considered for the rest of the analysis, as it represents the best compromise between sufficient sampling of voxel SUVs, preservation of original intensity information, and potential complementary information with respect to MATV.

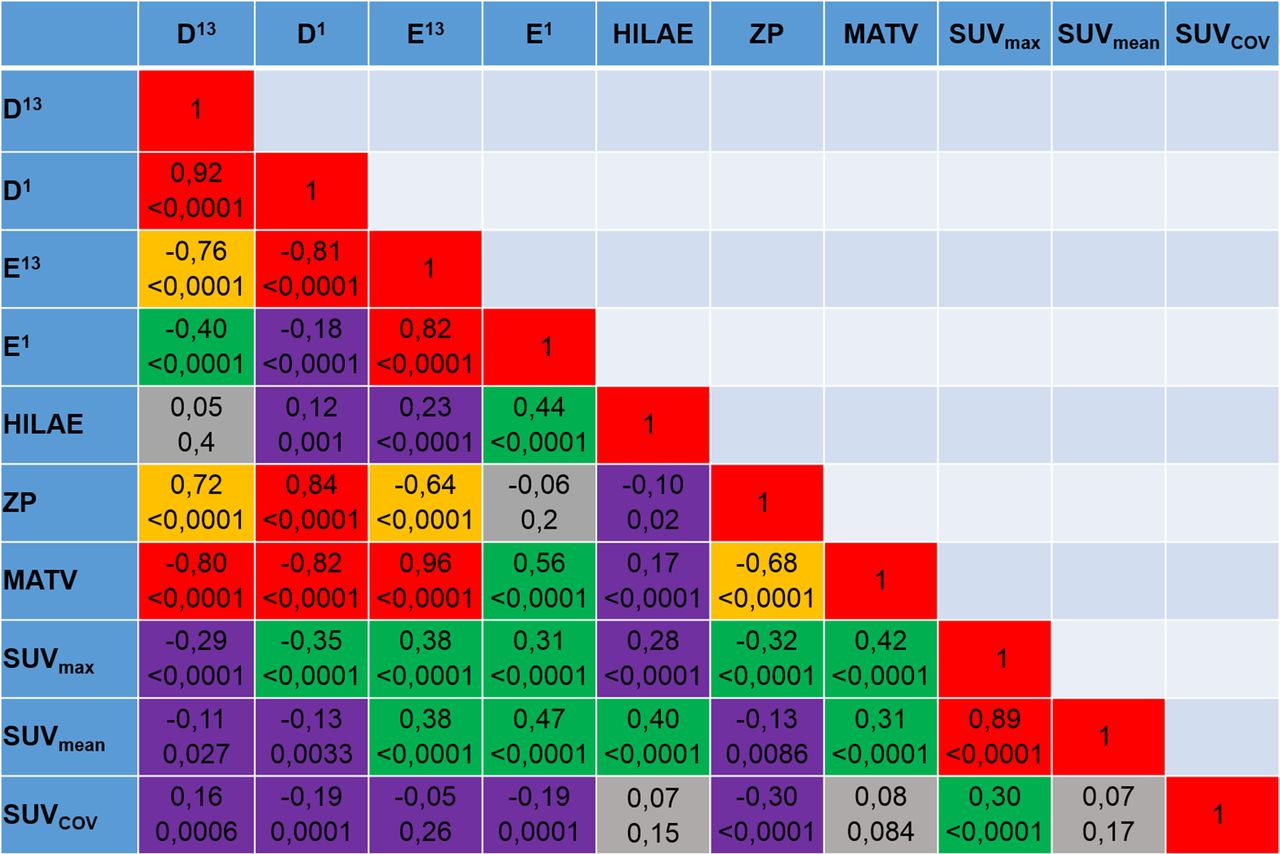
Spearman rank correlations between parameters (555 tumors). Red = [0.8,1.0]; orange = [0.6,0.8]; green = [0.3,0.6]; violet = [0.1,0.3]; gray = [0.0,0.1].
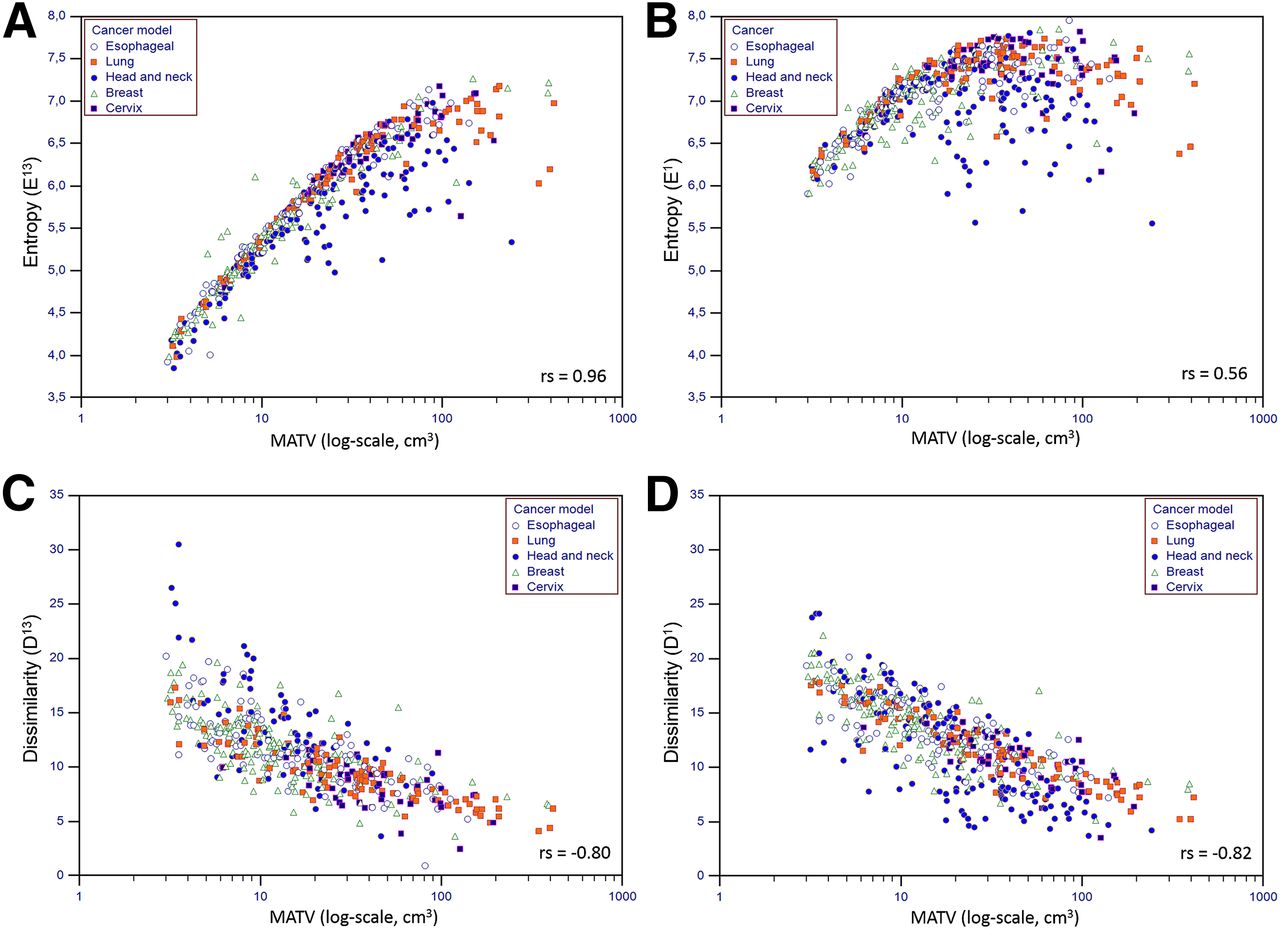
Second, significant correlations were found among almost all features considered. In addition, MATV correlated with those features, as well as with maximum SUV and mean SUV (Fig. 2). The correlation between the co-occurrence matrix–derived features themselves and their respective correlation with MATV were sensitive to the use of a single matrix compared with averaging 13 directional matrices. This was particularly true for entropy. The correlation between D13 and E13 was 0.76, whereas the correlation between D1 and E1 was 0.18. Correlation of D13 and E13 with MATV was 0.80 and 0.96, respectively, whereas it was 0.82 and 0.56 for D1 and E1, respectively (Fig. 2).
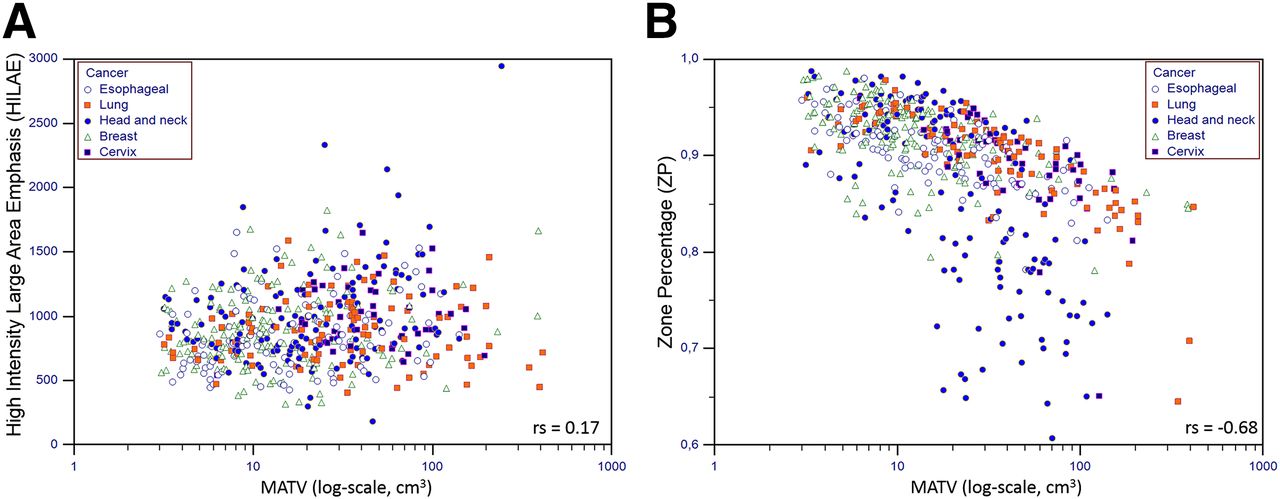
Third, correlation between D1, E1, zone percentage, and HILAE with MATV ranged from 0.17 to 0.96, suggesting that a substantial amount of complementary information with respect to MATV may be found in some of these heterogeneity quantification features, similarly to SUV measurements, which exhibited correlations of 0.31 to 0.42.
Figures 4 and 5 provide visual representations of the distributions of textural features with respect to MATV. Supplemental Figures 1–4 provide similar graphs for each cancer type, for other textural features and quantization values. The difference between E13 and E1 was important (Figs. 4A–4B), with the calculation using only one matrix leading to a much tighter distribution with a smaller range (5.6–8 for E1 vs. 3.9–7.3 for E13) of higher values (7.1 ± 0.4 vs. 5.7 ± 0.8) and with a substantially lower correlation with volume (0.56 vs. 0.96). The difference between D13 and D1 (Figs. 4C–4D) was less important but nonetheless also led to a tighter distribution for D1 with a smaller range (3.5–24.1 vs. 0.9–30.5) of higher values (12.6 ± 3.8 vs. 10.7 ± 3.7) but with a similar correlation with MATV (0.82 vs. 0.80).

Distributions of E13 (A), E1 (B), D13 (C), and D1 (D) (quantization = 64) with respect to MATV.

Distributions of HILAE (A) and zone percentage (B) (quantization = 64) with respect to MATV.
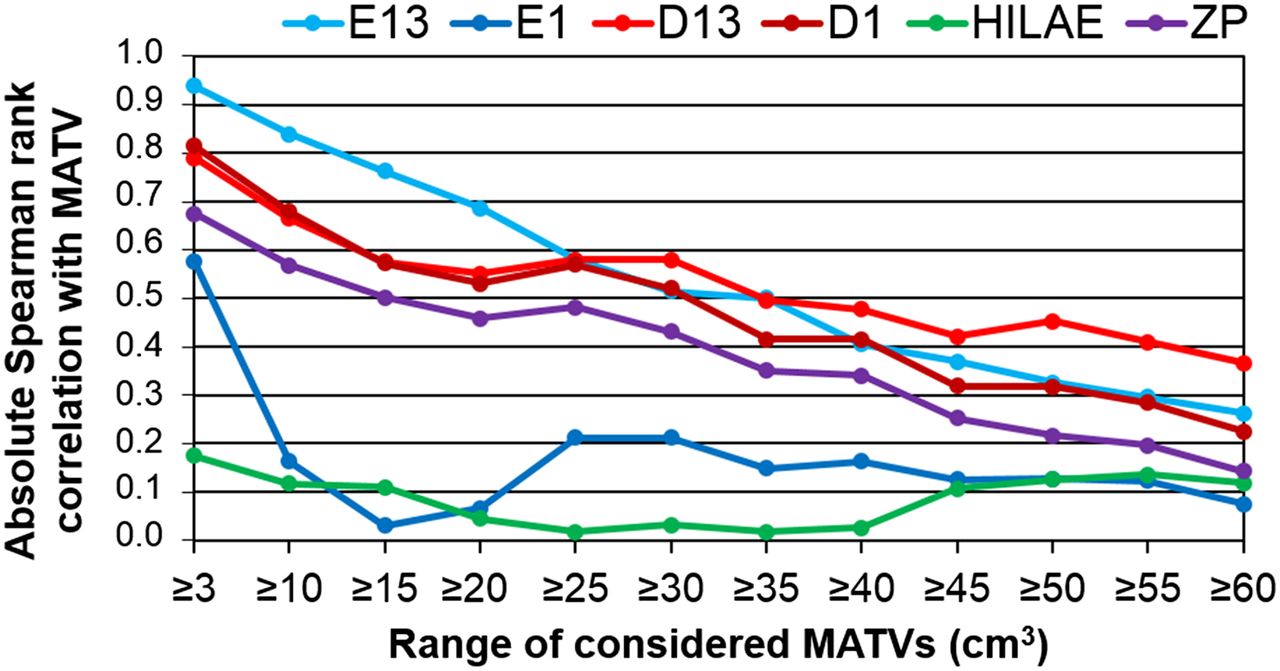
By restricting the analysis to larger tumor volumes (from ≥10 cm3 to ≥60 cm3 using 5-cm3 steps), we found that the correlation between textural features and MATV tended to decrease substantially with ranges of increasing volumes (Fig. 6). This was observed for all textural features but was especially true for entropy. The only exception to this observation was HILAE, since its correlation with MATV was low even when the entire dataset was considered. The correlation of E13 with MATV dropped from 0.96 when the entire range of volumes was considered to less than 0.3 when only tumors larger than 60 cm3 were considered. E1 dropped to less than 0.25 for volumes greater than 10 cm3. Similar observations were made for D13, with rs being greater than 0.8 when all tumors were considered and dropping to less than 0.6 in tumors larger than 15 cm3. Although the overall correlation with MATV was slightly higher for D1 than for D13, it was also more rapidly reduced with increasing MATV (Fig. 6). The same analysis for zone percentage led to similar observations, with a reduced correlation with increasing MATV when larger tumors were considered, from 0.68 for all tumors to 0.5 for those larger than 15 cm3.

Absolute Spearman rank correlation with MATV for each textural feature (quantization = 64), considering different ranges of increasing MATVs. ZP = zone percentage.
The relationships between MATV and textural features were similar across the different tumor types, although measured correlations varied: cervix tumors included mostly large tumors (MATV > 20 cm3), whereas the other tumor types included a larger number of tumors with an MATV of less than 10 cm3 (Fig. 1). The resulting correlation between E1 and MATV was not significant for cervix cancer tumors (rs < 0.003, P > 0.9), whereas it was for esophageal, NSCLC, head and neck, and breast tumors (rs = 0.80, 0.39, 0.35, and 0.74, respectively). For dissimilarity (D1) and zone percentage, smaller differences were observed, with an rs from 0.73 and 0.63 (cervix) to 0.93 and 0.83 (NSCLC) for D1 and zone percentage, respectively. HILAE correlations with MATV were less than 0.2 for all tumor types.
Survival Prognosis in Esophageal and NSCLC Cohorts
In the esophageal cohort, median OS was 17.0 mo (range, 1.0–71.0; mean, 22.0), with 44 patients still alive at the last follow-up. The trend for MATV did not reach statistical significance (P = 0.0315), and none of the variables were prognostic factors except D1 (P = 0.0016) (Table 1); therefore, no multivariate analysis was performed. However, when dichotomized with optimal cutoff values in the Kaplan–Meier analysis, both D1 (HR, 1.92; P = 0.0052) and MATV (HR, 1.66; P = 0.0375) could differentiate survival curves (Fig. 7A). Adding volume and heterogeneity increased HR to 2.02 (P = 0.0024; 95% CI, 1.22–3.34) with 23 mo (n = 64) versus 10 mo (n = 48) median OS (Supplemental Table 5, Fig. 7A).
Prognostic Value for OS in NSCLC and Esophageal Cohorts Assessed Using Cox Regression for Univariate and Multivariate Analysis
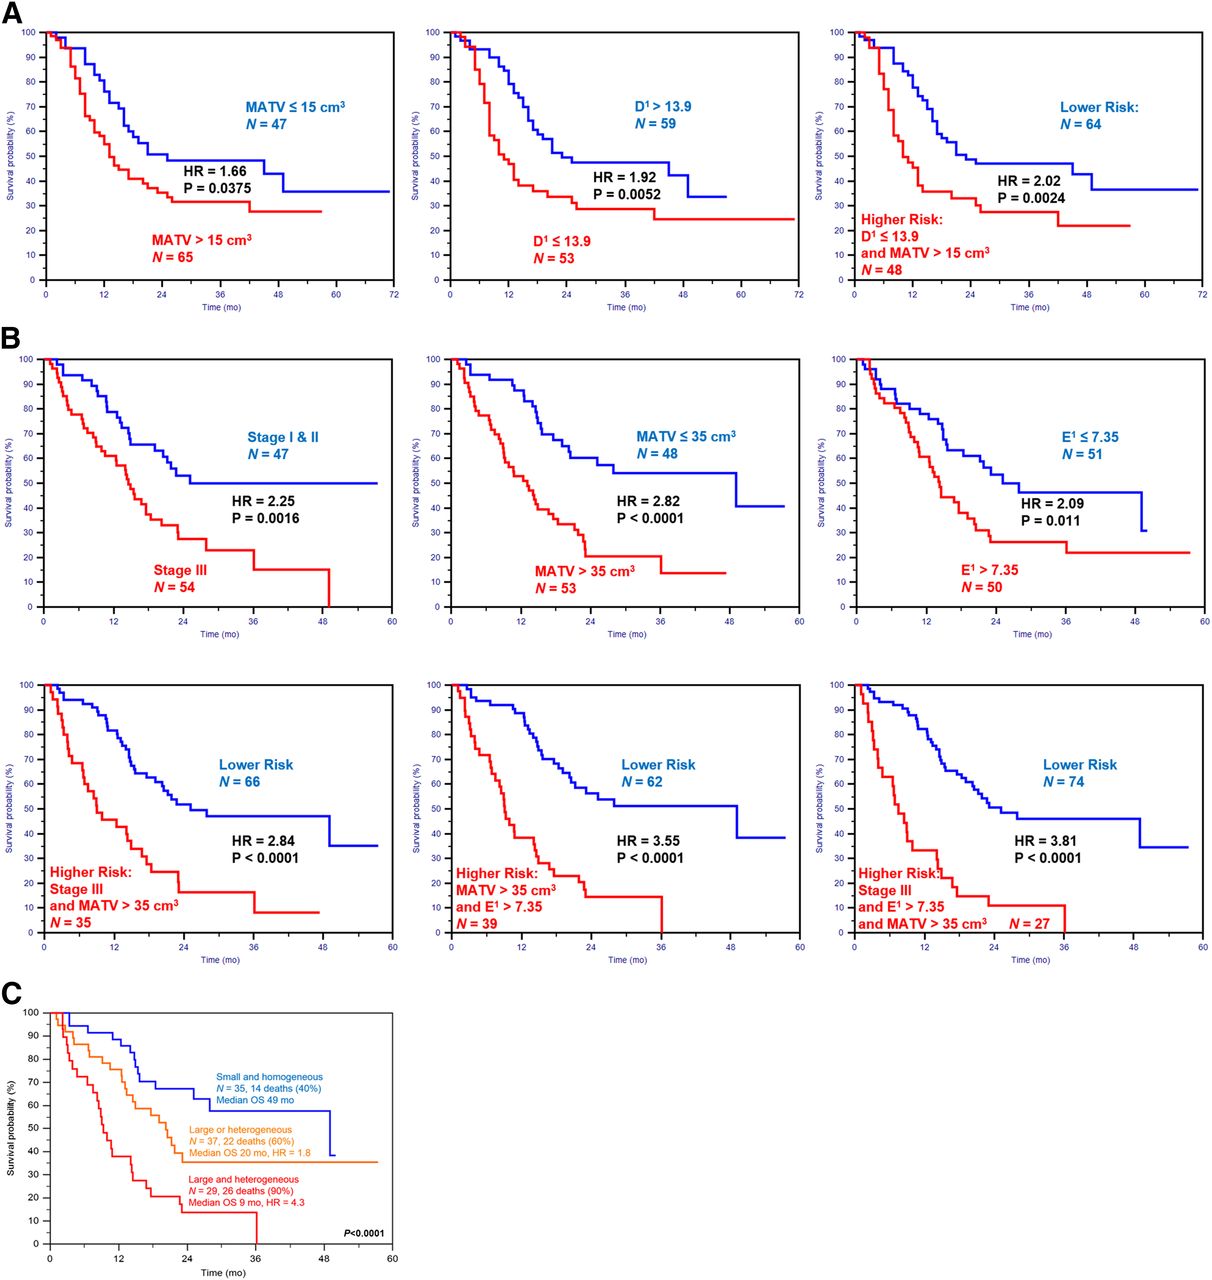
Kaplan–Meier curves using volume and heterogeneity for 112 esophageal patients (A) and 101 NSCLC patients (B and C).
In the NSLC cohort, median OS was 18.4 mo (range, 1.1–57.4; mean, 27.4), with 39 patients still alive at the last follow-up. In the univariate analysis, all variables were significantly associated with OS except age, histology, smoking history, and maximum SUV (Table 1). The multivariate analysis retained clinical stage (P = 0.0018), MATV (P = 0.0053), and heterogeneity (E1, P = 0.0093) as independent prognostic factors. MATV allowed for the highest differentiation (HR, 2.8), whereas stage and heterogeneity led to lower HRs (2.3 and 2.1, respectively). Adding stage to MATV did not increase stratification power (HR, 2.84), whereas adding heterogeneity increased HR to 3.55, with 49 mo versus 9.1 mo median OS. The addition of the three led to the highest HR of 3.81 (supplemental Table 6, Fig. 7B). Survival curves were also evaluated according to a 3-value score (MATV < 35 cm3 AND E1 < 7.35, MATV > 35 cm3 OR E1 < 7.35, and MATV > 35 cm3 AND E1 > 7.35), leading to survival curves with median OS of 49, 20, and 9 mo, respectively (P < 0.0001, HRs of 1.8 and 4.3) (Supplemental Figs. 5B and 7C), highlighting the higher complementary value of heterogeneity and volume in this cohort.
DISCUSSION
There is increasing interest in the use of PET image textural features for quantification of intratumoral heterogeneity (4,6). Few studies have investigated the relationships between tumor volume and textural features (15,19,23).
Most studies using textural features have considered volumes greater than 3–5 cm3, assuming that PET cannot characterize heterogeneity in smaller volumes because of its limited spatial resolution. A recent theoretic analysis suggested that volumes of more than 45 cm3 should be considered to avoid volume-related confounding effects (14). However, that analysis considered a single parameter (entropy) calculated on 2-dimensional co-occurrence matrices over 2 spatial directions followed by averaging and using a quantization value of more than 150 (14).
In this work, we addressed the question of the minimum functional volume that could be considered, and we investigated the potential complementary prognostic value between volume and heterogeneity. We also investigated the influence of the quantization preprocessing and of the textural feature calculation methodology, evaluating more thoroughly the relationships between heterogeneity and functional volume in a substantially larger tumor database covering large tumor volume ranges and different cancer types. Considering a patient cohort with variable cancer types and complementary volume ranges provided a better picture of the relationship between the measured feature and its corresponding volume.
Our results partly confirm those of recent studies. Indeed, several textural features were found to be highly correlated with the volume from which they were calculated. In addition, high correlations were found between most of these parameters. We observed differences in the heterogeneity–volume distributions as a function of tumor type, although these differences can be explained by differences in volume ranges for each cancer patient cohort, rather than the histology or heterogeneity specific to each tumor type. For instance, the distribution of textural features with respect to volume in the cervix tumors was significantly different from the others because it included only large tumors (>20 cm3) relative to the other patient cohorts considered, which also included smaller tumor volumes.
Our results emphasize that the relationship and the level of correlation is not the same for all features. The level of correlation tends to decrease substantially when larger tumor volumes are considered; both the calculation method and the quantization step affect the relationship and level of correlation between volume and feature; and volume and heterogeneity can have complementary prognostic value. In the NSCLC cohort, heterogeneity and volume were identified as independent prognostic factors, and HRs were shown to increase from less than 2.9 to more than 3.8 when these risk factors were added for patient stratification. Although multivariate analysis could not be performed in the esophageal cohort, combining heterogeneity with volume led to an increased stratification, although the difference was not statistically significant. NSCLC tumor volumes were much larger than esophageal ones (58 ± 77 cm3, median of 34, range of 3–415, vs. 25 ± 27 cm3, median of 15, range of 3–140), which is likely why heterogeneity and volume had higher complementary prognostic values in NSCLC.
When considered together, these results point to the potential added prognostic value of tumor heterogeneity quantified with textural features, although regarding Kaplan–Meier curves, cutoff values found with receiver operating characteristic analysis are probably over-fitted and specific to the data, and thus validation in independent cohorts will be required.
The quasilinear relationship between entropy (either E1 or E13) and volume in the range of 3–10 cm3 (rs > 0.9, Fig. 4) suggests that entropy for volumes of less than 10 cm3 cannot provide complementary information. However, when appropriate quantization and co-occurrence matrix calculation are chosen, the correlation between volume and entropy for volumes in the range of 10–50 cm3 was much lower. The minimal volume to consider may therefore be closer to 10 cm3 than 45 cm3, a value previously suggested on the basis of calculations performed after a quantization into more than 150 gray levels and using several co-occurrence matrices followed by averaging (14). In addition, for other textural features not considered in that last study, the correlation was weaker, even for volumes between 3 and 10 cm3. It was only 0.4 and 0.6 for D13 and D1, respectively, and 0.3 and 0.2 for zone percentage and HILAE, respectively. Therefore, instead of excluding patients with volumes below the proposed 10 cm3 threshold from such analysis, we rather recommend reporting the correlation between volume and heterogeneity and highlighting their complementary value as tumor volumes increase. Indeed, the correlation with volume decreased substantially for all textural features when larger volumes were considered. Larger tumors are known to exhibit higher hypoxia, necrosis, or anatomic and physiologic complexity at the microscopic and macroscopic scales, which logically translates to higher complexity in the spatial distribution of 18F-FDG uptake and consequently associated heterogeneity quantification. A significant correlation between quantified heterogeneity (via any method) and its corresponding volume is therefore to be expected in a standard cohort of patients covering a large range of tumor sizes. Prospective clinical studies with optimized predefined image acquisition settings and heterogeneity analysis protocols, as well as experimental studies demonstrating that tumor properties on a scale comparable with the PET resolution can actually lead to identifiable image textural features, could benefit from the results of the present study and should now be conducted.
One important aspect of this study is that the 555 PET images in our database came from 6 cohorts acquired in different centers, albeit with certain homogeneity in acquisition parameters (same scanner, reconstruction algorithm, voxel size) except for one. This variability was handled by restricting the analysis to robust features only, so as to minimize the associated impact. Indeed, excluding the head and neck cohort with a different imaging protocol did not change the results. On the other hand, the inclusion of a small number of heterogeneity quantification metrics may be considered a limitation. However, the 4 textural features included have been previously shown to be the most reproducible and robust among those shown to have a predictive and prognostic value in different cancer types. We also restricted the prognosis analysis to the esophageal and NSCLC cohorts because clinical and survival data for the other cohorts were not available for enough patients to allow for multivariate analysis.
CONCLUSION
Most of the textural features considered to quantify intratumoral heterogeneity were found to be significantly correlated with tumor volume. However, our detailed analysis also suggests that heterogeneity quantification through textural features may potentially provide valuable clinical complementary information in addition to functional volume, especially for tumors larger than 10 cm3, with increasing complementary prognostic value for larger volumes. In 112 esophageal patients, heterogeneity was found to have some prognostic value that was not significantly improved when combined with volume, whereas in a cohort of 101 NSCLC patients, heterogeneity, volume, and stage were independent prognostic factors that allowed increased stratification of patients when combined.
DISCLOSURE
The costs of publication of this article were defrayed in part by the payment of page charges. Therefore, and solely to indicate this fact, this article is hereby marked “advertisement” in accordance with 18 USC section 1734. This work received French government support granted to the CominLabs excellence laboratory and managed by the National Research Agency in the “Investing for the Future” program under reference ANR-10-LABX-07-01. No other potential conflict of interest relevant to this article was reported.
Footnotes
↵* Contributed equally to this work.
Published online Dec. 11, 2014.
- © 2015 by the Society of Nuclear Medicine and Molecular Imaging, Inc.
REFERENCES
- Received for publication June 7, 2014.
- Accepted for publication October 16, 2014.


Jump to section
Related Articles
Cited By...
- Is PET Radiomics Useful to Predict Pathologic Tumor Response and Prognosis in Locally Advanced Cervical Cancer?
- Quantitative Radiomics Features in Diffuse Large B-Cell Lymphoma: Does Segmentation Method Matter?
- Texture Feature Comparison Between Step-and-Shoot and Continuous-Bed-Motion 18F-FDG PET
- Radiomics Analysis of Clinical Myocardial Perfusion Stress SPECT Images to Identify Coronary Artery Calcification
- Metabolic Biomarker-Based BRAFV600 Mutation Association and Prediction in Melanoma
- Radiomics: Data Are Also Images
- Optimized Feature Extraction for Radiomics Analysis of 18F-FDG PET Imaging
- Variability and Repeatability of Quantitative Uptake Metrics in 18F-FDG PET/CT of Non-Small Cell Lung Cancer: Impact of Segmentation Method, Uptake Interval, and Reconstruction Protocol
- Radiomics in Vulvar Cancer: First Clinical Experience Using 18F-FDG PET/CT Images
- Glioma Survival Prediction with Combined Analysis of In Vivo 11C-MET PET Features, Ex Vivo Features, and Patient Features by Supervised Machine Learning
- Predicting Response to Neoadjuvant Chemoradiotherapy in Esophageal Cancer with Textural Features Derived from Pretreatment 18F-FDG PET/CT Imaging
- Reliability of PET/CT Shape and Heterogeneity Features in Functional and Morphologic Components of Non-Small Cell Lung Cancer Tumors: A Repeatability Analysis in a Prospective Multicenter Cohort
- Understanding Changes in Tumor Texture Indices in PET: A Comparison Between Visual Assessment and Index Values in Simulated and Patient Data
- Predicting Pathologic Response of Esophageal Cancer to Neoadjuvant Chemotherapy: The Implications of Metabolic Nodal Response for Personalized Therapy
- Implementation of a Multicenter Biobanking Collaboration for Next-Generation Sequencing-Based Biomarker Discovery Based on Fresh Frozen Pretreatment Tumor Tissue Biopsies
- The Impact of Optimal Respiratory Gating and Image Noise on Evaluation of Intratumor Heterogeneity on 18F-FDG PET Imaging of Lung Cancer
- Comparison of Tumor Uptake Heterogeneity Characterization Between Static and Parametric 18F-FDG PET Images in Non-Small Cell Lung Cancer
- Pretreatment 18F-FDG PET Textural Features in Locally Advanced Non-Small Cell Lung Cancer: Secondary Analysis of ACRIN 6668/RTOG 0235
- The Incremental Value of Subjective and Quantitative Assessment of 18F-FDG PET for the Prediction of Pathologic Complete Response to Preoperative Chemoradiotherapy in Esophageal Cancer
- Molecular Imaging to Plan Radiotherapy and Evaluate Its Efficacy
- Multimodal Partial-Volume Correction: Application to 18F-Fluoride PET/CT Bone Metastases Studies