


Abstract
Adequate prediction of tumor response to neoadjuvant chemoradiotherapy (nCRT) in esophageal cancer (EC) patients is important in a more personalized treatment. The current best clinical method to predict pathologic complete response is SUVmax in 18F-FDG PET/CT imaging. To improve the prediction of response, we constructed a model to predict complete response to nCRT in EC based on pretreatment clinical parameters and 18F-FDG PET/CT–derived textural features. Methods: From a prospectively maintained single-institution database, we reviewed 97 consecutive patients with locally advanced EC and a pretreatment 18F-FDG PET/CT scan between 2009 and 2015. All patients were treated with nCRT (carboplatin/paclitaxel/41.4 Gy) followed by esophagectomy. We analyzed clinical, geometric, and pretreatment textural features extracted from both 18F-FDG PET and CT. The current most accurate prediction model with SUVmax as a predictor variable was compared with 6 different response prediction models constructed using least absolute shrinkage and selection operator regularized logistic regression. Internal validation was performed to estimate the model’s performances. Pathologic response was defined as complete versus incomplete response (Mandard tumor regression grade system 1 vs. 2–5). Results: Pathologic examination revealed 19 (19.6%) complete and 78 (80.4%) incomplete responders. Least absolute shrinkage and selection operator regularization selected the clinical parameters: histologic type and clinical T stage, the 18F-FDG PET–derived textural feature long run low gray level emphasis, and the CT-derived textural feature run percentage. Introducing these variables to a logistic regression analysis showed areas under the receiver-operating-characteristic curve (AUCs) of 0.78 compared with 0.58 in the SUVmax model. The discrimination slopes were 0.17 compared with 0.01, respectively. After internal validation, the AUCs decreased to 0.74 and 0.54, respectively. Conclusion: The predictive values of the constructed models were superior to the standard method (SUVmax). These results can be considered as an initial step in predicting tumor response to nCRT in locally advanced EC. Further research in refining the predictive value of these models is needed to justify omission of surgery.
Esophageal cancer (EC) is one of the most aggressive tumors, with early recurrences even after radical surgery. The standard treatment in locally advanced (T1/N1–3/M0 and T2–4a/N0–3/M0) resectable EC is neoadjuvant chemoradiotherapy (nCRT) followed by a radical esophagectomy. In the Dutch CROSS (ChemoRadiotherapy for Oesophageal cancer followed by Surgery Study) trial, nCRT improved the 5-y overall survival rate from 34% to 47% (1). Not all patients benefit from nCRT; 29% of the patients in the CROSS trial had a complete response, 52% had a partial response, and even 18% had no tumor response (1). For complete responders, surgical intervention might not be beneficial and a wait-and-see policy might suffice. Hence, adequate response prediction is important in developing personalized treatment in EC. Moreover, accurate response prediction may be relevant in patient counseling in future clinical trial strategies based on personalized treatment. So far, response prediction showed only promising results with functional imaging of tumor viability with 18F-FDG PET and recently with diffusion-weighted MRI (2–4). Traditional image-derived indices used in PET rely on quantification of lesion SUVs and overall tumor volume, which have been shown to be important factors for patient outcome and treatment response (5,6). Although useful, these parameters omit available information related to the spatial distribution and specific features regarding intratumor radiotracer accumulation. This may limit the possibility to further characterize the biologic behavior of the tumor, based on hypoxia-induced heterogeneity and genomic instability. Intratumoral heterogeneity is correlated with aggressive tumor behavior and a decreased response due to expression of specific receptors with high cellular proliferation and angiogenesis (7–9). Hence, even small tumor biopsies lack complete molecular characterization due to spatial heterogeneity. A novel approach is to quantify spatial heterogeneity of metabolism and tissue density characterized by 18F-FDG uptake and Hounsfield units with textural features. The concept of textural analysis is based on the spatial arrangement of voxels in a predefined volume of interest (VOI). This spatial intratumoral heterogeneity can be depicted from different spatial interrelationships on 18F-FDG PET/CT scans. Therefore, 18F-FDG PET/CT textural features have been proposed to be valuable in response prediction (10–15). The aim of this study was to develop a model to predict complete response to nCRT in locally advanced EC based on pretreatment clinical predictors and 18F-FDG PET/CT–derived textural features.
MATERIALS AND METHODS
Patients
In this retrospective study, potentially curatively resectable EC patients were consecutively selected who underwent nCRT followed by esophagectomy between December 2009 and March 2016. Patients with fewer than 4 courses of chemotherapy, with missing 18F-FDG PET/CT or with incomplete medical records, were excluded, yielding a total of 97 patients. In line with the rules of the Dutch National Health Sciences, our Institutional Review Board approved this retrospective study, and the requirement to obtain informed consent was waived.
Data were obtained from a prospectively maintained single-institution database including patient characteristics, tumor- and treatment-related data, and follow-up data. All patients were clinically staged with esophagoscopy and biopsy, endoscopic ultrasonography with fine-needle aspiration if indicated, and whole-body integrated 18F-FDG PET/CT. Patients were staged according to the seventh edition of the TNM system maintained by the American Joint Committee on Cancer (16) and discussed in the hospital’s multidisciplinary esophageal tumor board.
Imaging
PET/CT imaging was performed with an integrated 18F-FDG PET/CT system (Biograph mCT 4–64 PET/CT; Siemens). Patients fasted for at least 6 h before PET/CT, with no restrictions on drinking water. Serum glucose levels were measured before 18F-FDG administration with a weight-based dose of 3 MBq/kg. Sixty minutes after tracer injection, patients were scanned in treatment position. An inspiration breath-hold low-dose CT for attenuation correction was performed, and PET acquisitions were obtained in the caudal–cranial direction with a field of view of 500 × 500 × 500 mm, 3-dimensional setting, 2–3 min per bed position, matrices of 512 × 512 (0.98 × 0.98 mm pixel size), and 2-mm slice thickness. Image data were reconstructed according to guidelines of the European Association of Nuclear Medicine (17).
Radiotherapy treatment planning including target volume delineation and CT texture analysis was performed on a 16- or 64-multidetector row spiral CT machine (Somatom Sensation 16 or 64; Siemens Medical Systems). A CT thorax/abdomen scan was obtained in the cranial–caudal direction with matrices of 512 × 512 (0.98 × 0.98 mm pixel size) and a 3-mm slice thickness.
Treatment and Pathology
On the basis of the experiences and the good results of the CROSS study, in which our institute had participated, our multidisciplinary tumor board decided to continue nCRT according to the CROSS schedule. This treatment consisted of weekly intravenously administered paclitaxel (50 mg/m2) and carboplatin (areas under the receiver-operating-characteristic curve [AUC], 2 mg·min·mL−1) during 5 wk with concurrent external radiotherapy (41.4 Gy in 23 fractions, 5 d per wk) (1). Transthoracic esophagectomy with 2-field lymphadenectomy was performed within 6–8 wk after completion of nCRT. The resected specimens were examined according to a standard protocol (18). Resection margins were defined according to the definitions of the College of American Pathologists as microscopic tumor-free (R0: > 0 mm) or tumor-positive (R1). Pathologic response was assessed by 2 expert gastrointestinal pathologists according to the Mandard tumor regression grade (TRG) (19), ranging from complete response (TRG 1) without viable tumor cells left, to partial response (TRG 2–4) with viable tumor cells left, to no response at all (TRG 5).
VOI
Textural analysis was performed on a VOI incorporating the gross tumor volume for radiation treatment planning. Tumor delineation was performed manually with consensus between 3 experienced radiation oncologists on axial planes of the radiotherapy planning CT, to enclose 3-dimensional coverage of the entire tumor. Involved lymph nodes were not included into the VOI, because these lesions are too small (<10 cm3) for reliable textural analysis (20). The gross tumor volume was rigidly registered to the 18F-FDG PET/CT data series (RTx Workstation 1.0; Mirada Medical). Erroneous registrations were manually adjusted after consensus of the collaborating investigators.
Tonal Discretization
18F-FDG PET/CT imaging data and VOI delineations were loaded into Matlab 2014b (MathWorks; an interactive image processing environment) for processing and analyses. The SUV, for semiquantitative analysis of metabolism, was corrected for individual variations in serum glucose level and was discretized to reduce the continuous scale to a finite set of values and to reduce noise throughout the entire study in increments of 0.5 g/mL according to Doane’s optimal bin width (21). Similarly, the Hounsfield unit scale for quantitative analysis of tumor density was discretized in increments of 30 Hounsfield units for textural analysis.
Candidate Predictors
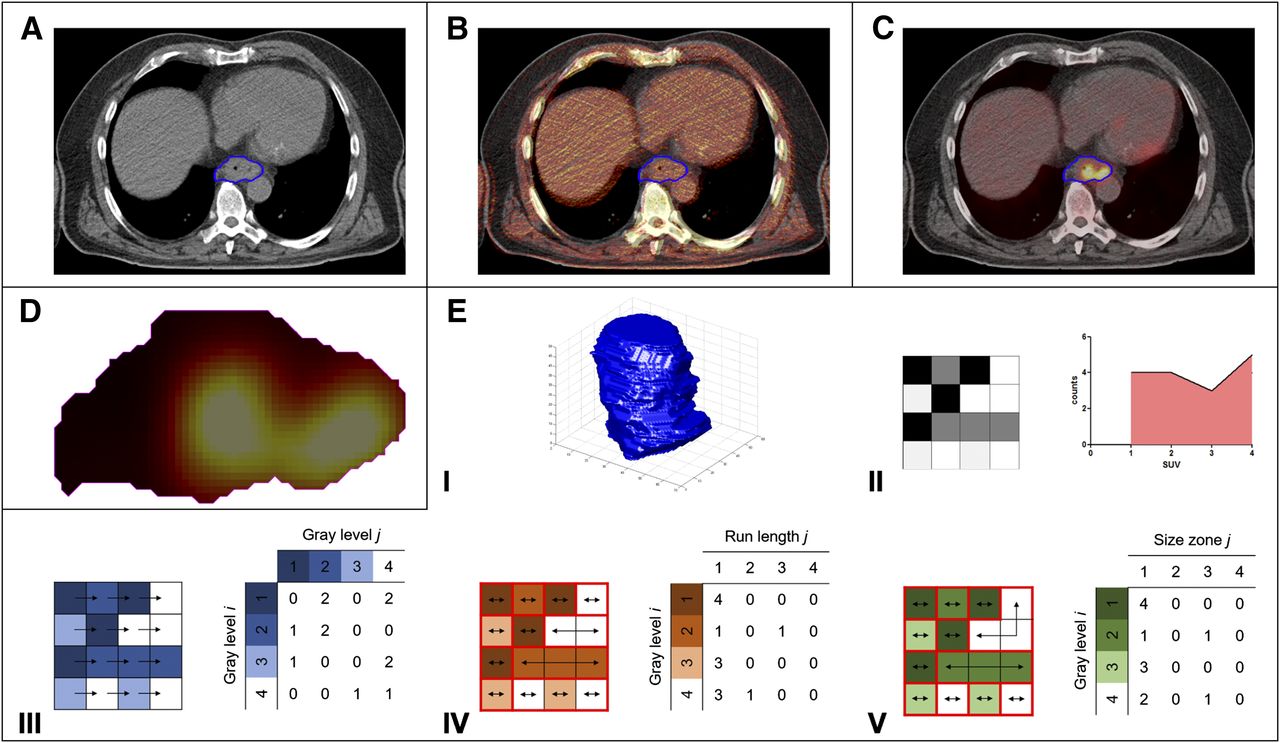
For each patient, a total of 88 parameters were evaluated, including 7 clinical parameters; 16 geometry features; the glycolytic volume based on tumor volume and SUVmean; and 19 first-order, 24 second-order, and 22 higher order textural features extracted from 18F-FDG PET and CT (supplemental materials [available at http://jnm.snmjournals.org]). First-order textural features are statistics based on the gray level distribution of the image but do not consider relative positions of gray levels. Second- and higher order textural features do consider relative positions of gray levels and therefore allow quantification of heterogeneity. For various spatial interrelationships, frequency distributions (Fig. 1) were obtained—that is, the gray level co-occurrence (spatial dependence) matrix for pairwise arrangement of voxels (extracted with a pixel-to-pixel distance equal to 1) (22), the gray level run-length matrix for alignment of voxels with the same intensity (23), and the gray level size-zone matrix for characteristics of homogeneous zones (24). Directional voxel analysis was performed in 3 dimensions with a connectivity of 26 voxels and analysis in 13 angular directions. All second- and higher order textural features are weighted averages of these matrices to express the relative importance of their properties. All extracted textural features were normalized to the range [0,1].

(A) Manual delineation of gross tumor volume on planning CT. (B) Coregistration of low-dose CT (lava colormap) to radiotherapy planning CT (gray scale colormap). (C) Overlay of PET image (lava colormap) onto radiotherapy planning CT (gray scale colormap). (D) Cropping of PET VOI. (E) Feature extraction: (I) assessment of tumor shape by means of geometry features, (II) global assessment of tonal distribution by means of first-order textural features, (III) assessment of pairwise arrangement of voxels by means of gray level co-occurrence matrix, (IV) assessment of alignment of voxels with the same intensity by means of gray level run-length matrix, (V) assessment of characteristics of homogeneous zones by means of gray level size-zone matrix.
Statistical Analysis
Statistical analysis was performed with R 3.2.2 open-source software using the glmnet package (version 2.0–2) and the rms package (version 4.4–0), available from the Comprehensive R Archive Network (http://www.r-project.org).
Because textural feature values may be subject to interobserver variability in the delineation of the tumor, the original delineations were uniformly eroded by ball-shaped structuring elements with radii of 1 and 2 voxels. For each delineation, textural features were extracted and the stability of each feature was evaluated with the intraclass correlation. Only stable features (intraclass correlation > 0.7) were considered for further analysis. Predictors were then selected by a univariable logistic model with a response variable labeling complete (Mandard TRG 1) and incomplete response (Mandard TRG 2–5). All potential predictors that met the Akaike information criterion (AIC) were considered significant. To discourage overfitting, the AIC is based on rewarding goodness of fit and penalizing the complexity of the model. The AIC requires χ2 > 2⋅df—that is, when considering a predictor with one degree of freedom df, this implies an α = P(χ2 ≥ 2) = 0.157 (25).
Significant predictors were used to construct 6 multivariable logistic regression models for comparison with current most accurate prediction model with SUVmax as predictor variable (model 1). These models were constructed by introducing clinical parameters (model 2); clinical parameters and geometry features (model 3); clinical parameters, geometry features, and PET textural features (model 4); clinical parameters, geometry features, and CT textural features (model 5); and clinical parameters, geometry features, and PET/CT textural features (model 6) to a least absolute shrinkage and selection operator, a technique for L1-norm regularization. By increasing the shrinkage parameter λ, the regularization shrinks the estimated coefficients and excludes variables when they become zero. The λ-value that minimized the 10-fold cross-validated mean squared error was repeatedly determined with 100 repetitions. The optimal λ-value was robustly determined by averaging over these obtained λ-values. The selected variables were fitted to the data with a logistic regression.
The model’s calibration was evaluated using visual inspection of calibration plots and the Hosmer–Lemeshow test. The model’s performance was quantified in terms of discrimination with the AUC and the discrimination slope. The goodness of fit was evaluated with the −2 loglikelihood and the Nagelkerke R2. The model was internally validated by a bootstrap approach with 2,000 repetitions. Bootstrapping allowed for obtaining the optimism-corrected measures for model performance and for shrinkage of the estimated regression coefficients using the optimism-corrected slope.
RESULTS
Patients and Treatment
Patients characteristics are shown in Tables 1 and 2. Seventy-nine patients (81.4%) received the complete nCRT regimen (all patients received the full radiotherapy dose). Resection with curative intent was performed within a mean time of 56 (SD, 14) d after completion of nCRT. R0 resection was achieved in 90 (92.8%) patients and R1 resection in 7 (7.2%) patients, all with positive circumferential resection margins and one with a positive proximal resection margin. Pathologic findings revealed complete response in 19 patients (19.6%) and incomplete response in 78 patients (80.4%).
Patient Characteristics
Staging According to Seventh Edition of TNM System Maintained by American Joint Committee on Cancer (16)
Model Development
For the preselection, 144 of the 147 (97.3%) variables were found to be robust for contour variations. These variables were introduced to univariable logistic regression analysis, resulting in 24 significant variables predictive for response, including 4 clinical parameters; 0 geometry features; 1 first-order, 8 second-order, and 5 higher order PET textural features; and 1 first-order, 1 second-order, and 4 higher order CT textural features. All constructed prediction models performed significantly better than model 1 (based on SUVmax). The introduction of only significant clinical parameters to the least absolute shrinkage and selection operator regularization process resulted in the selection of histologic type and clinical T-stage (model 2). These variables were selected in each subsequently constructed model. Compared with model 1, the AUC improved from 0.58 to 0.71, the discrimination slope improved from 0.01 to 0.14, and the AIC decreased (ΔAIC = 10.66). For model 3, no additional variables were selected compared with model 2, because no geometry features were significant at the univariable logistic regression analysis. For model 4, the PET textural feature long run low gray level emphasis (LRLGLe-PET) was selected. Adding this variable did slightly improve the discrimination and the likelihood compared with models 2 and 3, but resulted in a higher AIC (ΔAIC = −0.79). After internal validation, the AUC was equal to 0.69. For model 5, the CT textural feature run percentage (RP-CT) was selected. Although the AIC was almost equal compared with models 2 and 3 (ΔAIC = −0.02), adding this variable improved the discrimination slope to 0.16 and the AUC remarkably to 0.79. This also persisted after internal validation (AUC = 0.76). Finally, entering all variables to the modeling process resulted in the selection of all above-mentioned variables (model 6). Model 6 had the best goodness of fit, but not the lowest AIC (ΔAIC = −0.23, 0.56, and −0.21 compared with models 2–3, 4, and 5, respectively). The AUC slightly decreased to 0.78, whereas the discrimination slope was increased to 0.17. After internal validation, the AUC decreased to 0.74. The model regression coefficients and the corresponding model performance measures are shown in Tables 3 and 4, respectively. Figure 2 gives the values of the selected textural features and their corresponding frequency distributions for a complete and a nonresponder. For the selected textural features, the range of values to reproduce the normalization process and the found intraclass correlations for quantifying contouring robustness are given in the supplemental materials.
Estimated Regression Coefficients of Prediction Models for Pathologic Complete Response Without Optimism Correction
Estimates of Model Performance for the Prediction Models
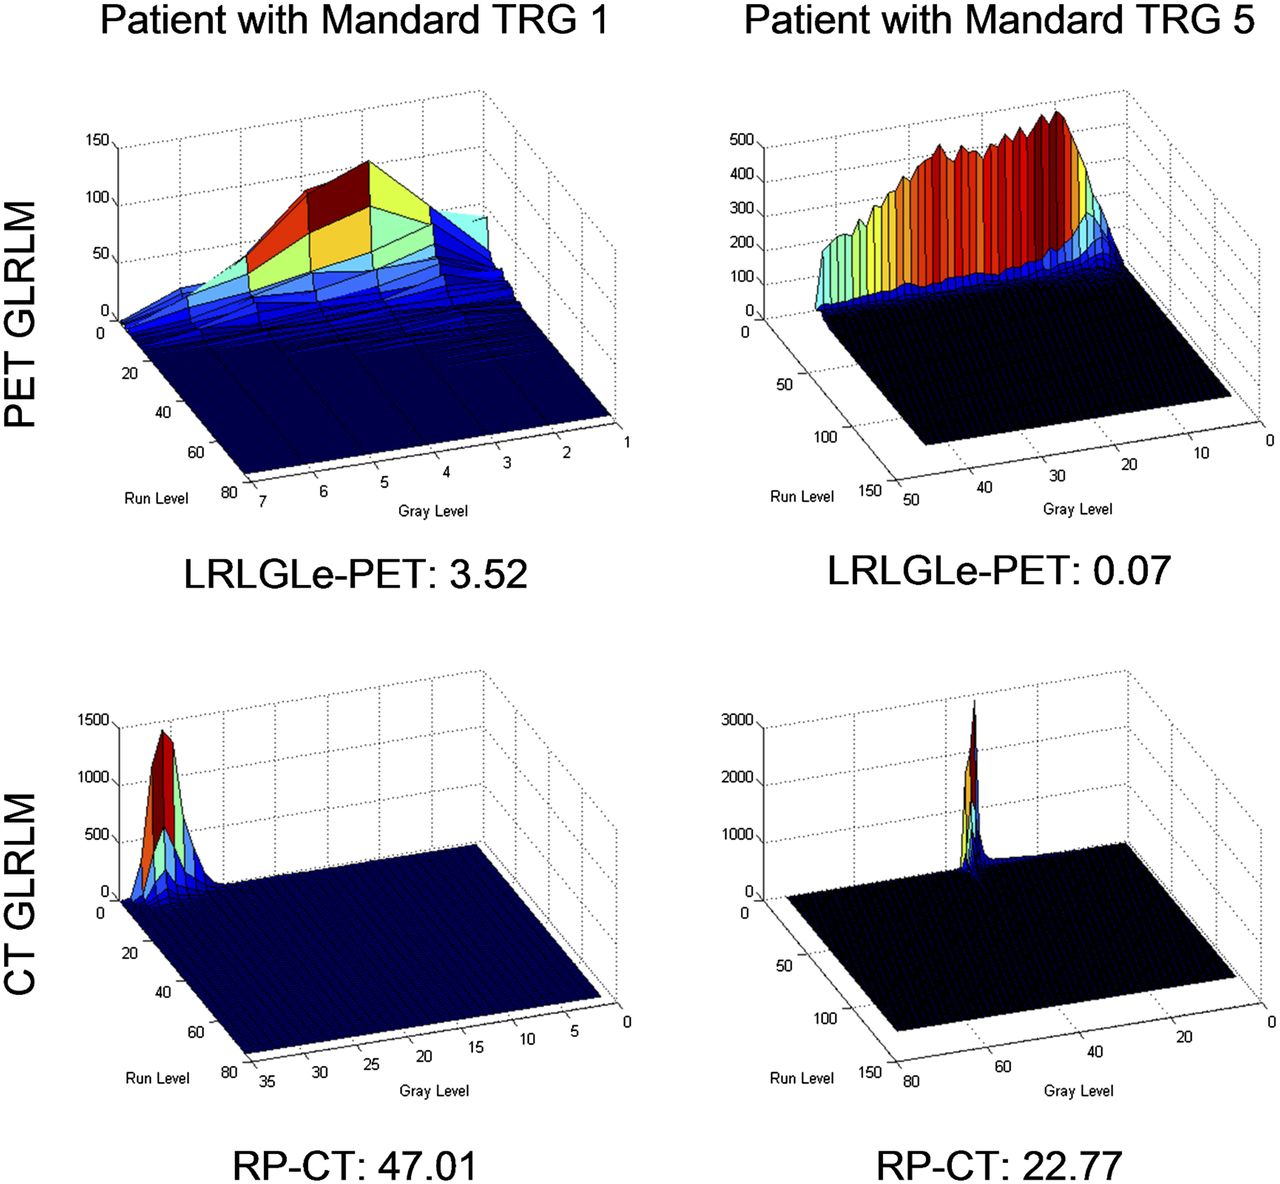
Example of values of selected textural features and their corresponding frequency distributions for complete and nonresponder. GLRLM = gray level run-length matrix.
DISCUSSION
An adequate method to predict pathologic complete response after nCRT has not yet been defined in EC patients. In personalized treatment, accurate response prediction will lead to a paradigm shift with omission of surgical treatment in complete responders or prevention of unnecessary nCRT in nonresponders. Response evaluation of nCRT is commonly based on tumor metabolic response measured by SUVmax with 18F-FDG PET, but with a low sensitivity and specificity of 67% and 68%, respectively (26). The current study is, to our knowledge, the first in predicting complete response with 18F-FDG PET/CT–derived textural features in a homogeneous group of EC patients treated according to the CROSS regimen. We demonstrated that all constructed prediction models showed significant improvement compared with predictions based on SUVmax alone and may therefore be considered as an initial step in predicting response.
In this study, the most predictive textural features were LRLGLe-PET and RP-CT. LRLGLe-PET depends on long runs (coarse texture) with low gray levels and was higher (i.e., low and homogeneous 18F-FDG uptake) for complete responders and lower (i.e., high and heterogeneous 18F-FDG uptake) for incomplete responders, possibly due to tumor hypoxia and necrosis. RP-CT measures the homogeneity of runs (fine texture) and was higher in complete responders. In univariable logistic regression, high LRLGLe-PET and RP-CT values were associated with squamous cell carcinoma (P = 0.12 and 0.13, respectively), confirming the higher complete response rates in squamous cell carcinoma (1).
The clinical value of SUVmax was limited, possibly because it is extracted from a single voxel and does not characterize the total 18F-FDG uptake. This causes a high dependency on the quality of the PET images (including noise) and the voxel size, which induces a low reproducibility.
Several studies focused on response prediction in EC using 18F-FDG PET/CT–derived textural features (Table 5). Van Rossum et al. concluded that 18F-FDG PET–derived textural features provide statistical value (14), but this does not translate into a clinically relevant benefit, which is in line with our findings. Van Rossum et al. performed only 18F-FDG PET textural analysis, whereas this study demonstrates the additional value of CT textural analysis. Other studies demonstrated promising findings but are hampered by several limitations, including small patient cohorts with heterogeneous treatment schedules, lack of multivariable analyses, and a substantial chance of model overfitting due to the lack of optimism correction (11–13,15).
Current Literature Describing 18F-FDG PET Texture Analysis in Response Prediction in EC
A limitation of this study is the absence of external validation, which is essential for implementation into clinical practice. Moreover, the following factors that affect textural analysis should be considered. Changing the bin width influences the quantization noise and has a crucial effect on textural features (27). Although only an indication, we used Doane’s optimal bin width to discretize the SUVs and Hounsfield units (21). Moreover, respiratory gated PET/CT acquisitions could be considered to reduce respiration-induced smearing and contrast degradation (28).
The constructed prediction model may serve as a basic model, which can be extended with new features for usage for other applications. The current constructed model might be helpful toward a safe decision in postponing a burdensome surgical procedure in patients with a doubtful adequate physical condition after nCRT. In patients treated with definitive chemoradiotherapy, detection of nonresponders might allow additional treatments when available, whereas in complete responders an adjusted follow-up might be justified, to identify candidates for salvage surgery.
Up to now, the authors do not consider the predictive value of the constructed model high enough to justify the omission of surgery after nCRT in EC. A potential approach to improve the constructed basic prediction models could be (a) adding interim- or posttreatment textural analysis. Studies investigating both pre- and posttreatment textural analysis mainly reported posttreatment textural features to be associated with response (12,14,15). We performed a posttreatment textural analysis in patients with a posttreatment PET/CT scan (n = 20) and found 21 significant textural features for response in univariable regression analysis. However, posttreatment textural analysis suffers from radiation-induced esophagitis, which complicates delineation of the primary tumor and creates difficulties with tumor delineation in complete responders. (b) Texture could be characterized with more specific PET tracers such as 18F-fluoroerythronitroimidazole (quantifying hypoxia) (29) or 18F-fluorothymidine (targeting cellular proliferation) (30) or by other functional imaging modalities including the apparent diffusion coefficient in diffusion-weighted MRI (4). (c) Moreover, biologic markers have shown to be potential molecular markers in individualizing EC treatment and may be incorporated to improve prediction models (31).
CONCLUSION
The constructed models are a valuable initial step in predicting response to nCRT in locally advanced EC. Adding the 18F-FDG PET–derived textural feature LRLGLe-PET and RP-CT to a model with the clinical parameter histologic type and clinical T-stage is potentially predictive and was more accurate than response prediction based on SUVmax. These models may serve as basic models in determining clinical complete responders and can be extended with new features for usage for other applications.
DISCLOSURE
No potential conflict of interest relevant to this article was reported.
Footnotes
Published online Oct. 13, 2016.
- © 2017 by the Society of Nuclear Medicine and Molecular Imaging.
REFERENCES
- Received for publication July 11, 2016.
- Accepted for publication September 19, 2016.


Jump to section
Related Articles
Cited By...
- Pretreatment radiomic biomarker for immunotherapy responder prediction in stage IB-IV NSCLC (LCDigital-IO Study): a multicenter retrospective study
- A Meta-Analysis for Using Radiomics to Predict Complete Pathological Response in Esophageal Cancer Patients Receiving Neoadjuvant Chemoradiation
- A Postreconstruction Harmonization Method for Multicenter Radiomic Studies in PET