


Abstract
Gliomas are the most common type of tumor in the brain. Although the definite diagnosis is routinely made ex vivo by histopathologic and molecular examination, diagnostic work-up of patients with suspected glioma is mainly done using MRI. Nevertheless, l-S-methyl-11C-methionine (11C-MET) PET holds great potential in the characterization of gliomas. The aim of this study was to establish machine-learning–driven survival models for glioma built on in vivo 11C-MET PET characteristics, ex vivo characteristics, and patient characteristics. Methods: The study included 70 patients with a treatment-naïve glioma that was 11C-MET–positive and had histopathology-derived ex vivo feature extraction, such as World Health Organization 2007 tumor grade, histology, and isocitrate dehydrogenase 1 R132H mutational status. The 11C-MET–positive primary tumors were delineated semiautomatically on PET images, followed by the extraction of tumor-to-background–based general and higher-order textural features by applying 5 different binning approaches. In vivo and ex vivo features, as well as patient characteristics (age, weight, height, body mass index, Karnofsky score), were merged to characterize the tumors. Machine-learning approaches were used to identify relevant in vivo, ex vivo, and patient features and their relative weights for predicting 36-mo survival. The resulting feature weights were used to establish 3 predictive models per binning configuration: one model based on a combination of in vivo, ex vivo, and clinical patient information (M36IEP); another based on in vivo and patient information only (M36IP); and a third based on in vivo information only (M36I). In addition, a binning-independent model based on ex vivo and patient information only (M36EP) was created. The established models were validated in a Monte Carlo cross-validation scheme. Results: The most prominent machine-learning–selected and –weighted features were patient-based and ex vivo–based, followed by in vivo–based. The highest areas under the curve for our models as revealed by the Monte Carlo cross-validation were 0.9 for M36IEP, 0.87 for M36EP, 0.77 for M36IP, and 0.72 for M36I. Conclusion: Prediction of survival in amino acid PET–positive glioma patients was highly accurate using computer-supported predictive models based on in vivo, ex vivo, and patient features.
Gliomas are the most common type of tumor in the brain, representing 81% of all cerebral malignancies. The incidence of gliomas as a whole is up to 5.7 per 100,000 people worldwide and increasing (1). Expected patient survival varies with glioma type, with the most frequent and highly malignant type—glioblastoma multiforme—showing the worst 5-y survival rate: about 5%. Clinical evaluation and therapeutic management of glioma patients currently rely on the combined analysis of age, Karnofsky score, and ex vivo tumor grade (1–3). Beyond tumor histology, molecular alterations such as isocitrate dehydrogenase 1 (IDH1) and 2 mutation, as part of the World Health Organization (WHO) 2016 classification system, have additional prognostic value in gliomas (4,5).
Imaging of gliomas is widely performed by MRI (6). Nevertheless, the high sensitivity and specificity of a radiolabeled amino acid PET tracer such as l-S-methyl-11C-methionine (11C-MET) is considered a promising diagnostic approach toward tumor characterization and longitudinal therapeutic monitoring (7–10).
The prognostic value of 11C-MET PET is currently under investigation. Recent reports on the feasibility of dichotomizing tumors by a maximum tumor-to-background ratio (TBR) threshold are contradictory (11–14). In contrast, in vivo features derived from 11C-MET PET SUVs have been reported to hold additive prognostic value (5).
One of the most prominent features of tumors is their heterogeneity across scales (15). It is therefore a logical step to investigate tumor heterogeneity in the context of survival prediction. Nevertheless, heterogeneity cannot be characterized by conventional calculations, such as SUVs, mean or maximum TBR, and metabolic tumor volumes (16). Recent studies have begun to focus on the evaluation of in vivo textural features on PET images, with promising results for characterizing tumor heterogeneity (17–19), therapy response (20), and disease-specific survival (21). Although a wide range of textural features is available, these calculations are not yet standardized and are subject to variations in acquisition and reconstruction protocols (15). Furthermore, textural features derived from textural matrices are affected by the low sample size and the variation in number of bins (NOB) (22,23).
Another challenging aspect of textural analysis is feature selection and redundancy (24). Here, filtering during preprocessing (24,25) or machine learning (ML)–driven approaches to feature selection (26,27) can be incorporated to reduce the number of features for predictive analyses. ML approaches have been widely applied in the field of morphologic tissue characterization using large-scale radiomic features (24,28). However, these approaches are still underrepresented in the field of molecular imaging.
In light of the evolving field of texture analysis and radiomic evaluation of PET images, this study was performed with 3 objectives. The first was to propose ML-driven methods of feature selection and weight estimation to identify and compare in vivo 11C-MET PET features, ex vivo features, and patient features of relevance for a 36-mo survival prediction. The second was to establish 4 ML-weighted-feature models to predict 36-mo survival: a model using in vivo, ex vivo, and patient features (M36IEP); a model using ex vivo and patient features only (M36EP); a model using in vivo and patient features only (M36IP); and finally, a model using in vivo features only (M36I). The third objective was to validate and compare all 4 models with retrospective survival information.
MATERIALS AND METHODS
Patient Data
Seventy patients with histologically verified treatment-naïve gliomas based on the WHO 2007 classification were collected from a preestablished cohort for this retrospective study (29). The patients were examined by 11C-MET PET between 2000 and 2013. All were older than 18 y, and all had accessible medical reports with a follow-up of at least 36 mo. Moreover, the study included only amino acid–positive cases with a known IHD1 R132H mutational status based on immunohistochemical staining (Table 1). Days of survival were dichotomized with a 36-mo threshold and used as a reference label for both the model training and the validation phases of this work (Fig. 1). The study was approved by the local institutional review board. Written informed consent was obtained from all patients before the imaging examinations.
Characteristics of Processed Study Cohort

Workflow for evaluating glioma cohort. Tumors are manually delineated on 11C-MET PET images, followed by automated extraction of 48 in vivo features. In addition, 5 patient characteristics and 3 ex vivo features are collected to establish 56-feature vector for each case. Extracted features are used for ML cross-training phase, which results in relevant features and their weights for 36-mo survival. Feature weights for 36-mo-survival predictive model are established on basis of ML results. Model is validated with MC cross-validation approach. Reference dichotomized standard survival labels (did not survive [0], survived [1]) are used during both training and validation phases.
PET Acquisition
PET was performed on an Advance PET system (GE Healthcare) (30) 20 min after injection of 770 ± 106 MBq of 11C-MET (mean ± SD; range, 447–972 MBq) produced in-house by a previously described method (31). The PET acquisition included a 10-min emission and a 5-min transmission scan. The attenuation- and scatter-corrected emission data were reconstructed by a standardized 3-dimensional filtered backprojection algorithm applying a Hanning filter with a 6.2-mm cutoff. The reconstructed axial matrix size was 128 × 128, with 35 slices per PET acquisition and a 3.125-mm slice thickness. The full width at half maximum of the reconstructed images was 5 mm.
Spatial Normalization and Tumor Delineation
Medical images are commonly resampled to a unified isotropic spatial resolution before radiomic evaluation to standardize voxel size differences in single or multicenter cohorts (15,32). To support repeatability, the PET images were resampled to a 1 × 1 × 1 mm voxel size. In choosing the target resolution, we considered the sensitivity of various textural features in a small sample (33,34). To minimize interpolation artifacts, the resampling was performed with the kriging interpolation (35).
The resampled PET images were transferred to commercially available software (Hybrid 3D; Hermes Medical Solutions) for tumor delineation. This process was performed by 2 nuclear medicine physicians in consensus using semiautomated 3-dimensional isocount volume-of-interest (VOI) tools. An optional slice-by-slice manual modifier tool was applied if the tumor boundaries could not be characterized by the isocount VOI tool. An additional reference background cuboid VOI was drawn on the contralateral region for TBR calculations. The coordinates and values of the voxels within the VOIs were exported via the Hybrid 3D software for further processing.
Feature Extraction
The PET voxel values inside each tumor VOI were normalized to the mean of the respective reference background VOI to generate a PET TBR VOI. This step was necessary to correct the individual tracer metabolism of the normal tissue (36,37). The PET TBRs were rebinned in 5 different ways considering different NOB and bin size (BS) configurations. Four binning processes were initiated using Equation 1 for a cohort-global bin range with a Tmin of 1.0 and a Tmax of 8.5, with NOB equaling 64, 150, 375, and 512. The corresponding BS values were 0.12, 0.05, 0.02, and 0.014, respectively: Eq. 1
Eq. 1
where v is the original TBR voxel value from a given VOI,  is the binned TBR value, and NOB is 64, 150, 375, and 512. TBRs with less than a Tmin of 1.0 were excluded from the VOIs. A Tmax of 8.5 represented the highest TBR in the cohort. The fifth binning technique applied a fixed BS of 0.05 TBR but with a specific NOB per tumor (38) as defined by Equation 2.
 Eq. 2
Eq. 2
where  is the minimum voxel value of the given VOI with a BS of 0.05.
Each of the binned PET TBR VOIs was subjected to extraction of 48 in vivo features, including general, histogram, and shape features, as well as textural features derived from the gray-level cooccurrence matrix, the gray-level zone-size matrix, and the neighborhood gray-tone difference matrix (15,23,39). In addition, 3 ex vivo features and 5 patient characteristics were assigned to the in vivo features to generate a 56-feature vector (48 + 3 + 5) for each tumor (Table 2).
Fifty-Six Extracted In Vivo and Ex Vivo Features and Patient Characteristics Assigned to Each Delineated Lesion in Feature Vector
Survival Prediction Model
A model scheme building on all 56 in vivo, ex vivo, and patient features was established on the basis of the principles of geometric probability covering algorithms (40). These algorithms model the gaussian distribution of features with  means and
  deviation arrays to provide a membership probability for each of the
  classifier outcomes. In this study, the gaussian distribution was determined by random bootstrapping with replacement (41,42). The probability that a feature vector (
 ) belonged to k classifier outcomes was characterized by
  membership probability functions (Eq. 3). This study extended the above approach in 2 ways. First, a binary feature selection array (
 was used to describe which features are relevant in the evaluation, and second, a feature weight array (
 ) was introduced to represent the importance of each selected feature:
 Eq. 3
Eq. 3
The predicted label of a feature vector  was provided by the
  function with the maximum probability value (Eq. 4):
 Eq. 4
Eq. 4
The above predictive model scheme was referred to as M36 in this study. Both the feature selection ( ) and the feature weight (
 ) arrays were unknown parameters that were determined by ML approaches.
Model Error Estimation
An estimator was established to characterize the receiver-operator-characteristic distance of the M36 models (Eq. 5) based on number of true positives (TP), true negatives (TN), false positives (FP), and false negatives (FN) (Supplemental Table 1; supplemental materials are available at http://jnm.snmjournals.org). The measurement compared the model-predicted and reference label values of input feature vectors using the confusion matrix (43): Eq. 5
Eq. 5
Feature Selection and Weight Estimation
For each of the 5 binning configurations,  and
and  were identified in a hierarchical ML-based approach by minimizing the ε model error (Fig. 2). The first ML layer identified relevant features (
 through an interactive approach using genetic algorithms (26), thereby modeling evolutionary processes. The second ML layer then identified the residual weights
  based on the content of each input
  using the Nelder–Mead method (44,45). An inherent dependency between the mask and the weight vectors was maintained in such a way that if a feature was not selected (
 ), then its weight was zero as well (
 ).
).
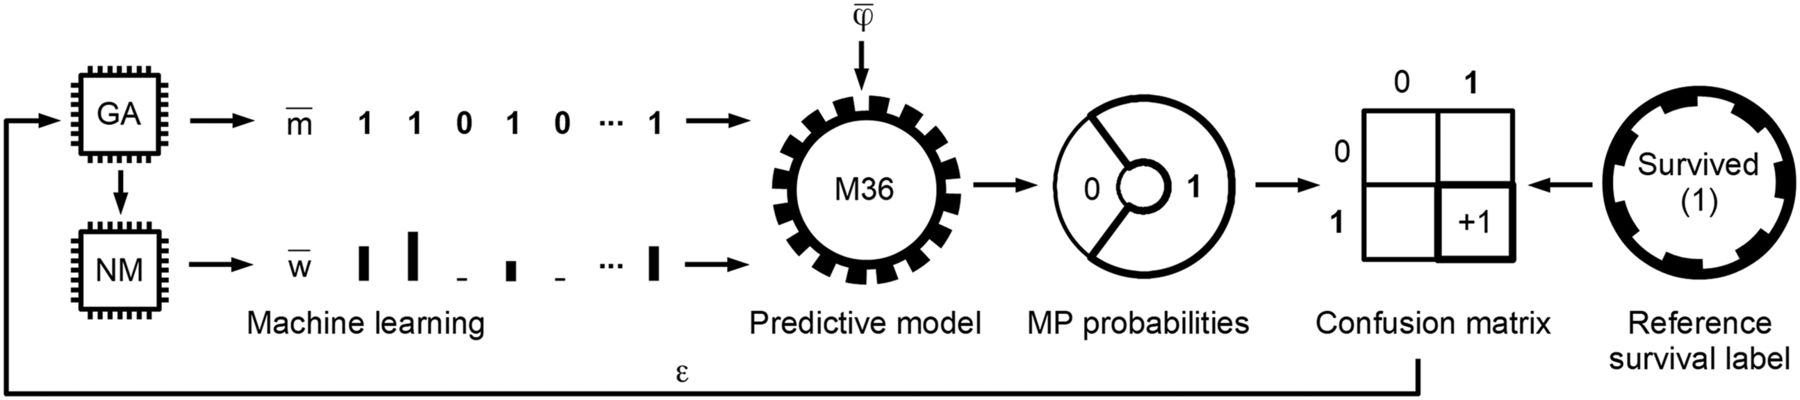
Identification of relevant features and their weights specific for 36-mo survival by ML. Genetic algorithm (GA) and Nelder–Mead (NM) ML methods determine feature-mask ( ) and feature-weight (
 ) arrays, respectively. Generic M36 predictive model evaluates input feature vector (
 ) and provides its survived (1) and did-not-survive (0) membership probabilities (MP). Highest probability (in current example, “Survived (1)”) is chosen as predicted value. Predicted and reference labels of
  are compared and stored in confusion matrix. Error measurement (ε) from confusion matrix is provided once all feature vectors in training phase are evaluated. ε error value is minimized by ML layers (GA and NM). The above process is performed in iterative cross-training scheme of 14 folds and 8 ML variants in each fold, resulting in 112 feature-mask and feature-weight variants that are used to identify relevant features and their weights for 36-mo glioma survival.
To avoid overfitting, the multilayer ML approach was executed in a 14-fold cross-training scheme over the dataset (46) with each of the 5 binning configurations. In each fold, 8 different ML algorithms were executed with different genetic algorithm mutation rates managed in parallel by simulated annealing (47). In this way, 112 (14 × 8) feature-mask and feature-weight variants were generated per binning configuration. The final feature mask ( ) was created by a feature-level logical OR operator over the 112 feature-mask variants. The 112 feature-weight variants of the given binning configuration were normalized to the sum of 1.0 and averaged to create the final feature-weight array (
 ). The supplemental materials contain a detailed explanation of the ML algorithm and its parameters.
On the basis of the ML-derived features ( ) and their weights (
 ), three 36-mo predictive models were established for each of the 5 bin configurations: M36IEP, M36IP, and M36I. In addition, a binning-independent model, M36EP, was created.
Predictive Model Validation
To measure the performance of the established models, Monte Carlo (MC) cross-validation was used (48) with 1,000 iterations. In each MC iteration, the dataset was randomly separated into a 60% training dataset (TDS) and a 40% validation dataset (VDS), with stratified selection and no overlapping ( ). The reference gaussian distributions (
 ,
, ) of M36IEP, M36EP, M36IP, and M36I were calculated from the given TDS. The corresponding VDS samples were subsequently evaluated by the configured models in each MC iteration. The predicted and respective reference-value pairs of VDS samples were recorded in a confusion matrix for each model for performance evaluation.
RESULTS
Feature Selection and Weight Estimation
Based on the averaged weights of the 5 binning-specific ML executions, the most prominent features were patient features and ex vivo features, such as age (10.3%), isocitrate dehydrogenase 1 (IDH1) R132H mutational status (8.6%), and WHO 2007 grade (6.8%). TBR sum (5%), spheric dice coefficient (4.7%), volume (4.5%), and coarseness neighborhood gray-tone difference matrix (4.1%) were the most prominent in vivo features (Fig. 3). The same prominent weights were selected by ML regardless of the binning configuration; however, individual weights differed per binning configuration (Supplemental Figs. 1–4).

ML-derived weights of 56 in vivo, ex vivo, and patient features in descending order. Weights reflect relative importance to one another for predicting 36-mo survival in 11C-MET PET–positive patients. Weights were determined by averaging 560 (5 binning × 112 models) weight variants derived by ML, executed in cross-training scheme. Individual weights of each weight variant were normalized to sum of 1.0 before averaging. BMI = body mass index; GLCM = gray-level cooccurrence matrix; GLZSM = gray-level zone-size matrix; NGTDM = neighborhood gray-tone difference matrix.
Predictive Model Validation
The models with highest area under the curve (AUC) in their category based on the MC cross-validation were M36IEP (BS, 0.05), with an AUC of 0.9; M36EP, with an AUC of 0.87; M36IP (NOB, 150), with an AUC of 0.77; and M36I (BS, 0.05), with an AUC of 0.73. The average AUCs of the 4 model types across the different binning configurations were 0.9 for M36IEP, 0.87 for M36EP, 0.77 for M36IP, and 0.7 for M36I. AUC did not significantly differ among different binning configurations; however, the largest AUC for models involving in vivo features was achieved with a binning configuration that had a BS of 0.05 (fixed BS, variable NOB per tumor), supporting previous results (38).
A detailed comparison of the models by sensitivity, specificity, accuracy, positive predictive value, negative predictive value, and AUC is shown in Table 3. Figure 4 compares 2 example patients with prominent features who did and did not survive the 36-mo period.
Performance Values of Predictive Models Evaluated in MC Cross-Validation
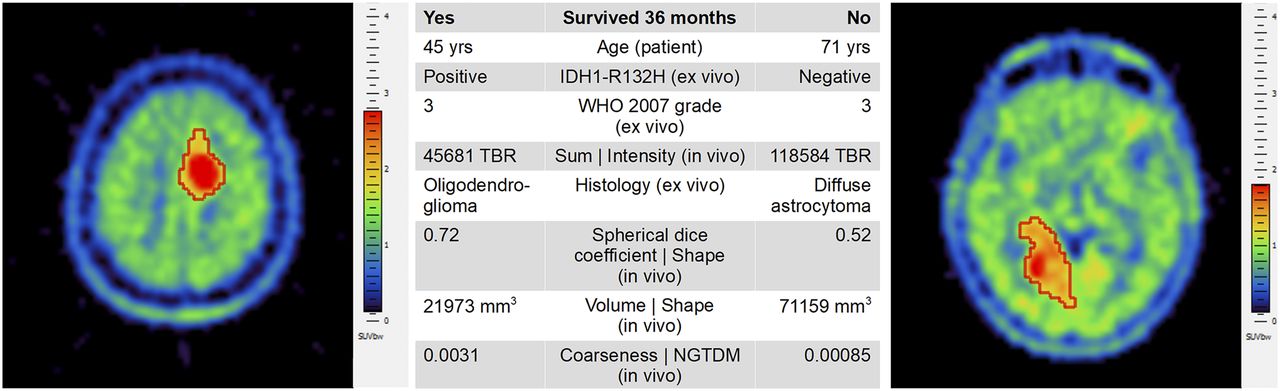
Comparison of 2 example patients who did (left) and did not (right) survive 36 mo from time of primary 11C-MET PET scan. Most prominent features as identified by our study are presented in center table. Although both patients had WHO 2007 grade 3 disease, remaining features varied considerably, thus indicating need for combined analysis of multiple features. Axial slices are from Hybrid 3D software visualized by standard spectral palette and with overlaid delineated VOIs (red boundary). NGTDM = neighborhood gray-tone difference matrix.
DISCUSSION
This study investigated the relevance of in vivo, ex vivo, and patient-related features in predicting 36-mo survival for glioma patients and determined the importance of selected features by ML. Although all features were selected at least once during the cross-training phase, the determined feature weights had a nonuniform distribution (Fig. 3 and Supplemental Figs. 1–3).
Across all investigated features, gray-level cooccurrence matrix features such as entropy (0.3%) and angular second moment (0.3), as well as intensity features such as maximum TBR (0.5%), appeared to have low importance in predicting 36-mo survival in patients with amino acid–positive gliomas. In contrast, patient age, IDH1 R132H mutational status, WHO 2007 grade, TBR sum, spheric dice coefficient, and volume and coarseness neighborhood gray-tone difference matrix appeared to be highly important for survival prediction. Our findings regarding TBR sum support previous reports that identified tumor amino acid metabolism as a prominent feature for survival prediction (5,29). In addition, we have shown that tumor-shape features such as volume and spheric dice coefficient further support the accuracy of survival prediction beyond patient and ex vivo values.
Overall, 16 predictive models, built on different combinations of binning configurations with ML-determined in vivo, ex vivo, and patient features, were validated in a MC cross-validation scheme. Our results indicate that the highest AUC (0.9) can be achieved with M36IEP. The second highest average AUC (0.87) was for M36EP. M36IP and M36I had an average AUC of 0.77 and 0.70, respectively (Table 3). All our combined M36IEP models resulted in a sensitivity and specificity of 86%–98% and 92%–95%, respectively. In contrast, when ex vivo features were excluded, sensitivity was in the range of 79%–84% and specificity decreased to 71%–76% (Table 3), thus indicating that ex vivo features support the identification of patients who are more likely to survive 36 mo. The inclusion of patient features appeared to support a higher sensitivity and specificity across all models.
A literature search demonstrated ML-based glioma predictors; however, these studies relied on MRI-based feature analysis (Table 4). The highest accuracy (96%) for a survival prediction model built on MRI, ex vivo, and patient features was reported by Zhang et al. (49). However, their study was based on a comparatively small patient cohort (n = 28) that included glioblastomas only. Moreover, they used contrast-enhanced T1-weighted MRI–based radiomic features at 3 different time points during the course of the disease. Nie et al. (50) reported 89% accuracy for their survival model across 69 patients, and the approach of Macyszyn et al. (51) resulted in 76% accuracy (105 patients). Again, both these studies involved only glioblastomas. Emblem et al. (52) established 6-mo, as well as 1-, 2-, and 3-y, survival models based on contrast-enhanced MRI features, tumor volume, and patient features for 235 glioma patients in a multicenter study. They reported 94% sensitivity, 38% specificity, and an AUC of 0.66 for their 36-mo survival model. The highest AUC (0.682) was provided by their 2-y survival model, with 78% sensitivity and 58% specificity.
Studies Correlating Glioma Survival with In Vivo, Ex Vivo, or Patient Features by ML Approaches
Our study differed from the above-cited works on multiple accounts: it included the diagnostic, pretherapeutic PET into a combined analysis of in vivo, ex vivo, and patient features. Furthermore, our cohort included not just glioblastoma but various types of glioma (Table 1). We specifically focused on using a statistically accurate resampling (35) to address small-sample–related uncertainties in textural parameters (22,23). Both the feature selection and the feature-weight estimation were ML-driven in a cross-training scheme to minimize the bias of our models. In addition, we compared 5 different binning configuration–based ML executions to investigate their effect on our performance values. Furthermore, the validation was performed by a MC cross-validation scheme with a high iteration to properly estimate the accuracy of our models. Our results outperform previously reported MRI-based results, thus indicating that amino acid PET may hold a prominent role in glioma survival prediction as an alternative or addition to MR-only imaging.
Nevertheless, our study was limited in several regards. Although IDH1 R132H mutational status—as one of the essential biomarkers in the 2016 update of the WHO glioma classification—was present, tumor typing was based on the older, 2007, WHO standard. Furthermore, because the in vivo feature extraction relied on PET-identifiable VOI analysis, only amino acid–positive gliomas could be investigated. Last, the current work was built on single-center studies; thus, the effect of acquisition and reconstruction variations on our in vivo features could not be evaluated (15). Looking ahead, a logical next step in identifying key features that correlate with glioma survival would be to extract features from multicenter PET/MR images. The proposed ML methods together with the predictive model are highly generic, as they do not consider any prior knowledge about the modalities or extracted features. Thus, evaluation of these ML methods for other cancers can be envisaged.
CONCLUSION
The results of the current study support the application of ML using in vivo, ex vivo, and patient features to predict survival in amino acid PET–positive glioma patients.
DISCLOSURE
Thomas Beyer is founder of cmi-experts GmbH. No other potential conflict of interest relevant to this article was reported.
Acknowledgments
We thank Peter Schaffarich for validating the integrity of the 11C-MET PET data by means of acquisition and reconstruction parameters.
Footnotes
Published online Nov. 24, 2017.
- © 2018 by the Society of Nuclear Medicine and Molecular Imaging.
REFERENCES
- Received for publication September 14, 2017.
- Accepted for publication October 31, 2017.


