


Abstract
In a secondary analysis of American College of Radiology Imaging Network (ACRIN) 6668/RTOG 0235, high pretreatment metabolic tumor volume (MTV) on 18F-FDG PET was found to be a poor prognostic factor for patients treated with chemoradiotherapy for locally advanced non–small cell lung cancer (NSCLC). Here we utilize the same dataset to explore whether heterogeneity metrics based on PET textural features can provide additional prognostic information. Methods: Patients with locally advanced NSCLC underwent 18F-FDG PET prior to treatment. A gradient-based segmentation tool was used to contour each patient’s primary tumor. MTV, maximum SUV, and 43 textural features were extracted for each tumor. To address overfitting and high collinearity among PET features, the least absolute shrinkage and selection operator (LASSO) method was applied to identify features that were independent predictors of overall survival (OS) after adjusting for MTV. Recursive binary partitioning in a conditional inference framework was utilized to identify optimal thresholds. Kaplan–Meier curves and log-rank testing were used to compare outcomes among patient groups. Results: Two hundred one patients met inclusion criteria. The LASSO procedure identified 1 textural feature (SumMean) as an independent predictor of OS. The optimal cutpoint for MTV was 93.3 cm3, and the optimal SumMean cutpoint for tumors above 93.3 cm3 was 0.018. This grouped patients into three categories: low tumor MTV (n = 155; median OS, 22.6 mo), high tumor MTV and high SumMean (n = 23; median OS, 20.0 mo), and high tumor MTV and low SumMean (n = 23; median OS, 6.2 mo; log-rank P < 0.001). Conclusion: We have described an appropriate methodology to evaluate the prognostic value of textural PET features in the context of established prognostic factors. We have also identified a promising feature that may have prognostic value in locally advanced NSCLC patients with large tumors who are treated with chemoradiotherapy. Validation studies are warranted.
PET imaging with 18F-FDG has an established role in the diagnosis and staging of non–small cell lung cancer (NSCLC) patients. Several groups have reported that uptake heterogeneity measures, primarily textural features (1), extracted from PET may provide clinically relevant prognostic information for patients with NSCLC of various stages (2–6). Those studies have generally been performed using limited single-institution datasets and heterogeneous patient populations. Additionally, many of those analyses have not addressed the statistical issues of multiple-hypothesis testing and correlations between textural features and established prognostic factors such as tumor burden.
American College of Radiology Imaging Network (ACRIN) 6668/Radiation Therapy Oncology Group (RTOG) 0235 was a prospective, multiinstitutional trial performed to evaluate the prognostic value of pre- and posttreatment 18F-FDG PET for patients with stage III and medically inoperable stage IIB NSCLC treated with definitive chemoradiotherapy (7). In a secondary analysis using the ACRIN 6668/RTOG 0235 dataset, we identified pretreatment metabolic tumor volume (MTV) as a predictor of locoregional disease control and overall survival (OS) (8).
In this study, we characterize textural PET features using pretreatment images acquired in ACRIN 6668/RTOG 0235 and evaluate correlations among these metrics and MTV. We also describe and implement a robust statistical approach to identify metrics that may provide valuable prognostic information beyond traditional prognostic factors and MTV.
MATERIALS AND METHODS
Study Design
Patients provided study-specific, Institutional Review Board–approved, written informed consent before registration for ACRIN 6668/RTOG 0235. The study design has been described previously (7). Briefly, eligible patients had stage III NSCLC or inoperable stage IIB NSCLC, had a Zubrod performance status of 0–1, and were deemed candidates for definitive concurrent chemoradiotherapy. Treatment consisted of thoracic radiotherapy to a dose of at least 60 Gy with concurrent, platinum-based doublet chemotherapy. Adjuvant chemotherapy was allowed. All patients underwent 18F-FDG PET or PET/CT on an ACRIN-qualified scanner (9) before the initiation of chemoradiotherapy as well as 12–16 wk after completion of radiotherapy on the same scanner. The intended sample size was 250 participants, including at least 75 with stage IIB/IIIA and at least 75 with stage IIIB disease.
Image Analysis
All available pretreatment PET images were collected centrally and transferred to a commercially available software package (MIMvista Corp.). A single observer blinded to all clinical outcomes contoured the primary parenchymal lung tumors for each patient using a semiautomatic gradient-based contouring algorithm (“PET Edge”). Contours were verified by a second observer. The 2 observers also independently visually scored each primary tumor on PET using a 3-point scale (1, homogeneous; 2, moderately heterogeneous; and 3, markedly heterogeneous). Patients who had no visible hypermetabolic primary tumor, images that could not be processed, or no follow-up survival data were excluded from this analysis.
Textural feature extraction was performed from raw PET data and contour structure data using customized scripts generated in MATLAB (The MathWorks). Before textural feature extraction, images were quantized into 32 levels using a uniform approach, which appears to perform similarly to more complicated algorithms (10). Measures that were extracted included widely used global, gray level cooccurrence matrix; neighborhood gray-tone difference matrix; run-length matrix; and gray-level size-zone matrix features (11). These values were generated using cooccurrence matrices defined for 13 directions using a single matrix, as recommended by recent papers on this topic (3). Including MTV and SUVmax, a total of 45 features were derived for each tumor. Exploratory analyses were also performed using textural features extracted after quantizing images into 64 levels.
Statistical Analysis
Log transformations or multiplicative transformations were applied to the textural PET features as needed to address distributional skewness and range. Spearman rank correlations between all pairs of features were calculated and displayed via a heat map.
The clinical outcome of interest for this secondary analysis was OS, defined as the interval from study registration to death from any cause or patient censoring. To address overfitting and high collinearity among PET features, we used the least absolute shrinkage and selection operator (LASSO) method for feature selection (12). LASSO is a regularized regression technique, where when extended to the Cox model for time-to-event data (13), the usual partial likelihood is maximized but subject to the so-called L1 constraint of ∑|βj| ≤ s, where βj denotes the individual parameter coefficients from the Cox model. For large enough s, this is equivalent to the standard Cox model. However, as the value of s decreases, more and more of the parameter coefficients are shrunken to zero, with only the most relevant features remaining. The value of s (a tuning parameter) was chosen by 5-fold cross-validation, where MTV (an established predictor) was forced into all model iterations.
The PET feature selected by LASSO was then regressed in a multivariable Cox model that also included MTV and potentially confounding baseline clinical variables (age, sex, clinical stage, and performance status). On the basis of our previous analysis with this dataset, baseline performance status was included using a time-dependent coefficient. Statistical interaction between the selected PET textural feature and MTV was examined using multiplicative interaction terms. Model performance was evaluated using the C-statistic developed under the time-to-event framework (14), with both the original (i.e., sample) C-statistic being reported and the optimism-corrected C-statistic obtained through internal validation using the bootstrap method (15). A nomogram for the final Cox model was also developed. Finally, the utility of adding visual heterogeneity scores to the final model was evaluated using the likelihood ratio test.
In addition to the Cox modeling, we also used recursive binary partitioning in a conditional inference framework to identify optimal thresholds for both the MTV and the selected PET feature, as represented by a conditional inference tree (16). Kaplan–Meier curves were then generated for the patient groups identified based on the tree-defined cutpoints. Finally, PET images for 2 subjects with similar tumor MTV and SUVmax, but disparate textural analysis results, were shown as examples.
A P value threshold of 0.05 was used to declare statistical significance. Statistical analyses were performed using SAS 9.4 (SAS Institute) or R software (version 3.1.0; R project, http://www.r-project.org).
RESULTS
Patient Characteristics
Of the 250 patients enrolled on ACRIN 6668/RTOG 0235, 16 were found to be ineligible. Two hundred one of the remaining 234 subjects (86%) were included in the present analysis. Reasons for exclusion were missing imaging studies (n = 8), lack of a visible primary hypermetabolic tumor (n = 7), data corruption precluding textural feature extraction (n = 15), and missing survival data (n = 3). Characteristics of the patients included in this analysis are summarized in Table 1. Per the design of ACRIN 6668/RTOG 0235, a variety of PET scanners, reconstruction algorithms, and voxel sizes was used. Among the studies included in this analysis, there were 18 distinct voxel sizes. The smallest voxel size was 2.0 × 2.0 × 2.5 mm, and the largest was 5.5 × 5.5 × 3.3 mm. The most common voxel size was 4.0 × 4.0 × 4.0 mm (n = 29, 14%).
Patient Characteristics for All Eligible Participants and for Subset of Evaluable Participants
PET Features and Correlations
Median pretreatment tumor MTV was 26.8 cm3 (interquartile range [IQR], 9.9–79.4), and median pretreatment SUVmax was 13.2 (IQR, 9.5–18.4). Statistics describing the pretreatment textural PET features are summarized in the supplemental materials (available at http://jnm.snmjournals.org). A heat map depicting the absolute value of Spearman correlation coefficients between all pairs of textural PET features is shown in Figure 1. Correlation exceeded 0.7 for 36% of feature pairs and exceeded 0.9 for 13% of feature pairs. Many features were also highly correlated with MTV. Absolute Spearman correlation coefficients between MTV and 20 of the 44 (45%) other features exceeded 0.8.
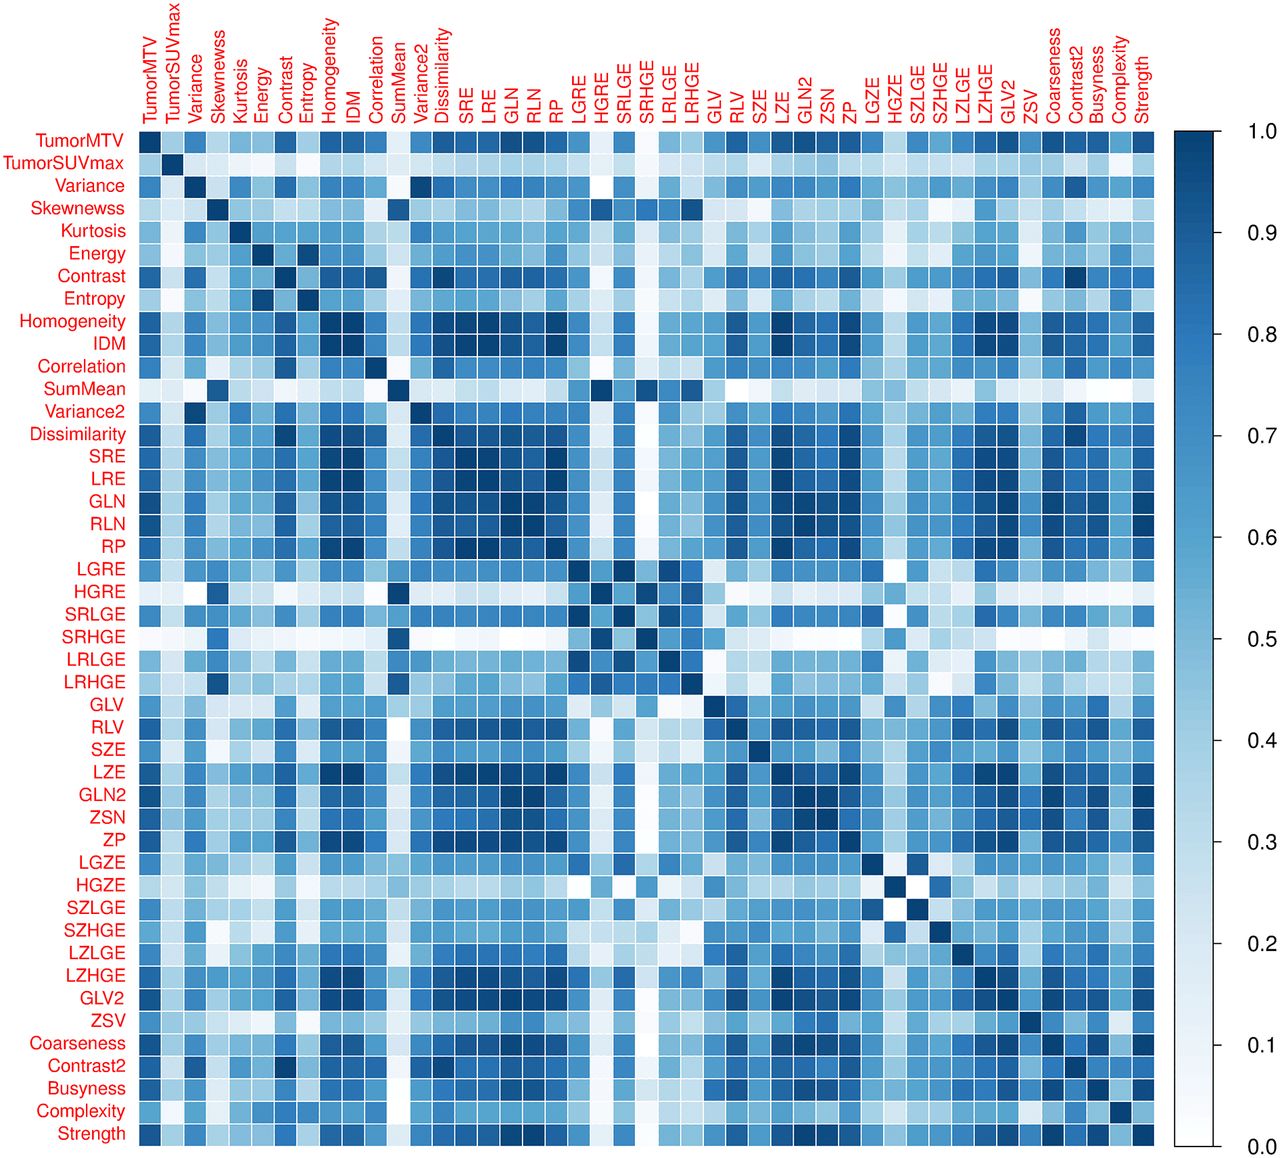
Heat map depicting absolute value of Spearman correlation coefficients between pairs of textural features. List of abbreviations is found in the supplemental materials.
Visual tumor heterogeneity scores between the 2 observers were identical in 97% of cases (κ coefficient, 0.94), so scores from the first observer are reported for simplicity. The visual heterogeneity score was highly associated with MTV. Median MTV was 10.0 cm3 (IQR, 4.8–17.5) for tumors classified as homogeneous, 44.9 cm3 (IQR, 28.1–93.3) for intermediate tumors, and 134.3 cm3 (IQR, 74.2–183.6) for heterogeneous tumors (P < 0.001 using Kruskal–Wallis test).
LASSO Analysis
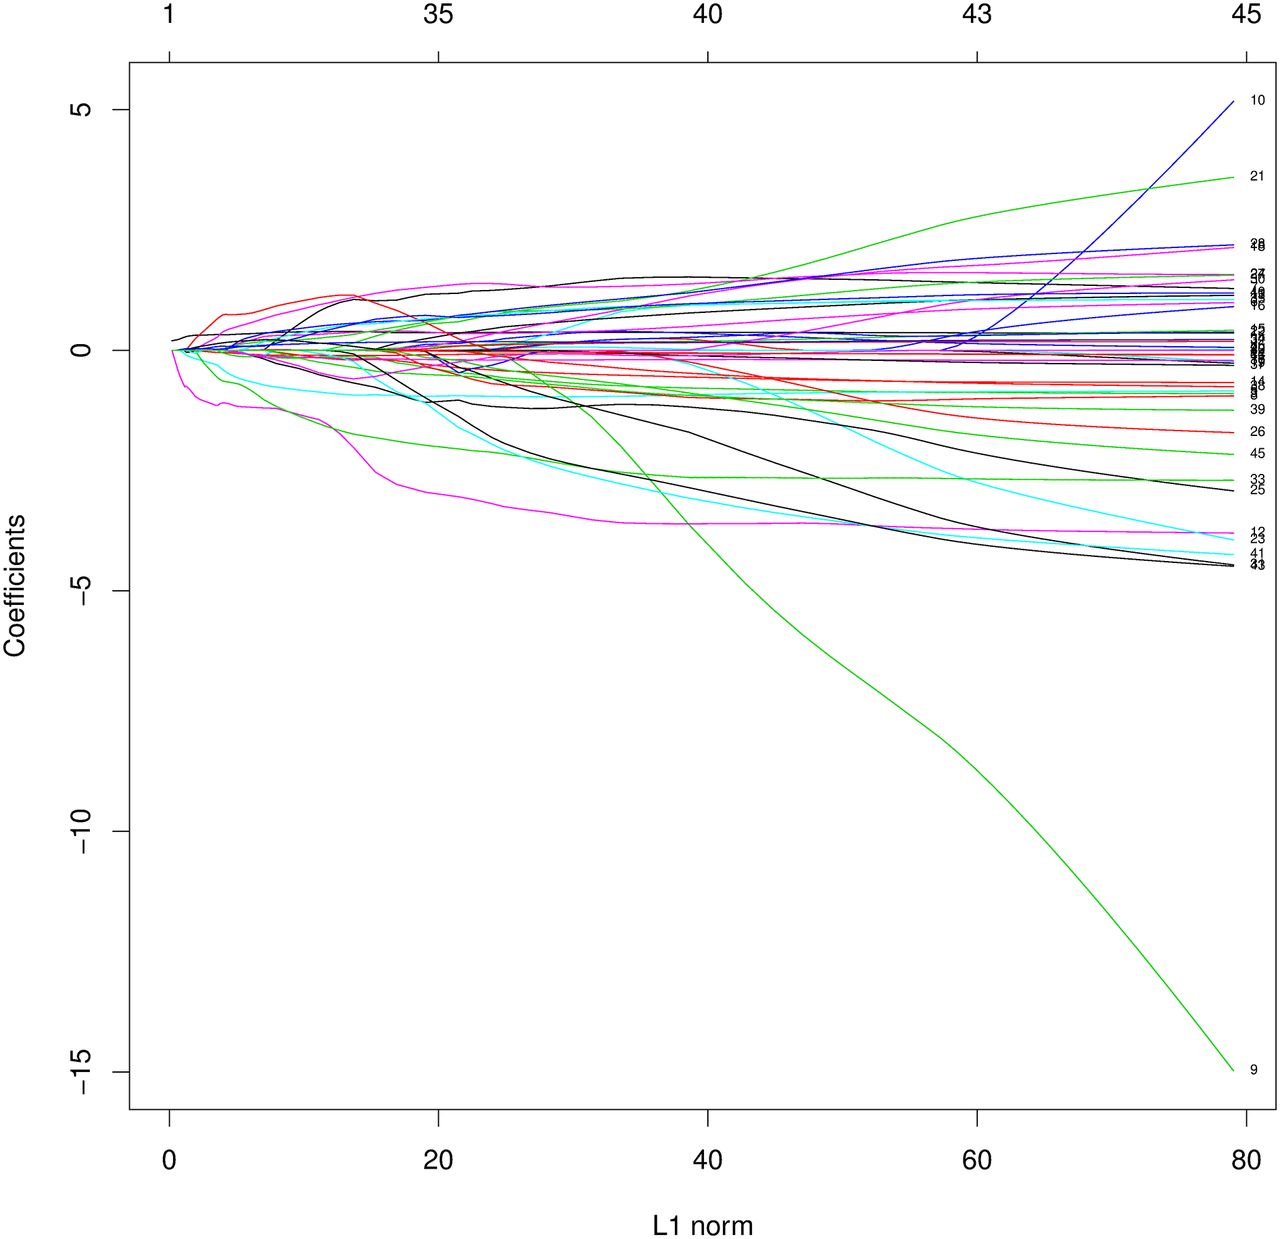
Application of the LASSO procedure yielded a final model with 2 predictors of OS. These were SumMean (LASSO coefficient, −0.30) and (by design) MTV (LASSO coefficient, 0.21). The selected PET textural feature of SumMean had low correlation with MTV (Spearman correlation, 0.15) and thus provides some degree of orthogonal information. Iterations of the LASSO procedure are depicted graphically in Figure 2, showing that the coefficients of many features diminish as the penalty increases (or alternatively as the value of the tuning parameter, s, decreases). At the value of the tuning parameter chosen by cross-validation, only feature 12 (SumMean) remained. Because of its established prognostic ability, MTV was forced into each model iteration.

LASSO model coefficients. PET textural features are numbered according to the supplemental materials (right edge of plot). x-axis (labeled L1 Norm) corresponds to ∑|βj|, or sum of absolute value of model coefficients. Plot shows profile of coefficient of each feature as L1 Norm is constrained to be less than or equal to range of decreasing values of tuning parameter, s.
A multivariable Cox proportional hazards model that includes baseline clinical variables and both MTV and SumMean is shown in Table 2. Addition of a term defined as MTV × SumMean revealed evidence of statistical interaction between the 2 PET metrics as predictors of OS (interaction term P = 0.02), prompting additional exploration of optimal cutpoints for these variables using conditional inference trees. The addition of visual heterogeneity scores to this model did not meaningfully improve its performance (likelihood ratio test P = 0.98). After internal validation via bootstrap, the optimism-corrected C-statistic for the final model presented in Table 2 was 0.63 (95% confidence interval, 0.59–0.67) (supplemental materials), demonstrating an optimism of 0.02 in the original C-statistic (0.65). A nomogram for the final Cox model presented in Table 2 can be found in the supplemental materials. There was an extremely high correlation (>0.999) between SumMean values extracted using 64 quantization levels and using 32 quantization levels, so statistical analyses were not repeated using 64 levels.
Multivariable Cox Proportional Hazards Regression Model for OS
Optimal Cutpoints
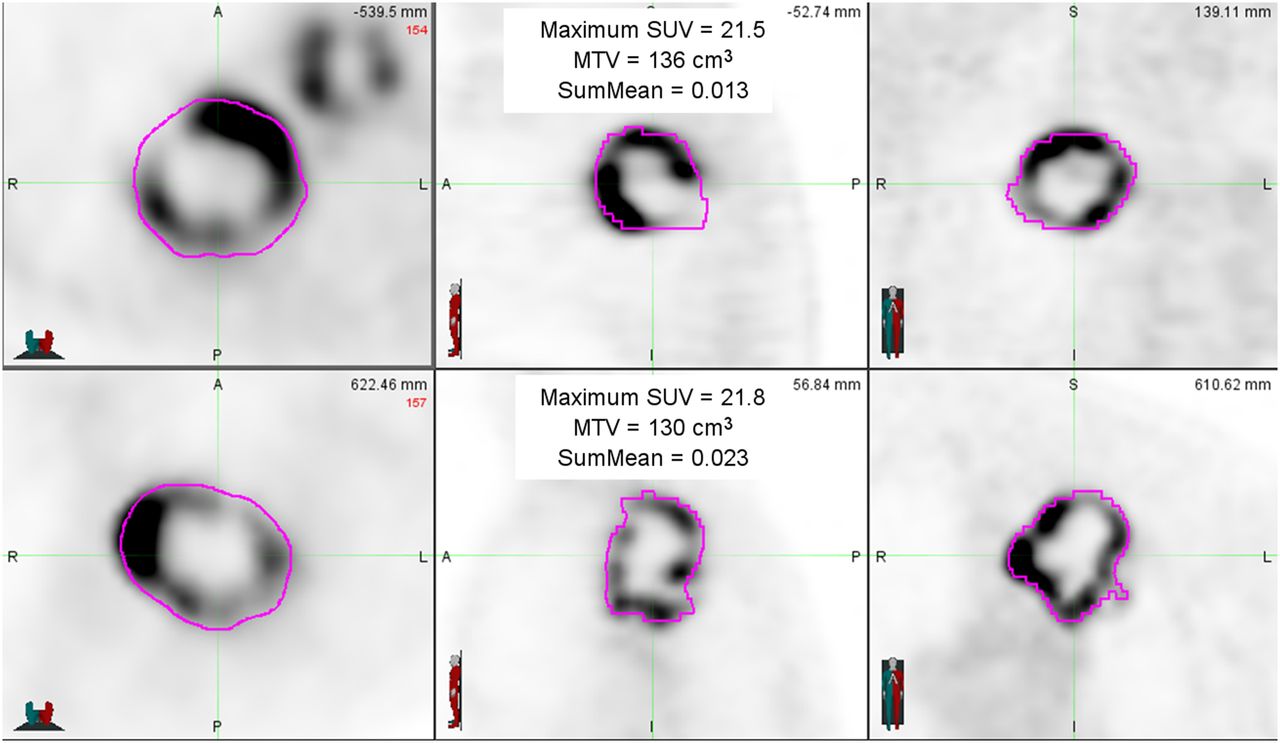
Separate exploration of MTV and SumMean yielded an optimal tumor MTV cutpoint of 93.3 cm3, but an optimal cutpoint for SumMean could not be identified. Consideration of both variables jointly yielded an optimal tumor MTV cutpoint of 93.3 cm3 (P = 0.004) and an optimal SumMean cutpoint of 0.018 (P = 0.006) that was applicable only to patients with large tumor MTV values (Fig. 3). These results suggest grouping patients as follows: low tumor MTV (≤93.3 cm3; n = 155), high tumor MTV (>93.3 cm3) and low SumMean (≤0.018; n = 23), and high tumor MTV (>93.3 cm3) and high SumMean (>0.018; n = 23). Kaplan–Meier curves depicting OS for these 3 groups are shown in Figure 3. Patients with high tumor MTV and low SumMean had significantly inferior OS (median, 6.2 mo) when compared with patients with high tumor MTV and high SumMean (median, 20.0 mo) or patients with low tumor MTV (median, 22.6 mo) (log-rank P < 0.001 across the 3 groups). Thirty-two of 46 tumors (70%) with high MTV were visually scored as heterogeneous, and a visual heterogeneity score was not associated with prognosis after adjusting for MTV and SumMean in this subgroup. Tumors from 2 patients with similar values for tumor MTV and SUVmax but disparate SumMean values are shown in Figure 4. We did not find any correlation between SumMean and PET voxel size in the high-MTV subgroup (R = −0.12, P = 0.423).
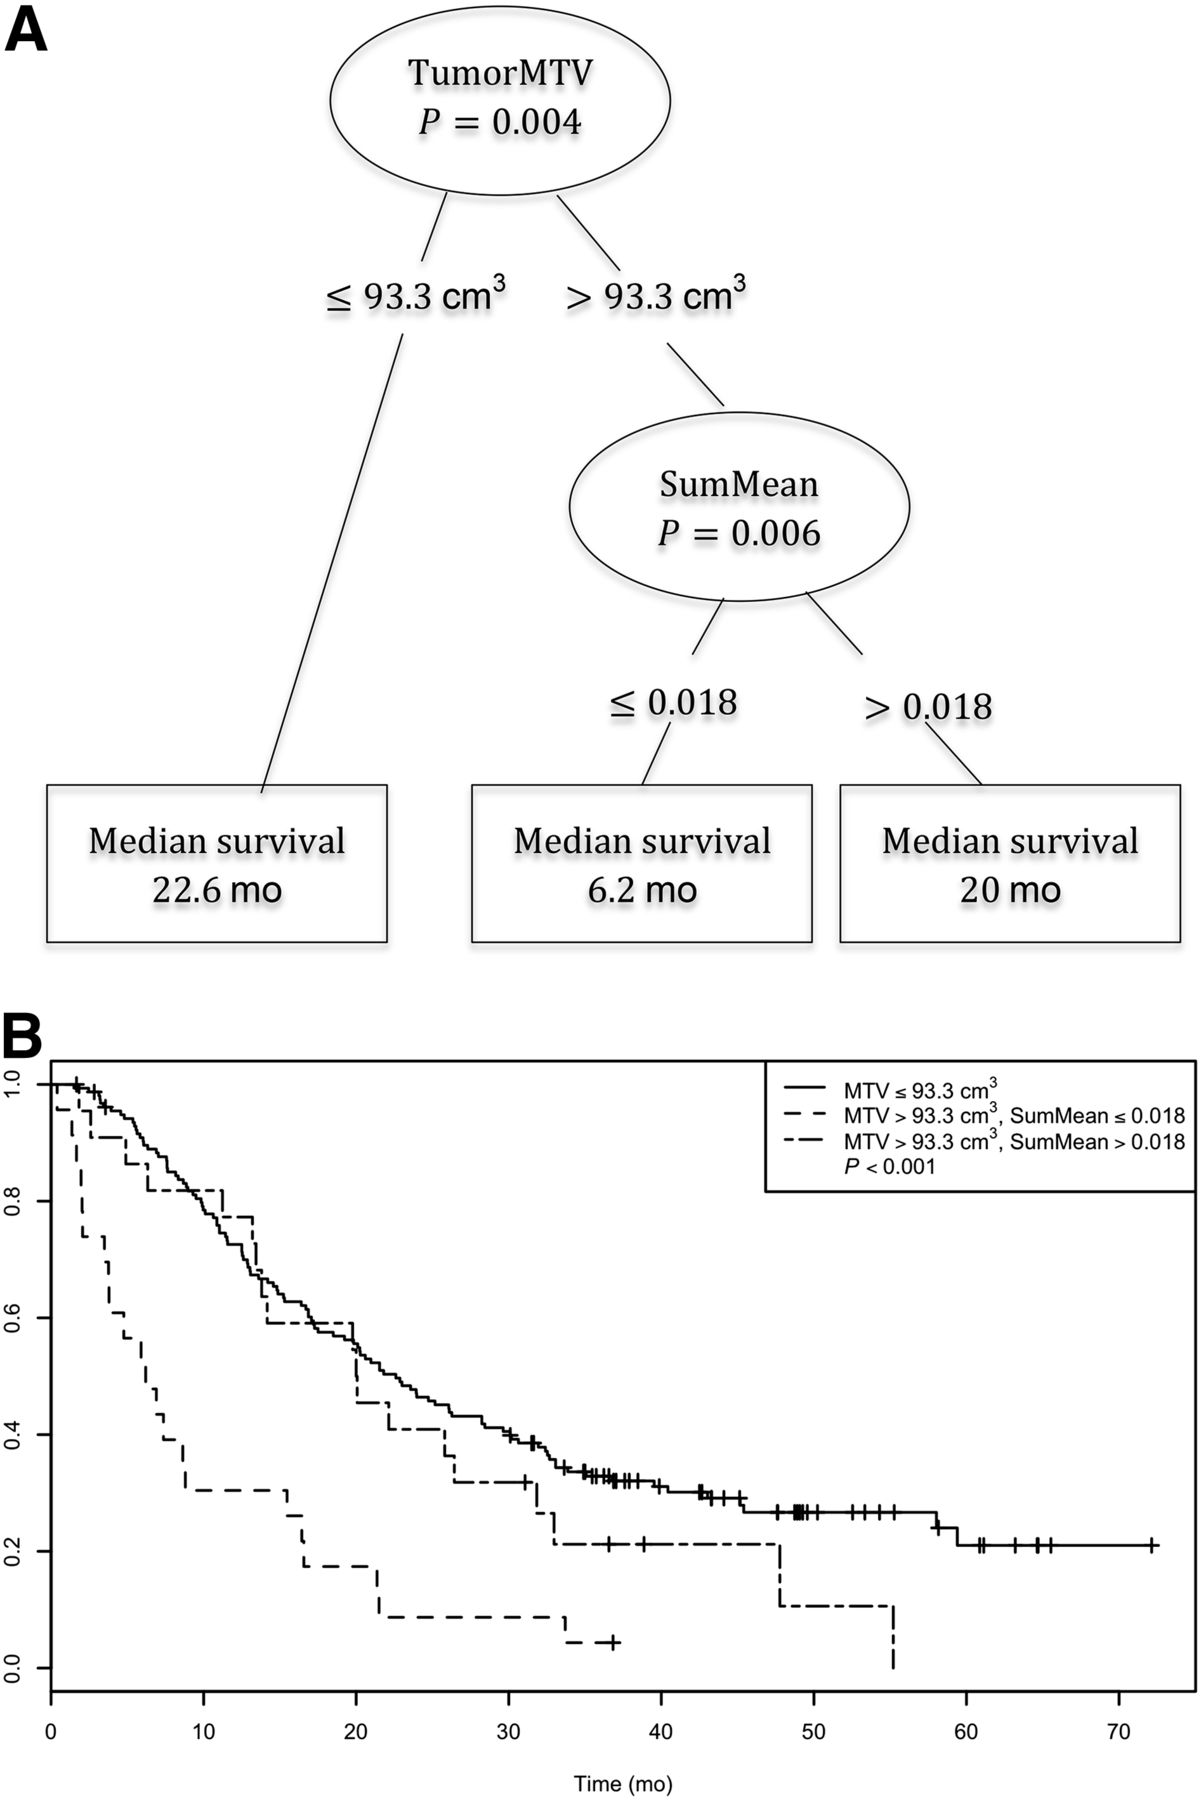
Conditional inference tree for combination of MTV and SumMean as predictors of OS (A) and corresponding Kaplan–Meier curves for OS for 3 groups resulting from tree-defined cutpoints (B).

PET images from 2 sample patients whose tumors had similar MTV and SUVmax and similar appearances but had disparate SumMean values. Both tumors were scored as markedly heterogeneous based on visual examination. Survival time for patient in top panels was 15.5 mo, compared with 47.8 mo for patient in bottom panels.
DISCUSSION
In this analysis, we have identified an 18F-FDG PET textural feature (SumMean) that appears to be prognostic for OS among locally advanced NSCLC patients with large tumors who were treated with definitive chemoradiotherapy. This is, to our knowledge, the largest study examining textural PET features in NSCLC and the first performed using data from a prospective multiinstitutional trial. The methodology we used to address issues of collinearity and interactions between candidate prognostic variables may be replicated in other datasets and in other patient populations to clarify the significance of textural imaging features.
Methodologic issues in studying textural features as prognostic factors have been described previously (17–19). An analysis of nearly 200 breast, colon, and NSCLC lesions examined the relationships between various PET metrics as well as the robustness of textural features with respect to segmentation technique and resampling technique (20). Investigators found that at least 32 discrete values should be used in resampling to provide textural feature values that are relatively robust with respect to segmentation technique. As in the present study, they found strong correlations between many pairs of textural features and suggested that the performance of textural features must be evaluated in multivariable models that adjust for tumor stage or MTV. We agree that this is a critical step in any analysis of textural features.
We submit that the LASSO method with cross-validation, used in this report, is an elegant way to address issues of overfitting, collinearity, and multiple-hypothesis testing (21) in feature selection. A pitfall of uncritically combining highly correlated features in a multivariate model is illustrated in the LASSO coefficient profile plot in Figure 2. For a large enough value of s (the right side of the plot), coefficients correspond to those of the standard Cox model, from which the largest coefficients (in absolute value) are features 9 and 10 (homogeneity and inverse difference moment, respectively). However, although these features are highly correlated (Spearman correlation, 0.998), and thus one would expect common effects, their coefficients are in opposite directions, 1 highly negative and 1 highly positive. Such instability in parameter estimates is not uncommon in the presence of extreme multicollinearity. We recognize that a relatively large dataset is required to use the LASSO approach, and that all results, including ours, require validation in a separate cohort.
Unlike most previous studies on this topic, we used a multiinstitutional dataset with imaging studies that were acquired using a range of scanner manufacturers, resolution settings, and reconstruction algorithms. This is notable, because textural features can be highly dependent on reconstruction scheme and imaging parameters (22,23). The fact that SumMean was strongly associated with OS in this multiinstitutional dataset suggests that it may be robust with respect to these variables as a prognostic factor, and our results may prove to be more generalizable than findings from single-institution datasets. Resampling our PET data to a uniform voxel size might lead us to identify different textural features as predictors of survival. This will be examined in future analyses.
SumMean is an indicator of homogeneity (24) that has been used frequently in image segmentation applications to separate tumors from surrounding tissues (25). Our findings suggest that NSCLC patients with large primary tumors with low SumMean (more heterogeneous) have a poor prognosis after chemoradiotherapy.
Several groups have previously studied the prognostic utility of textural PET features in NSCLC. Cook et al. analyzed pretreatment PET features from 53 NSCLC patients who were treated with chemoradiotherapy (2). They identified several textural features that were highly correlated with radiographic response rates at 12 wk and also found associations between several features and clinical outcomes. They found that low coarseness was associated with improved OS. MTV and total lesion glycolysis were excluded from their multivariable OS model based on their model-building procedure. In the present analysis, we found that MTV and coarseness were highly correlated (Spearman ρ, −0.92), making it unlikely that coarseness will provide additional prognostic information in this setting.
Pyka et al. recently reported on the significance of textural PET features in 45 patients who were treated with stereotactic body radiotherapy for early-stage NSCLC (26). Seven local recurrences occurred among the 30 patients with T2 (>3 cm) tumors, and no local recurrences were seen in patients with smaller tumors. Among patients with T2 disease, the features entropy and correlation were associated with local recurrence. Further examination of these associations is warranted but will require a large dataset, because local tumor recurrence after high-dose stereotactic body radiotherapy for early-stage NSCLC is relatively rare (27).
In a multiinstitutional analysis that included 101 patients with stage I–III NSCLC, disease stage, MTV, and tumor PET heterogeneity were deemed to provide complementary prognostic information with regards to OS (3). The authors noted that the correlations between textural features and MTV decreased with increasing MTV and suggested that the prognostic value of textural features may be more pronounced in relatively large tumors. Findings in the present study support that hypothesis.
Tixier et al. have previously demonstrated that several NSCLC tumor textural features are highly correlated with visual assessment of heterogeneity (4). As they noted, textural feature classification has potential advantages over visual assessment because it is quantitative and objective, and some textural features cannot be assessed visually. Our results strengthen the case for quantitative textural feature classification, because we have demonstrated that visual assessment is highly associated with MTV, and most large tumors appear heterogeneous. We did not find that visual scores provided prognostic information after adjusting for MTV.
A recent single-institution analysis identified several textural features that were associated with OS in a cohort of stage III NSCLC patients who were treated with definitive radiotherapy (28). Strengths of this study include a large sample size and the inclusion of disease volume in survival models as an established prognostic factor. Predictors of survival identified in that analysis included energy, which was calculated using 2-dimensional cooccurrence matrices, and solidity, which describes the spatial distribution of hypermetabolic lesions within a patient rather than textural features of a single lesion. We have not been able to examine solidity in the present study because of the workflow we used, in which only PET slices that included the primary tumor were exported for textural analysis.
This analysis was performed using the same gradient-based contouring algorithm that we previously used to establish MTV as a prognostic factor in this dataset. Other analyses on this topic have used fixed SUV thresholds (26) or percentage thresholds for tumor delineation, with or without adjustments to include regions of central photopenia (20). We have previously shown that the gradient-based contouring technique yields volumes that are similar to thresholding techniques for small lesions (29). For larger lesions that are more likely to contain regions of photopenia, tumor volumes and textural metrics may be affected significantly by the choice of tumor segmentation technique.
A common conclusion from this and other papers exploring the prognostic value of imaging textural features is that validation studies using additional datasets are required. Because analyses should be stratified by disease stage and treatment, and given the statistical issues of multicollinearity, interactions, and multiple-hypothesis testing, large multiinstitutional datasets are needed. These may be formed in cooperative group studies such as the ongoing RTOG 1106/ACRIN 6697 trial (NCT01507428) or through collaborative initiatives such as the Quantitative Imaging Network (30). As these larger datasets become available and the statistical issues in this arena are recognized, we expect that textural imaging features will receive additional attention and be established as important prognostic factors in a variety of malignancies.
Establishing the prognostic value of PET features for locally advanced NSCLC patients who are treated with definitive chemoradiotherapy would have important clinical implications. Although the addition of surgical resection after chemoradiotherapy (31) and radiotherapy dose escalation (32) have generally not been shown to improve outcomes in locally advanced NSCLC, the subset of patients with large tumors that are unlikely to be controlled with standard chemoradiotherapy might benefit from intensified local therapy. Early incorporation of targeted therapy or immunomodulatory agents should also be explored in this patient population.
CONCLUSION
Using data from a large cooperative group study, we have described an appropriate methodology to evaluate the prognostic value of 18F-FDG PET textural features in the context of established prognostic factors. We have also identified a promising feature that may have prognostic value in locally advanced NSCLC patients with large tumors who are treated with chemoradiotherapy. Additional studies to validate these findings are needed.
DISCLOSURE
The costs of publication of this article were defrayed in part by the payment of page charges. Therefore, and solely to indicate this fact, this article is hereby marked “advertisement” in accordance with 18 USC section 1734. This work was supported in part by a Radiological Society of North America Research & Education Foundation Resident Grant and by the American College of Radiology Imaging Network (now the Eastern Cooperative Oncology Group-American College of Radiology Imaging Network Cancer Research Group), which received funding from the National Cancer Institute through the grants U01 CA079778 and U01 CA080098. No other potential conflict of interest relevant to this article was reported.
Footnotes
Published online Feb. 11, 2016.
- © 2016 by the Society of Nuclear Medicine and Molecular Imaging, Inc.
REFERENCES
- Received for publication September 16, 2015.
- Accepted for publication January 13, 2016.


