


Abstract
Clinical and preclinical research with modulators at the N-methyl-d-aspartate (NMDA) receptor GluN2B N-terminal domain (NTD) aims for the treatment of various neurologic diseases. The interpretation of the results is hampered by the lack of a suitable NMDA PET tracer for assessing the receptor occupancy of potential drugs. We have developed 11C-Me-NB1 as a PET tracer for imaging GluN1/GluN2B-containing NMDA receptors and used it to investigate in rats the dose-dependent receptor occupancy of eliprodil, a GluN2B NTD modulator. Methods: 11C-Me-NB1 was synthesized and characterized by in vitro displacement binding experiments with rat brain membranes, in vitro autoradiography, and blocking and displacement experiments by PET and PET kinetic modeling. Receptor occupancy by eliprodil was studied by PET with 11C-Me-NB1. Results: 11C-Me-NB1 was synthesized at 290 ± 90 GBq/μmol molar activity, 7.4 ± 1.9 GBq total activity at the end of synthesis (n = 17), and more than 99% radiochemical purity. 11C-Me-NB1 binding in rat brain was blocked in vitro and in vivo by the NTD modulators Ro-25-6981 and eliprodil. Half-maximal receptor occupancy by eliprodil occurred at 1.5 μg/kg. At 1 mg/kg of eliprodil, a dose with reported neuroprotective effects, more than 99.5% of binding sites were occupied. In vitro, 11C-Me-NB1 binding was independent of the σ-1 receptor (Sigma1R), and the Sigma1R agonist (+)-pentazocine did not compete for high-affinity binding. In vivo, a 2.5 mg/kg dose of (+)-pentazocine abolished 11C-Me-NB1–specific binding, indicating an indirect effect of Sigma1R on 11C-Me-NB1 binding. Conclusion: 11C-Me-NB1 is suitable for the in vivo imaging of NMDA GluN1/GluN2B receptors and the assessment of receptor occupancy by NTD modulators. GluN1/GluN2B NMDA receptors are fully occupied at neuroprotective doses of eliprodil. Furthermore, 11C-Me-NB1 enables imaging of GluN1/GluN2B NMDA receptor cross talk.
Pharmacologic modulation of N-methyl-d-aspartate (NMDA) receptors may become an efficient therapeutic strategy for the treatment of cerebral ischemia, Alzheimer disease, Huntington disease, Parkinson disease, depression, neuropathic pain, and schizophrenia (1). A functional NMDA receptor consists of 4 subunits of the 3 subfamilies GluN1, GluN2A–D, and GluN3A,B. Typically, 2 subunits are GluN1 and the other 2 are mainly from the GluN2 subfamily (1,2). The receptor is coactivated by glutamate and glycine or d-serine. Besides the agonist binding domains, the receptor offers additional sites for pharmacologic modulation (1,2). Ifenprodil, eliprodil, and Ro-25-6981 bind to the N-terminal domain (NTD) interface of 2 subunits with high selectivity for GluN1/GluN2B (NTD binding site) over GluN1/GluN2A (1,2). Despite promising in vitro results with NTD modulators, effective doses in preclinical studies were often higher than expected, and results from clinical trials did not meet the expectations (3,4). Ligand sharing between the NTD binding site and σ-receptors, and the direct or indirect control of NMDA receptor activity and localization by the σ-1 receptor (Sigma1R) and dopamine receptors, are among the discussed confounding factors (5,6).
In our efforts to develop a PET radioligand for imaging GluN1/GluN2B receptors, we developed 11C-Me-NB1 (Fig. 1). 11C-Me-NB1 is based on WMS-1405 (herein designated Me-NB1), an NTD binding site ligand derived from ifenprodil with improved metabolic stability, 5.4 nM affinity (Ki) to hGluN1/hGluN2B, and no modulatory effect at hGluN1/hGluN2A receptors. It has 33- and 100-fold selectivity for hGluN1/hGluN2B over human Sigma1R and σ-2 receptors (Sigma2R), respectively (7). Applying 11C-Me-NB1, we characterized the distribution pattern of NTD modulator binding sites in the rat brain and investigated their dose-dependent occupancy by eliprodil (Ki = 13 nM for hGluN1/hGluN2B; Ki = 132 and 634 nM for rat Sigma1R and Sigma2R, respectively) (8). Furthermore, we examined whether 11C-Me-NB1 PET can be used to investigate receptor cross talk involving GluN1/GluN2B receptors.

Radiosynthesis of 11C-Me-NB1. DMF = dimethylformamide.
MATERIALS AND METHODS
Radiolabeling and In Vitro Characterization
11C-Me-NB1 was produced by reacting 11C-CH3I with 3-(4-phenylbutyl)-2,3,4,5-tetrahydro-1H-3-benzazepine-1,7-diol (9) (Fig. 1). The log D was determined by the shake-flask method with 11C-Me-NB1 in n-octanol/phosphate-buffered saline, pH 7.4. Binding affinities were determined in competition binding assays with rat brain membranes (10–12). For autoradiography, horizontal brain slices of adult male wild-type mice and Wistar rats or Sigma1R knockout mice lacking the Sigma1R encoding genomic sequence except for the first 4 codons (13) were incubated with 11C-Me-NB1 alone or in combination.
Ex Vivo Biodistribution
Animal experiments were in accordance with the Swiss legislation on animal welfare and approved by the Veterinary Office of the Canton Zurich, Switzerland. Twelve conscious male Wistar rats (296–373 g) received, via the tail vein, a 2 mL/kg injection of eliprodil vehicle (5% glucose, 0.45% NaCl, 1 mM citric acid, pH 7) or a 2 mg/kg injection of eliprodil (1 mg/mL) and, 1 min later, 3.1–36.3 MBq (0.5–1.6 nmol/kg) of 11C-Me-NB1 in 250 μL of saline containing no more than 8% ethanol. The rats were sacrificed by decapitation under isoflurane anesthesia 15 min after tracer injection. Tissues were dissected and weighed, radioactivity was quantified, and SUVs were calculated (Supplemental Fig. 1; supplemental materials are available at http://jnm.snmjournals.org).
PET Experiments with an Input Function
Seven male Wistar rats (331–353 g) were scanned with simultaneous recording of the blood coincidences (14). In brief, anesthesia was initiated with 5% isoflurane 40–60 min before the start of the scan and maintained at 2.5%–5% isoflurane. An arteriovenous shunt was applied by cannulation of the tail artery and a lateral tail vein. The rat was transferred to the scanner bed (SuperArgus PET/CT scanner [Sedecal]; axial field of view, 4.8 cm; spatial resolution, 1.6–1.7 mm in full width at half maximum (15)), and the shunt was guided through a Twilite coincidence counter (Swisstrace) and a peristaltic pump (200–300 μL/min). The blood counter and PET scanner were started, and at time zero, 32–52 MBq (0.44–0.78 nmol/kg, 250–300 μL) of 11C-Me-NB1 were injected via a separate, cannulated tail vein. Data were acquired for 60 min, followed by a CT scan. The rats were euthanized under anesthesia immediately after the scan. Between 28 and 31 min before the start of the scan, the rats received either a 25 mg/kg intraperitoneal injection of ketamine in water (25 mg/mL; 3 rats) or water alone (1 mL/kg; 4 rats). Only 2 (with ketamine) and 3 (baseline) blood curves were available for analysis, because the arteriovenous shunt became clogged in 2 rats. The ratios of parent tracer to total radioactivity in plasma and homogenized brain were determined from additional rats. The plasma–to–whole-blood radioactivity ratio was 1.11.
PET Experiments Without an Input Function
Twenty-three Wistar rats (327–409 g) were scanned as described above but without an arteriovenous shunt. Anesthesia was induced 15–35 min before tracer injection. Test compounds in less than 1 mL of vehicle (Me-NB1, the same as eliprodil; (+)-pentazocine, 2:8 0.1 M HCl:lactated Ringer solution; Ro-25-6981, 1:1 polyethylene glycol 300:saline) were injected intravenously on the scanner bed under anesthesia at 1 min (Me-NB1, eliprodil, and (+)-pentazocine), 5 min (Ro-25-6981), or 20 min (haloperidol (16)) before 11C-Me-NB1. The injected doses of 11C-Me-NB1 were 20–89 MBq. The total doses were 0.4–3,000 nmol/kg (0.00013–1 mg/kg) for 11C-Me-NB1 and Me-NB1, 0.7–5,700 nmol/kg (0.00025–2 mg/kg) for eliprodil, 16.4 μmol/kg (7.5 mg/kg, free base) for Ro-25-6981, 346 nmol/kg (0.13 mg/kg) for haloperidol (Haldol; Janssen-Cilag), and 8.8 μmol/kg (2.5 mg/kg) for (+)-pentazocine. For baseline scans, the respective vehicle was injected. In a displacement experiment, eliprodil, 1 mg/kg, in 450 μL of vehicle was injected into the tail vein 20 min after the start of the scan.
PET Data Reconstruction and Analysis
PET data were reconstructed as described in Supplemental Figure 1. Images and time–activity curves were generated with PMOD, version 3.7 (PMOD Technologies), with predefined regions of interest, modified from the PMOD template (Supplemental Fig. 1). Scans with an input function were analyzed with Matlab (MathWorks) by compartmental modeling (14,17). In brief, the clearance parameter of tracer transfer from plasma to brain (K1), the rate constants of transfer out of the brain (k2), receptor binding (k3), and dissociation from the receptor (k4), as well as the K1 and k2 of the radiometabolite (K1M, k2M), were fitted for whole brain for the full scan duration, and the respective volume of distribution (V) of total tracer (VT,fit = K1/k2 × (1 + k3/k4)), the V of specifically bound tracer (VS = K1/k2 × k3/k4), the V of nondisplaceable tracer (VND = K1/k2), the V ratio VT/VND (DVR), and the nondisplaceable binding potential (BPND = k3/k4 = DVR-1) were calculated (17,18). VT was also determined from the Logan plot (VT,Logan) (17,19). Blood coincidence start time and background, and a biexponential function describing the ratio of parent to total radioactivity in plasma, were fitted together with the rate constants. The results were confirmed with the PKIN module of PMOD, version 3.9. For the fits of the individual brain regions and truncated scan durations, only K1 to k4 were fitted; all other parameters were used as fitted for whole brain.
For quantification without an input function, SUV was averaged from 0 to 60 min (SUV0–60min). For the receptor occupancy study, SUV0–60min was fitted with the function in Equation 1. Eq. 1
Eq. 1
SUV0–60min,min and SUV0–60min,max are the plateaus, and d is the sum of the eliprodil and the 11C-Me-NB1 and Me-NB1 doses, with the latter multiplied by a weighting factor f. The fitted parameters were dose at half maximal receptor occupancy (D50), f, SUV0–60min,min, and SUV0–60min,max. Receptor occupancy (d/(D50 + d)) was calculated by rearranging Equation 1. Percentage specific binding was calculated as (SUV0–60min,max − SUV0–60min,min)/SUV0–60min,max × 100%.
Statistical Analysis
Mean values are shown with SD and compared by a homoscedastic, 2-tailed Student t test (without correction for multiple comparisons). The Akaike information criterion, corrected for finite sample size, was calculated according to a previously published method (20).
RESULTS
Tracer Radiosynthesis and In Vitro Characterization
11C was radiolabeled by reacting the phenolic precursor with 11C-MeI to afford 11C-Me-NB1 (Fig. 1) in 290 ± 90 GBq/μmol molar activity and 7.4 ± 1.9 GBq total activity at the end of synthesis (n = 17). Radiochemical purity was more than 99%. Total synthesis time from end of bombardment was 35–40 min. Log D at pH 7.4 was 1.4 ± 0.2 (n = 3). In the in vitro competition binding assay, Ro-25-6981 (7.2 nM affinity to the human NTD binding site; similar affinity to guinea pig Sigma1R and Sigma2R (21,22)) competed with the binding of both 3H-ifenprodil and the SigmaR1 agonist (+)-3H-pentazocine with 2-digit nanomolar Ki (Supplemental Table 1). Haloperidol, an antagonist for D2, D3, and D4 receptors and an inverse agonist of Sigma1R (7,23), competed in the micromolar range with 3H-ifenprodil (20°C and 37°C) and (+)-3H-pentazocine (20°C) but with 2-digit nanomolar Ki with (+)-3H-pentazocine at 37°C. The Ki for the competition of eliprodil with 3H-ifenprodil was 48.5 ± 32.0 nM (20°C), in agreement with previous findings (4). Its competition with (+)-3H-pentazocine was weak (Ki ≥ 229 nM, 37°C). Me-NB1 bound with a Ki of 40.2 ± 2.8 nM in competition with 3H-ifenprodil but competed only weakly with (+)-3H-pentazocine (half-maximal inhibitory concentration > 4 μM, 37°C), confirming a high selectivity of Me-NB1 for the rat NTD binding site over rat Sigma1R.
11C-Me-NB1 Autoradiography and Biodistribution
In vitro autoradiography revealed binding of 11C-Me-NB1 throughout the brain. Binding was reduced by eliprodil (54 nM, 10 μM), Ro-25-6981 (100 μM), haloperidol (10 μM), or an excess of Me-NB1 (100 μM) but not by 1 mM glutamate (Supplemental Fig. 2). Specific binding was confirmed in ex vivo biodistribution experiments (Supplemental Fig. 3). Brain SUVs were 3.8 ± 1.2 for midbrain, 3.7 ± 1.0 for cortex, 2.8 ± 0.8 for cerebellum, and 2.7 ± 0.7 for olfactory bulb (n = 8). Eliprodil (2 mg/kg intravenously) reduced 11C-Me-NB1 accumulation in all brain regions. The relative reduction was highest for midbrain, brain stem, cortex, and striatum (all > 40% and significant) and lowest and not significant for hippocampus (31.9%) and cerebellum (34.5%). In peripheral tissues, accumulation was highest in adrenal glands (SUV, 10.3 ± 2.9; 52.9% specific). The SUV in blood was significantly (P = 0.002) higher under blocking conditions (0.300 ± 0.035) than under baseline conditions (0.194 ± 0.045).
11C-Me-NB1 PET and PET Kinetic Modeling
Figure 2 shows PET images under baseline and blocking conditions. Time–activity curves of 11C-Me-NB1 in various brain regions and after blocking and displacement with eliprodil are shown in Figure 2 and Supplemental Figure 4. Both blocking and displacement reduced the SUV, further confirming the specific and reversible binding of 11C-Me-NB1.
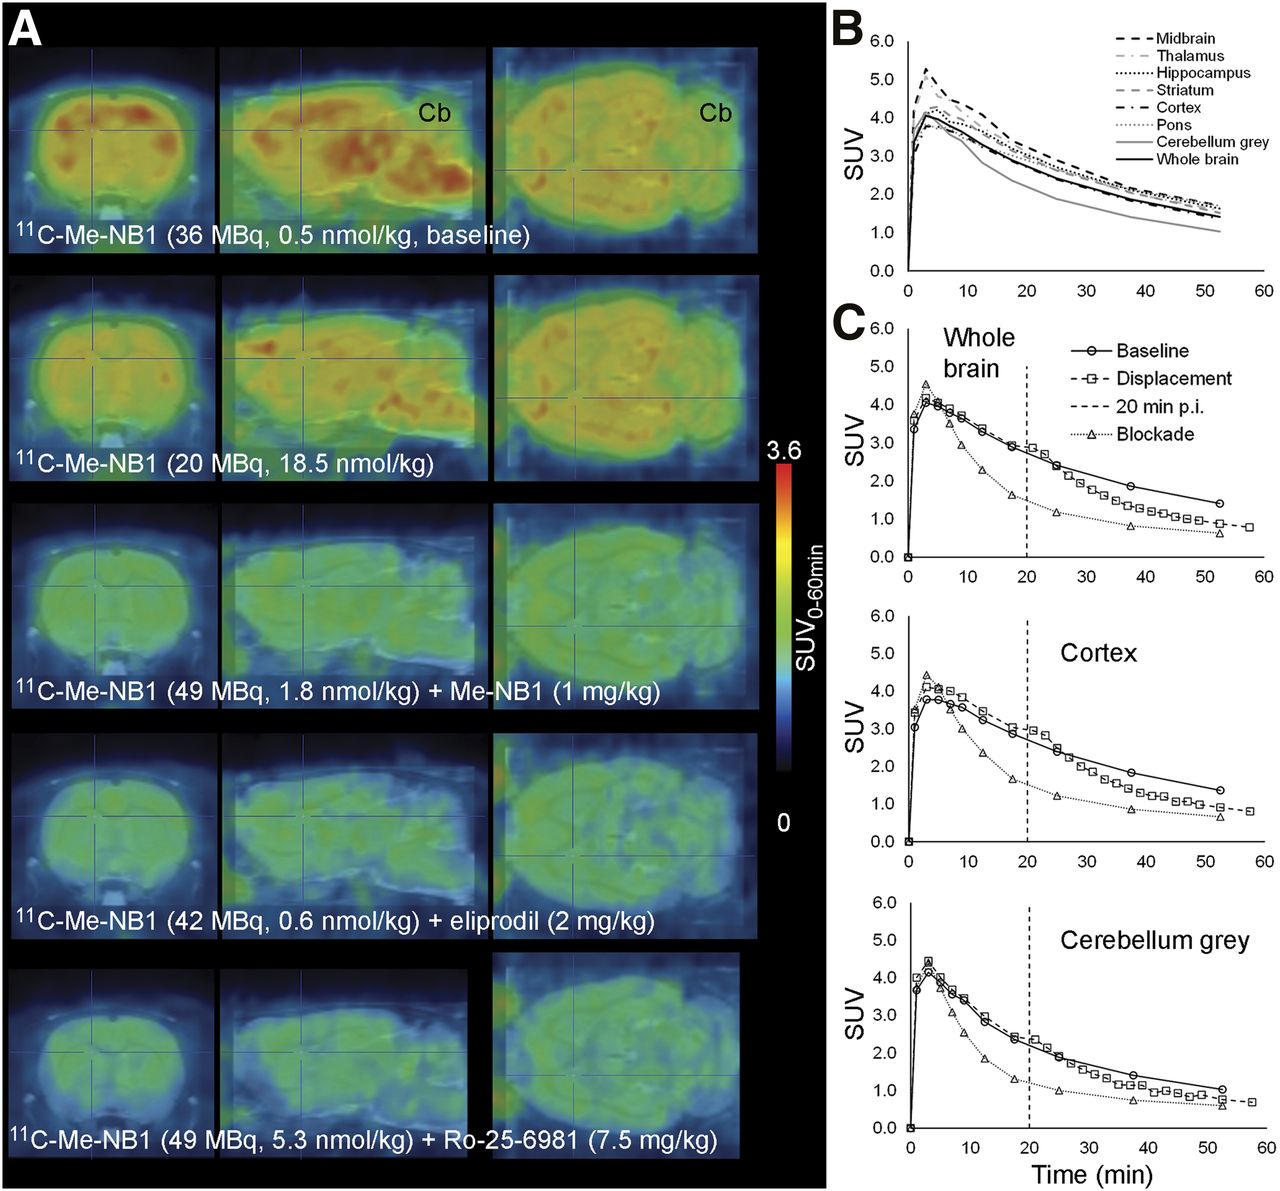
(A) Rat brain 11C-Me-NB1 PET images (0–60 min) superimposed on MRI template (PMOD). (B) Brain region time–activity curves of baseline scan (67 MBq, 2.1 nmol/kg, 394 g). (C) Time–activity curves under baseline conditions (as in B) or with 1 mg of intravenous eliprodil per kilogram 1 min before 11C-Me-NB1 (blockade: 35 MBq, 0.44 nmol/kg, 370 g) or 20 min after 11C-Me-NB1 injection (displacement: 55 MBq, 0.57 nmol/kg, 449 g). Vertical dashed line indicates time point of eliprodil intravenous injection for displacement. Cb = cerebellum.
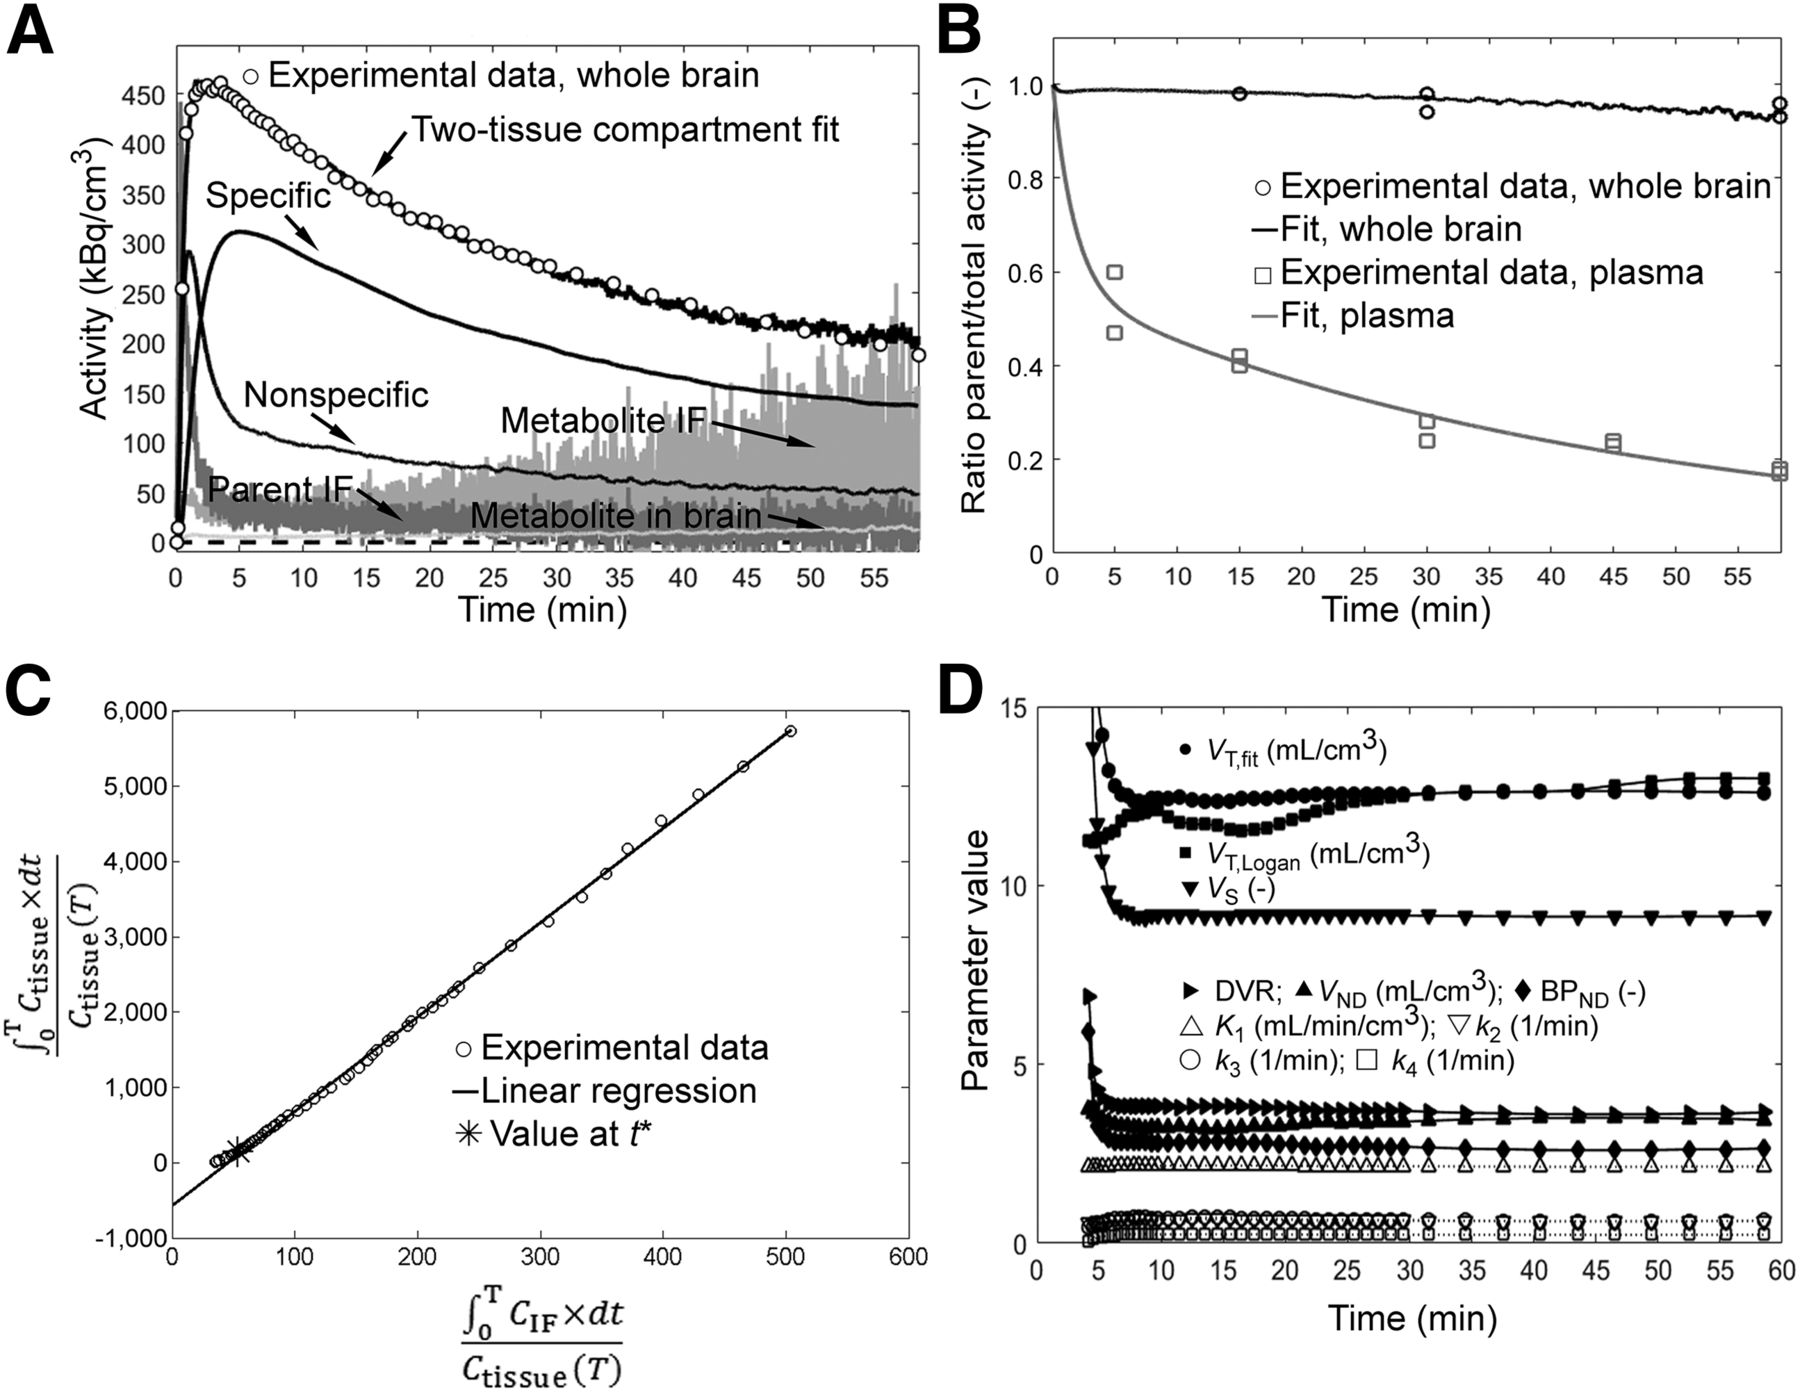
Data of 5 scans with an arterial blood time–activity curve were available, and brain time–activity curves were fitted to a 1- and 2-tissue-compartment model. The presence of a polar radiometabolite in plasma and up to 7% in brain (determined from brain homogenates) was considered for the analysis (Fig. 3). Fits with a 2-tissue-compartment model and the respective Logan plots are shown in Figure 3 (whole brain) and Supplemental Figures 5 and 6 (regions). Parametric maps for VT for the scan in Figure 2A are shown in Supplemental Figure 7. VT,fit and VT,Logan of 12 brain regions each for the 5 scans are depicted in Supplemental Figure 8. Supplemental Figure 9 shows the fit of the data in Figure 3 with a 1-tissue-compartment model and the residuals for both models. The Akaike information criterion favored the 2-tissue-compartment model. For all scans, VT,fit of whole brain remained within ±5% when the scan end time for data analysis was reduced to any time between 13 and 60 min (Fig. 3D). Ignoring radiometabolite distribution to the brain resulted in similar fit parameters. Supplemental Tables 2–4 show the fit parameters for whole brain on the individual scans. Averaged for the 5 scans and for whole brain, VT,fit was 11.8 ± 0.7; BPND, 3.77 ± 0.97; and VND, 2.57 ± 0.56. Average K1 was 2.9 ± 0.9 mL/cm3/min; k2, 1.2 ± 0.6 min−1; k3, 0.73 ± 0.09 min−1, and k4, 0.20 ± 0.04 min−1.

11C-Me-NB1 kinetic evaluation in rat whole brain for representative baseline scan (31.8 MBq, 0.44 nmol/kg, 321 g). (A) Whole-brain time–activity curve (○) and input functions (IF). Black lines indicate fit results, and 100 kBq/cm3 corresponds to ∼0.4 nM 11C-Me-NB1. VT,fit = 12.6 mL/cm3. (B) Experimental and fit ratios of parent tracer to total radioactivity in plasma and brain. Residuals from experimental time–activity curve and parent–to–total-radioactivity ratios were minimized simultaneously during fitting procedure. (C) Logan plot. Plasma and brain time–activity curves were corrected for the fitted parent-tracer–to–total-radioactivity ratios. VT,Logan = 12.5 mL/cm3. Linear regression of data is for t > 3 min. Ctissue = radioactivity in tissue (image data); CIF = radioactivity in arterial plasma; T = time points. (D) Fit parameters for scan durations of between 4 and 60 min.
PET Quantification Without an Arterial Input Function and Effect of Ketamine
Because a reference region without specific binding of 11C-Me-NB1 was not available for input-function independent analysis (17), SUV0–60min was evaluated as a surrogate for VT. The Pearson r2 for the linear correlation between SUV0–60min and VT,fit of 5 rats (12 brain regions) was 0.913 (Supplemental Fig. 8B). The transformed (according to the correlation) SUV0–60min of all 4 baseline scans and 3 scans after ketamine challenge agreed with VT,fit values (Supplemental Fig. 10). The subtherapeutic dose of ketamine was administered to investigate whether changes in glutamate levels affect 11C-Me-NB1 accumulation (24). Our results (VT and SUV0–60min) excluded a major influence of ketamine on 11C-Me-NB1 accumulation under isoflurane anesthesia (Supplemental Fig. 10; Supplemental Tables 3 and 4).
Receptor Occupancy by Eliprodil
Using 11C-Me-NB1, we determined the dose-dependent occupancy of the NTD binding sites by eliprodil. D50 was 4.2 nmol/kg (1.5 μg/kg) for whole brain (Fig. 4). The fit dose to reach 99% occupancy was 150 μg/kg. Specific binding was 46.9%. Fits for individual brain regions revealed D50 values of between 3.2 and 7.3 nmol/kg (Supplemental Fig. 11). Nondisplaceable tracer uptake had no effect on D50 (Supplemental Fig. 12). A Lassen plot analysis (25) revealed a D50 of 8.5 nmol/kg (Supplemental Fig. 13).

(A) Rat whole-brain NTD binding site occupancy by eliprodil. ○ = 11C-Me-NB1 with eliprodil; ● = 11C-Me-NB1/Me-NB1 alone. Receptor occupancy by 11C-Me-NB1 and Me-NB1 was included in saturation function. SUV0–60min was fitted to saturation function, and data were transformed to percentage receptor occupancy. Solid line indicates transformed fit. (B) Respective time–activity curves, with eliprodil doses indicated in mg/kg.
Imaging Receptor Cross Talk with 11C-Me-NB1
NMDA receptor activity is modulated by Sigma1R and dopamine receptors (6,26,27). We used (+)-pentazocine and haloperidol to modulate Sigma1R and dopamine receptors, respectively. Both (+)-pentazocine and haloperidol showed only weak competition with 3H-ifenprodil in the competition binding assays. (+)-pentazocine brain concentrations were aimed at 350–2,000 nM (28), and the dose of haloperidol corresponded to 10-fold the D50 in a D2 and D3 receptor occupancy study with 11C-raclopride in rats (16). At these concentrations, Sigma1Rs and D2 and D3 receptors, respectively, should be occupied, whereas no direct binding to GluN1/GluN2B receptors should occur. Both haloperidol and (+)-pentazocine abolished 11C-Me-NB1–specific binding under these conditions (Fig. 5A).
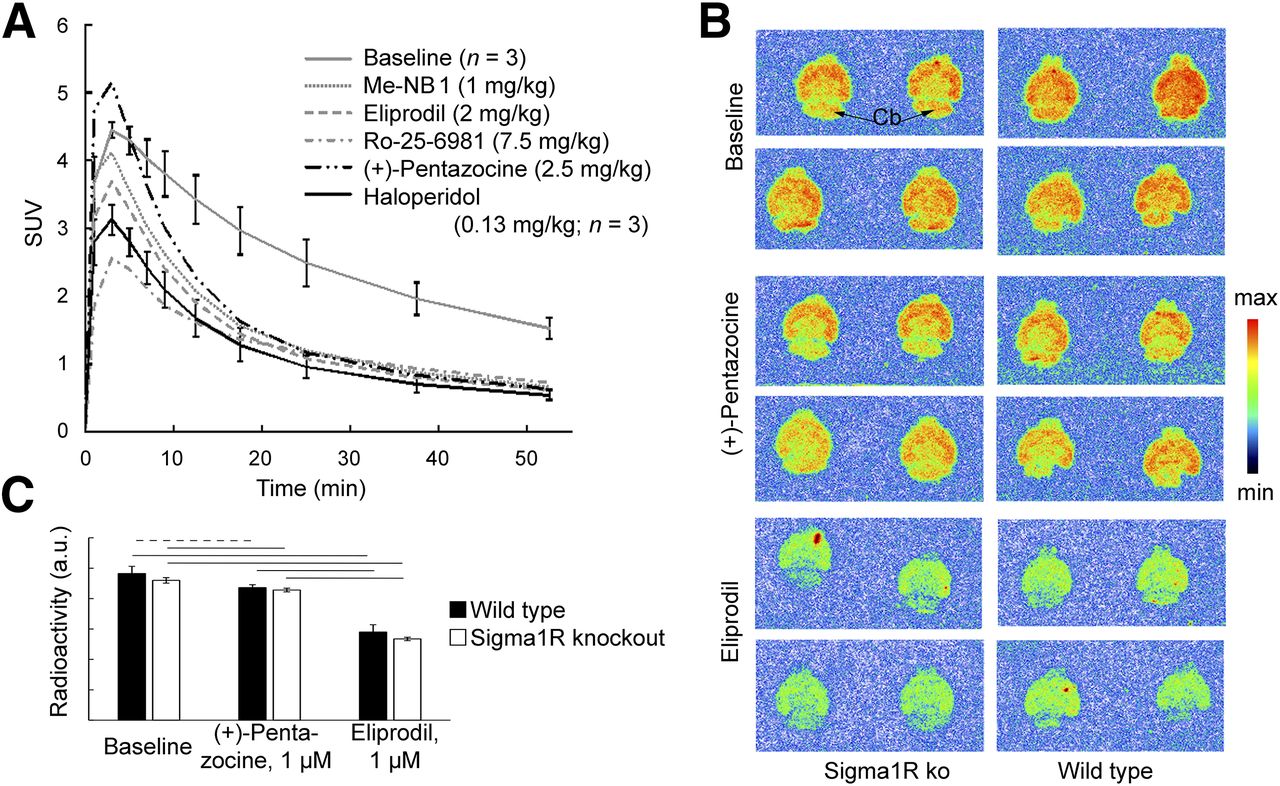
Influence of (+)-pentazocine and haloperidol on 11C-Me-NB1 PET in rat brain (A), and in vitro autoradiography with brain slices of S1R knockout (ko) mice (B and C). (A) Time–activity curves after drug administration and after blocking with Me-NB1, eliprodil, and Ro-25-6981 are shown. SUV within first few minutes may be affected by drug-induced changes in cerebral blood flow (46,47) and increased plasma levels under blocking conditions (Fig. 3). (B) 11C-Me-NB1 autoradiograms of brain slices from Sigma1R knockout and wild-type mice. Incubation was with 4.0 nM 11C-Me-NB1 alone (baseline) or together with (+)-pentazocine or eliprodil. (C) Quantitative analysis of autoradiograms in B. No significant difference was found between wild-type and Sigma1R knockout mice for any of the 3 conditions (P > 0.05). (+)-pentazocine (1 μM) reduced 11C-Me-NB1 binding in wild-type and Sigma1R knockout mice by <10%. Reduction by equal concentration of eliprodil was 40% and 42%, respectively (horizontal dashed line, P < 0.05; solid lines, P < 0.01). a.u. = arbitrary units.
To exclude both a direct competition between 11C-Me-NB1 and (+)-pentazocine binding, and high-affinity binding of 11C-Me-NB1 to Sigma1R, we performed in vitro autoradiography with brain slices from Sigma1R knockout mice (Figs. 5E and 5F and Supplemental Fig. 14). 11C-Me-NB1 binding did not differ between slices from wild-type and Sigma1R knockout mice, excluding significant binding of 11C-Me-NB1 to Sigma1R. (+)-pentazocine (1 μM) reduced the binding for both genotypes by less than 10% (P < 0.05), whereas the same concentration of eliprodil reduced the binding for both genotypes by 40% (P < 0.01), similar to the ex vivo biodistribution experiment and receptor occupancy study. Autoradiography at 3 different 11C-Me-NB1 concentrations revealed high-affinity binding in all brain regions of rat, mouse, and Sigma1R knockout mouse, including the GluN2B-free cerebellum, in agreement with the PET results.
DISCUSSION
To date, no clinically validated PET radioligand exists for the imaging of NMDA receptors. Reasons for failure include lack of in vivo specificity and selectivity, low affinity, poor metabolic stability, and poor distribution to the brain (29–34). Aiming to overcome the shortcomings of previously reported radioligands, and given the excellent in vitro properties of Me-NB1, we developed 11C-Me-NB1 for imaging GluN2B receptors. 11C-Me-NB1 was obtained in high radiochemical yields and molar activities. In vivo, it followed a 2-tissue-compartment model, with SUV0–60min as a useful surrogate for VT, but with the caveat of its inherent high variability (17).
11C-Me-NB1 binding faced competition from low doses of eliprodil in all brain regions, including midbrain, pons, and cerebellum with low GluN2B levels (35–38). Off-target binding to Sigma1R was excluded in vitro. The GluN2B-poor regions contain significant levels of GluN2D or GluN2C (36). 11C-Me-NB1 and eliprodil may bind to these or alternative GluN receptor subtypes in addition to GluN1/GluN2B receptors. The high specific binding of 11C-Me-NB1 in adrenal gland tissue, which contains GluN1, GluN2C, and GluN2D but not GluN2A or GluN2B (39), supports this hypothesis.
In preclinical studies, eliprodil had neuroprotective effects at 1 mg/kg (4,40,41). This corresponds to full (≥99.5%) receptor occupancy in our study. As discussed by Carter et al. (4), antidepressant and anticonvulsive effects observed at even higher doses may have resulted from lower-affinity binding to alternative targets.
The Sigma1R agonist (+)-pentazocine abolished 11C-Me-NB1–specific binding in the rat brain despite the lack of direct competition in vitro. (+)-pentazocine stabilizes the Sigma1R in its dimeric and monomeric forms, which interact with other proteins (23). Besides indirect effects on NMDA receptors, such as phosphorylation, a direct interaction between Sigma1R and the NTD of GluN1 that is involved in the interface with the GluN2B NTD was recently demonstrated (42). This interaction may directly hamper 11C-Me-NB1 binding. Alternatively, direct or indirect NMDA receptor modulation could bring the receptor to a conformation with reduced binding affinity for NTD ligands. Finally, altered receptor trafficking and cell-surface density could affect 11C-Me-NB1 accumulation.
Several mechanisms could result in the elimination of 11C-Me-NB1–specific binding observed with haloperidol. Activation of dopamine receptors modulates NMDA receptor–mediated Ca2+ currents, and treatment of rats with a 1 mg/kg dose of haloperidol altered the phosphorylation pattern of GluN1 and GluN2B (6,26,43,44). Haloperidol also modulates σ-receptors (7,45). We did not further investigate the molecular mechanisms. However, our data suggest that 11C-Me-NB1 PET could become a useful tool to visualize the consequences of receptor cross talk involving GluN2B-containing NMDA receptors.
CONCLUSION
We have successfully developed a PET tracer, 11C-Me-NB1, that allows noninvasive imaging of the density of NTD binding sites containing NMDA receptors. In the future, this development may allow the density of GluN2B/GluN1A receptors in neuronal diseases to be followed noninvasively and receptor occupancy under therapeutic intervention to be studied. Our receptor-occupancy study suggests that the published neuroprotective effects of eliprodil in rats required complete occupancy of the NTD binding sites. 11C-Me-NB1 PET is sensitive to drug-induced receptor cross talk.
DISCLOSURE
This work was financially supported by the Swiss National Science Foundation (SNSF, grant 160403). No other potential conflict of interest relevant to this article was reported.
Acknowledgments
We thank Bruno Mancosu for producing tracer and Jose Miguel Vela Hernandez for providing us with Sigma1R−/− and wild-type mouse brain tissues.
Footnotes
Published online Nov. 30, 2017.
- © 2018 by the Society of Nuclear Medicine and Molecular Imaging.
REFERENCES
- Received for publication August 4, 2017.
- Accepted for publication September 30, 2017.


Jump to section
Related Articles
Cited By...
- Hippocampal mGluR5 levels are comparable in Alzheimers and control brains, and divergently influenced by amyloid and tau in control brain
- Evaluation of (rac)-, (R)-, and (S)-18F-OF-NB1 for Imaging GluN2B Subunit-Containing N-Methyl-D-Aspartate Receptors in Nonhuman Primates
- First-in-Humans Brain PET Imaging of the GluN2B-Containing N-methyl-D-aspartate Receptor with (R)-11C-Me-NB1
- In vivo imaging of cannabinoid type 2 receptors, functional and structural alterations in mouse model of cerebral ischemia by PET and MRI
- Preclinical Development of 18F-OF-NB1 for Imaging GluN2B-Containing N-Methyl-D-Aspartate Receptors and Its Utility as a Biomarker for Amyotrophic Lateral Sclerosis
- Evaluation of 11C-NR2B-SMe and Its Enantiomers as PET Radioligands for Imaging the NR2B Subunit Within the NMDA Receptor Complex in Rats
- Classification of visual cortex plasticity phenotypes following treatment for amblyopia
- Preclinical Evaluation of Benzazepine-Based PET Radioligands (R)- and (S)-11C-Me-NB1 Reveals Distinct Enantiomeric Binding Patterns and a Tightrope Walk Between GluN2B- and {sigma}1-Receptor-Targeted PET Imaging
- Identification and Preclinical Evaluation of a Radiofluorinated Benzazepine Derivative for Imaging the GluN2B Subunit of the Ionotropic NMDA Receptor