


Abstract
PET with 11C-arachidonic acid (AA) can be used to quantify neural signaling related to phospholipase A2 (PLA2). Animal studies suggest reduction in the activity of this signaling system with age. The aim of this study was to evaluate the effect of healthy aging on brain incorporation of 11C-AA, before and after partial-volume correction (PVC). Methods: Absolute measurements of cerebral blood flow (CBF) were obtained in 8 young and 7 old healthy subjects (mean age ± SD, 27 ± 5 y and 65 ± 9 y) with bolus injection of 15O-water. About 15 min later, dynamic 60-min 3-dimensional scans were acquired after the injection of 11C-AA. Radioactivity frames of 11C-AA were corrected for head motion and registered to magnetic resonance (MR) images. A 3-segment (3S) and a 2-segment (2S) PVC was applied pixel-by-pixel to the activity frames. For the 3S method, the white matter value was estimated using a new automatic method by extrapolating the activity values of pixels with white matter membership > 0.99. Parametric images of the brain incorporation rate of 11C-AA (K*) and cerebral blood volume (Vb), as well as CBF, were generated and regional gray matter values were obtained. Results: Among cortical areas, there were no significant differences (uncorrected P < 0.05) in K* or Vb absolute values between young and old subjects before or after PVC. A significant reduction of CBF was detected in the frontal cortex of the elderly group. After normalization to the global gray average, K*, Vb, and CBF values revealed significant reductions in the frontal lobe of old subjects; none of these differences were significant after PVC. Conclusion: These results confirm previous PET findings that brain function at rest is minimally affected by healthy aging. Proper PVC methodology is of critical importance in accurate quantitative assessment of PET physiologic measures.
Arachidonic acid (AA) is an essential polyunsaturated fatty acid that acts as a second messenger in the phospholipase A2 (PLA2) neural signaling system. PLA2 is coupled to specific receptors, including muscarinic M1, M3, and M5; dopaminergic D2; serotonergic 5-HT1A and 5-HT2; and glutamatergic N-methyl-d-aspartate receptors (1–4). In the brain, AA is stored in neural membrane lipids, mostly in the second carbon atom (sn-2) of the glycerol moiety of phospholipids (5). As part of signal transduction, PLA2 hydrolyzes the sn-2 ester bond of membrane phospholipids, releasing AA into the cytoplasm. A sequence of signaling events is then initiated either directly by AA or indirectly by its metabolic products (6).
We have recently developed a method to quantify the incorporation of 11C-AA into human brain with PET (7). The kinetics of 11C-AA in the brain were described by an irreversible model with 2 parameters, the plasma-to- brain incorporation rate (K*) for 11C-AA and blood volume (Vb). Results in a group of young healthy subjects indicated that, despite a modest brain uptake of 11C-AA, this tracer could be used to quantify K* for AA (7), an index of neural signaling related to PLA2 (8).
Studies have indicated an age-related decline of the activity of the PLA2 AA signaling system. Reduced release of AA in response to muscarinic and serotonergic 5-HT1A and 5-HT2 receptors was reported in cortical areas of senescent rats (3). Thus, human studies with 11C-AA in healthy aging are of interest. In addition, we have shown (7) that the 11C-AA PET model provides physiologically reasonable estimates of Vb. PET studies have reported age-related reductions in Vb (9,10). However, due to age-related changes in brain morphology, the partial-volume effect has been shown to affect PET studies of cerebral blood flow (CBF) in aging (11).
Thus, the aim of this study was to evaluate the effect of aging on 11C-AA brain incorporation, CBV, and CBF in healthy human subjects. These comparisons were made with and without partial-volume correction (PVC).
MATERIALS AND METHODS
Subject Selection
Eight young (mean age ± SD, 27 ± 5 y; range, 20–36 y) and 7 old (mean age ± SD, 65 ± 9 y; range, 55–76 y) healthy male volunteers were studied under a clinical protocol approved by the Institutional Review Board of the National Institute on Neurologic Diseases and Stroke and the Radiation Safety Committee, National Institutes of Health. Each subject gave informed written consent after the purpose and risks of the study were explained. Exclusion criteria included a history of neuropsychiatric illness, head trauma, hypertension or other cardiovascular disorders, diabetes, malignancy, and psychopharmacologic treatment. All subjects were off medication for 2 wk, off aspirin for 2 d, and off caffeine and alcohol for at least 12 h before the PET scan.
MRI Procedure
Magnetic resonance (MR) images of the head were acquired with a 1.5-T Horizon (General Electric). T1-weighted volumetric spoiled gradient MR images (repetition time = 14 ms, echo time = 5.4 ms, flip angle = 20°) were acquired in a sagittal orientation (0.94 × 0.94 × 1.5 mm voxel size, 256 by 256 by 124 slices) and resliced to the transverse plane for all analyses.
Radiochemistry
11C-AA was synthesized as previously described (7). High-performance liquid chromatography analysis of the final product showed radiochemical purity of 98.6% ± 1.8% (n = 15).
PET Procedure
Each subject was scanned with a General Electric Advance tomograph. Scans were obtained parallel to the orbitomeatal line, while the subject’s head was held in place by a thermoplastic face mask. Scanning was conducted in a quiet, dim room, with the subject’s eyes open and ears unoccluded. A transmission scan was acquired to correct for attenuation. Then, CBF was measured by injecting 370 MBq (10 mCi) 15O-water as an intravenous bolus. A 60-s scan was acquired in 3-dimensional (3D) mode and quantitative CBF images were produced using the measured arterial input function (12). Approximately 15 min later, 902 ± 157 MBq (24.4 ± 4.3 mCi) of 11C-AA were infused intravenously for 3 min (Harvard Infusion Pump). Serial dynamic 3D scans (30 s to 5 min) were acquired over a 1-h period from the start of infusion.
Motion Correction
To correct for head motion during the 11C-AA scan, a 6-parameter rigid transformation was performed using the intramodality version of automated image registration (AIR) (13). Correction for head motion was performed starting from the first 3 min after injection with each image volume registered to the next image in the sequence. Images were thresholded to include pixels with values > 20% of the peak value in each frame. This limited the computation to extracerebral muscles, which have higher activity than the brain at all times. Images were resliced using a transformation matrix computed as the product of the matrices of each frame-to-frame registration. Motion of the ocular muscles before and after realignment was assessed by the sequential display of frames from a single slice at the level that best depicted muscle activity.
Modeling
Arterial blood samples were collected to measure whole blood, plasma, 11C-CO2, and 11C-AA concentrations (7). To separate 11C-AA from the remaining plasma activity, a previously validated (7) rapid extraction approach was used. On a pixel-by-pixel basis, the reconstructed images were analyzed with the following linear equation (7) to produce parametric images of K* and Vb:
 Eq. 1
Eq. 1
In Equation 1, Ci(t), Cb(t), and Cp(t) are the pixel, whole blood, and plasma 11C-AA time–activity curves; Cco2(t) is the predicted brain tissue concentration of 11C-CO2, and Δt is the delay between the brain and blood curves (7). Calculations were applied to the original radioactivity images and to the PVC images.
Under certain assumptions (Discussion), K* can be used to calculate the net flux of AA from plasma into brain (Jin, μmol/d/g) by multiplying by the unlabeled unesterified AA plasma concentration. Jin may be used to assess the rate of metabolic consumption of AA by brain (5), which may be of interest due to the proposed relationship between dietary intake of AA and cognitive function.
To quantify unesterified AA concentration in plasma, total lipids were extracted from 2 plasma samples (100 μL, 0 and 60 min) using a partition system of chloroform, methanol, and water (14). Unesterified heptadecanoic acid (17:0, 50 nmol/100 μL plasma) was added as an internal standard. Unesterified fatty acids, including AA, in total lipid extracts were isolated by thin-layer chromatography (15), converted to fatty acid methyl esters (16), and separated on a gas chromatograph (model 6890N; Agilent Technologies). The unesterified AA concentration (nmol/mL) was calculated by proportional comparison of chromatographic peak area for AA with that of the standard. The 2 measurements were averaged. Data were not available for 1 young subject.
Registration to MR Images
For each subject, K* images derived from the original PET volumes were registered to the CBF volume to correct for motion between the 11C-AA and 15O-water scans using a 6-parameter transformation and the mutual information cost function (17). The CBF and MR volumes were then coregistered using the same algorithm. K* and Vb images were transformed to MR space using the product of the 2 transformation matrices.
Partial-Volume Correction
Two MR-based PVC approaches were used: 1 with 3 segments (3S: gray matter, white matter, and cerebrospinal fluid [CSF]) (18), and 1 using 2 segments (2S: brain tissue and CSF) (19). The 3S-PVC method is based on MR segmentation, which creates binary mask images for gray matter (mGM), white matter (mWM), and CSF (mCSF). A mask has a value of 1 in the pixels of that segment and a value of 0 in all other pixels. Gray matter pixels were corrected for spill-out of activity and for spill-in of activity from white matter. In the 3S-PVC approach, activity in CSF is assumed to be zero and activity in white matter is assumed to be uniform. The corrected values were calculated as follows:
 Eq. 2
Eq. 2
where C3S is the corrected concentration in a gray matter pixel after PVC, C is the original uncorrected concentration, CWM is the estimated white matter value, and sGM and sWM are the pixel values from the smoothed masks for gray and white matter, respectively. The smoothed masks are created by convolving the binary mask with a 6-mm full width at half maximum 3D gaussian kernel.
To obtain an accurate estimate of CWM, pixel values that represent 100% white matter (sWM = 1) should be used. To estimate this value automatically, pixels with sWM values > 0.99 were identified. These are pixels with a radioactivity value that is unaffected by gray matter or CSF activity (i.e., “pure” white matter); this normally applies to white matter pixels that are far from the other segments—for example, pixels in the centrum semiovale. For each frame, the PET activity values of pixels with sWM values > 0.99 were then fitted as a linear function of sWM, and the fitted value at sWM = 1 was used as CWM. This approach required no operator interaction.
In the 2S method (19), no distinction between gray and white matter is made. Brain tissue is corrected only for spillover into CSF and nonbrain. In our approach, a smoothed brain mask, sB was created from the sum of sGM and sWM. The 2S-corrected (C2S) values are:
 Eq. 3
Eq. 3
MR Segmentation
Extracerebral tissue was eliminated with automatic and manual methods. Segmentation of the edited MR volumes was performed with an adaptive fuzzy C-means algorithm (20), which computes a membership probability for each voxel in gray matter, white matter, and CSF. Each voxel was then assigned to the segment with the highest probability. Visual comparison of the segmented and original images revealed a high-quality segmentation in cortex, but poor results in the basal ganglia and thalamus, where a large fraction of gray matter pixels was misidentified as white matter. Other algorithms—namely, FAST (Oxford University, U.K.) (21) and SPM99 (22)—provided comparable or larger misclassifications. Therefore, gray matter in caudate, putamen, and thalamus was identified manually and the mask images were adjusted.
For 3S-PVC, the smoothed masks (sGM and sWM) were then created from the binary masks. Depending on the local geometry, some pixels defined as gray matter in the binary mask had a very small sGM value. This occurs, for example, at the tips of thin gyri. Correction of such pixels with Equation 2, would produce large changes (and large errors) in those pixel values due to the small sGM in the denominator (23). Therefore, under the assumption that PVC values in such pixels are unreliable, gray matter pixels with sGM values < 0.2 were reassigned to the segment (white matter or CSF) with the larger smoothed mask value at that pixel.
Region-of-Interest (ROI) Measurements
ROI measurements were limited to voxels that were defined as gray matter. First, for each subject, large 3D ROIs were manually drawn on MR images. Due to the much finer sampling of MR data compared with PET data, ROIs were placed on every fourth slice for cortical ROIs and every other slice for subcortical structures. The ROIs were then transferred to the binary gray matter mask image and all pixels not assigned to gray matter were eliminated from the ROIs. In this way, only gray matter pixels contributed to the ROI values. The ROIs were applied to the coregistered PET images and values for the uncorrected, 2S, and 3S data were obtained from CBF, K*, and Vb images. Global gray matter values were calculated as the average of the ROI values.
Statistical Analysis
Analysis was performed using unpaired and paired t tests, as appropriate. Right and left measurements of paired ROIs were averaged. Statistical significance was set at (uncorrected) P < 0.05. Absolute and normalized (to global gray matter) values were computed.
RESULTS
In comparing the blood kinetics of 11C-AA between young and old subjects, the ratios of whole blood to plasma at 10 min were identical in the 2 groups (0.77 ± 0.02). The mean (percent coefficient of variation [% CV]) of plasma parent unmetabolized fraction in young and old subjects was, respectively, 0.33 (% CV = 57) and 0.48 (% CV = 18) at 15 min and 0.11 (% CV = 92) and 0.18 (% CV = 46) at 30 min. There was a strong trend towards a higher parent fraction in the old subjects; from 5 to 20 min after injection, the parent fractions were 0.47 ± 0.18 and 0.62 ± 0.07, in young and old groups, respectively (P = 0.06). In the young and old groups, the 11C-CO2 plasma activity was, respectively, 8% ± 4% and 9% ± 2% at 30 min and 7% ± 3% and 9% ± 2% at 60 min.
Before image registration, head motion was detected in 3 of 8 young and 5 of 7 old subjects by visual inspection. After realignment, head motion was still detected in 1 of 8 young and 2 of 7 old subjects; in the latter 2 subjects, residual movement was reduced. Since residual motion was small and the ROIs were large, the effect on regional PET values was most likely quite small.
Figure 1 depicts the method used to estimate white matter concentration (CWM) for 3S-PVC. For each frame, the activity values of voxels with smoothed white matter mask sWM between 0.99 to 1.0 were fitted to a straight line and the extrapolated value for sWM = 1 was taken as CWM. The volume of white matter voxels with sWM from 0.99 to 1.0 was 14 ± 7 mL. For K* and Vb, the white matter value was determined by applying the model equation (Eq. 1) to the estimated CWM values. For CBF, the extrapolation method was applied directly to the parametric image. There were no significant group differences in white matter values for any tracer. In the whole group, white matter values equaled 2.2 ± 0.5 μL/min/mL (K*), 0.024 ± 0.004 mL/mL (Vb), and 17 ± 2 mL/min/100 g (CBF).
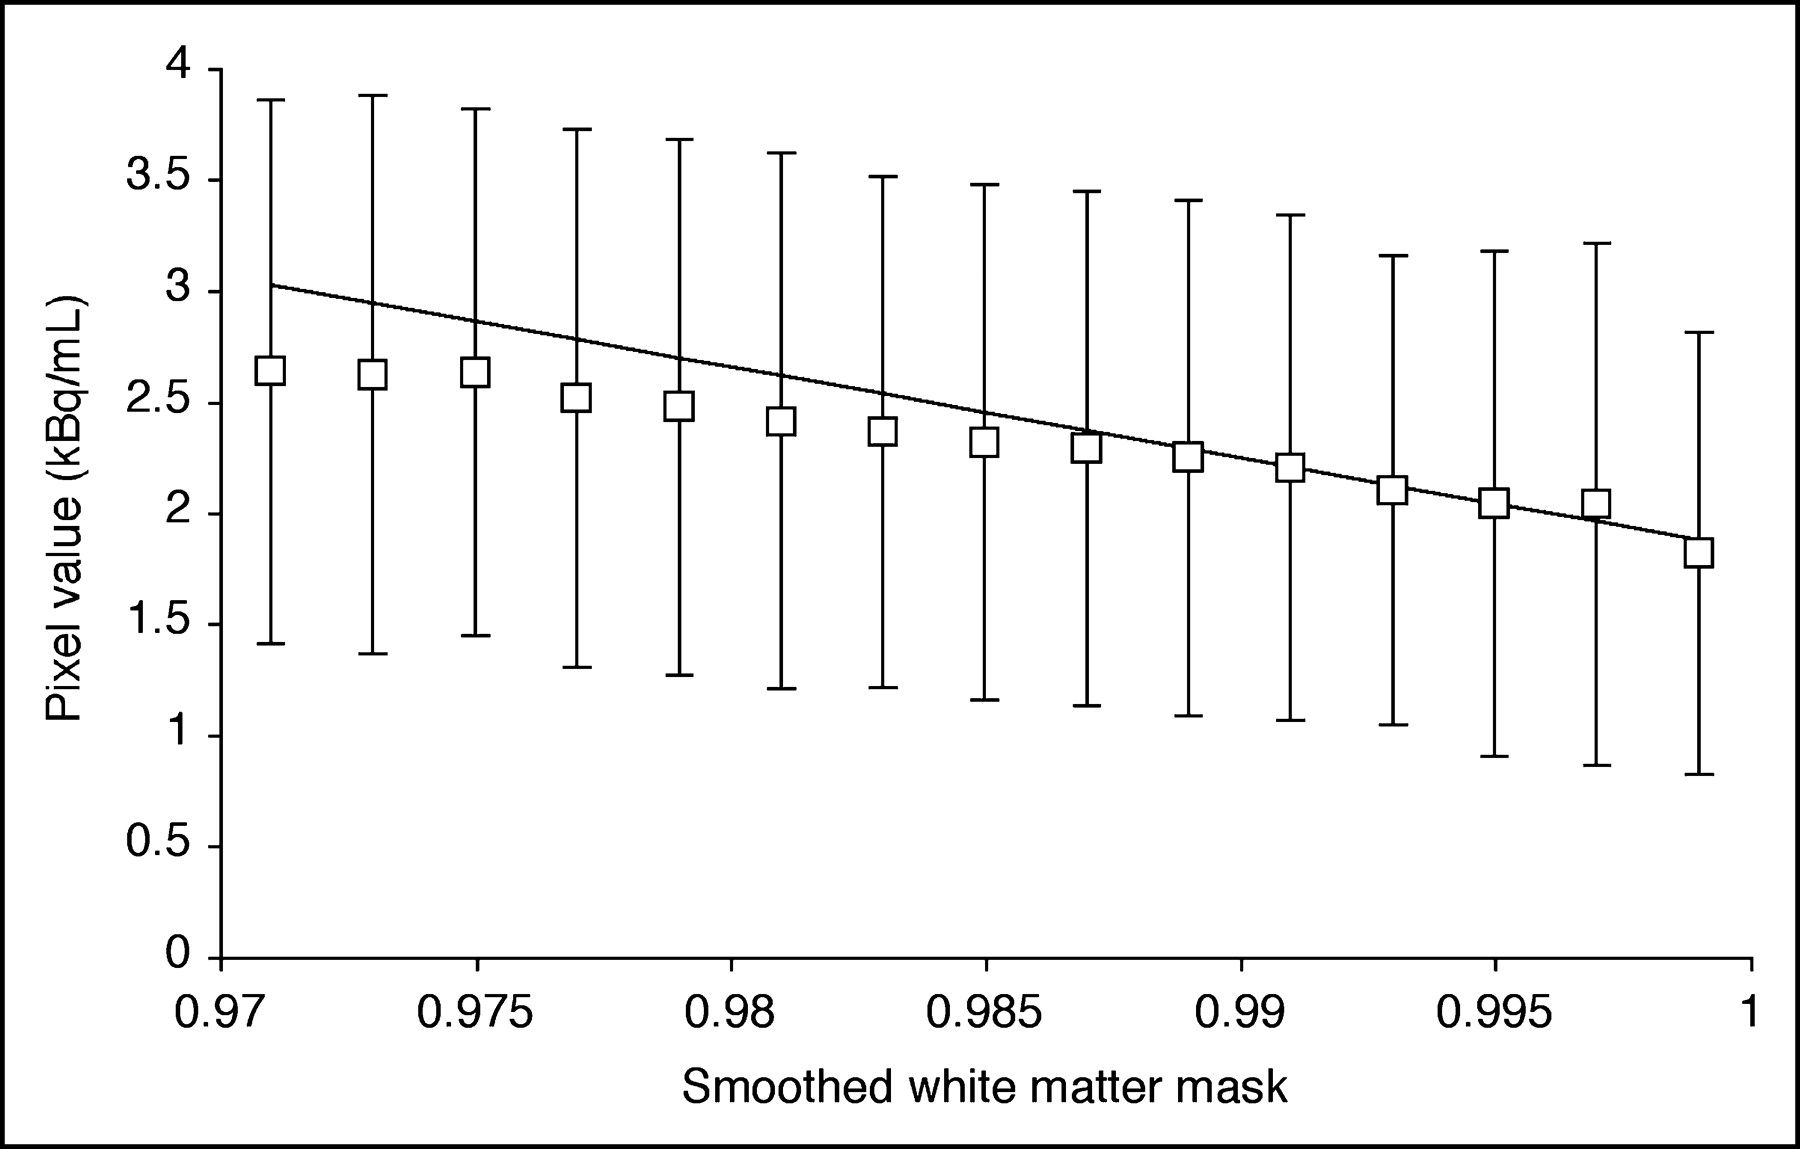
Estimation of white matter activity for 3S-PVC (Eq. 2) from a 11C-AA PET frame (25–30 min after injection). Activity values for pure white matter were obtained from voxels with smoothed white matter mask value (sWM) close to 1.0. Each point represents mean ± SD of activity in voxels plotted vs. smoothed white matter mask. Activity values of voxels with sWM from 0.99 to 1.0 were fitted to straight line and value at sWM = 1.0 was used as white matter value.
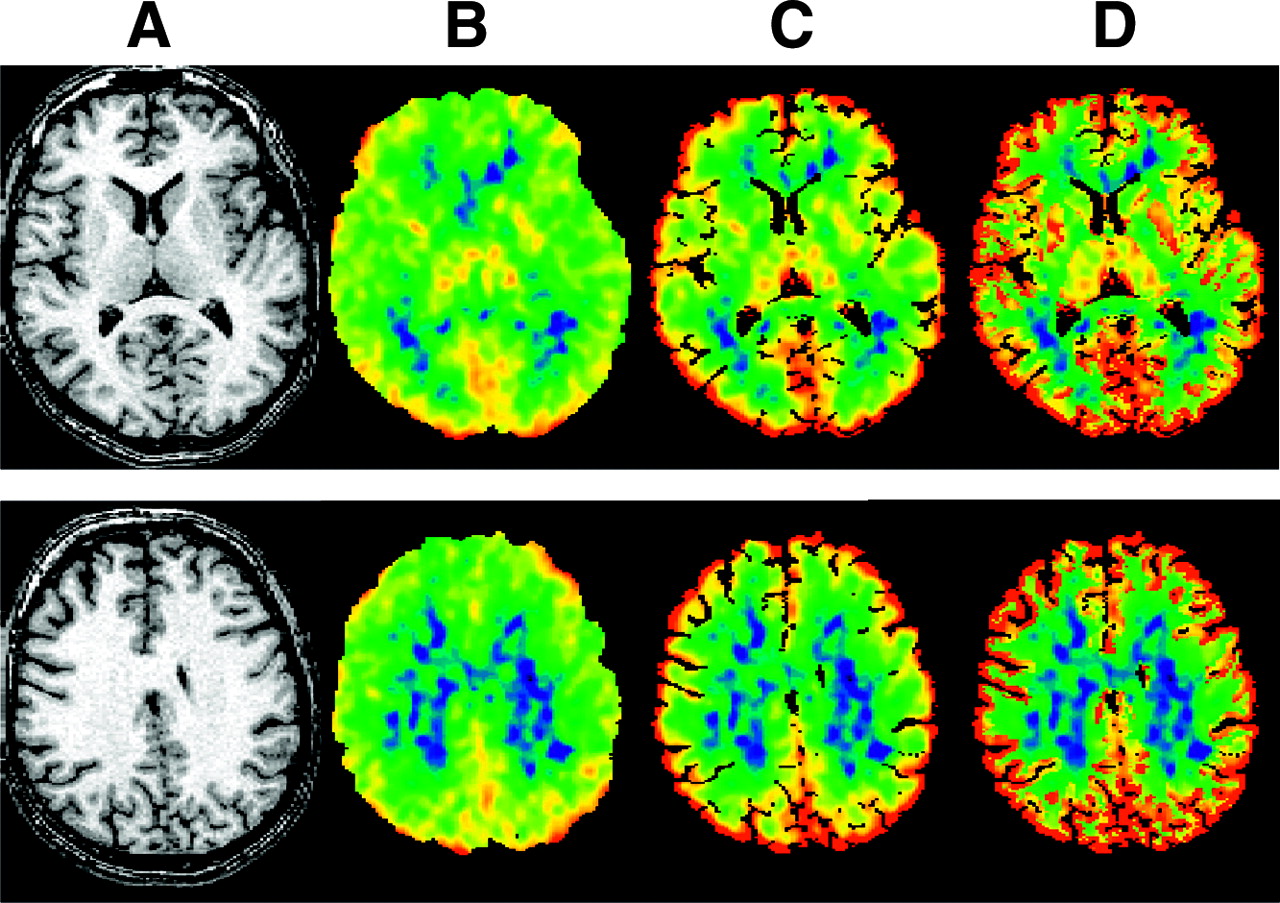
Figure 2 shows transverse images derived from 1 typical young subject at the level of the subcortical nuclei (top) and centrum semiovale (bottom). Along with the MR image (Fig. 2A), uncorrected K* image (Fig. 2B), and PVC images with the 2S (Fig. 2C) and 3S (Fig. 2D) methods are shown. Obviously, there is an increase in gray matter values after PVC, with a larger increase for the 3S method.

Transverse images derived from 1 typical subject at level of subcortical nuclei (top) and centrum semiovale (bottom). (A) MR image. (B) Original image of incorporation rate for 11C-AA (K*). (C) K* image after 2S-PVC. (D) K* image after 3S-PVC. K* images are scaled to maximum of 12 μL/min/mL.
Absolute values of K* in the 2 groups before and after PVC are shown in Table 1. Before PVC, global gray matter K* values for young and old were 4.86 ± 1.18 and 4.51 ± 0.64 μL/min/mL, respectively. After PVC, global gray matter K* values in young and old were, respectively, 5.65 ± 1.55 and 5.45 ± 0.54 μL/min/mL for 2S and 7.35 ± 2.08 and 7.03 ± 0.59 μL/min/mL for 3S. For young and old subjects, respectively, the ratio of gray matter to white matter increased from 2.2 ± 0.2 and 2.0 ± 0.4 to 2.6 ± 0.4 and 2.5 ± 0.6 after 2S-PVC and to 3.4 ± 0.6 and 3.2 ± 1.0 after 3S-PVC.
11C-Arachidonic Acid Incorporation Rate (K*)
There were no statistically significant differences in absolute K* values in any ROI by any method. The lack of group differences may be due to the small sample size and the intersubject variability of K*; thus, normalization to global gray matter values was used to increase statistical power. Normalized K* was significantly lower in older subjects in the frontal lobe (P = 0.001), but this difference disappeared after PVC. PVC introduced significant group differences—that is, reduced normalized K* values in the old group in the putamen (2S-PVC, P = 0.046; 3S-PVC, P = 0.013) and increased in the occipital lobe (3S-PVC, P = 0.014).
The net utilization (Jin) of AA was calculated using K* and the plasma concentration of AA. The plasma values were similar in young and old subjects and equaled 3.8 ± 1.7 nmol/mL, consistent with previous results (24). There were no significant differences between young and old subjects in Jin for any ROI, with or without PVC. Global gray matter Jin values for the whole group were 0.025 ± 0.013, 0.030 ± 0.016, and 0.039 ± 0.024 μmol/d/g for uncorrected, 2S-PVC, and 3S-PVC, respectively. Note the high intersubject variation in Jin, presumably caused by the high physiologic variance of the plasma unesterified AA concentration (24).
Absolute and normalized Vb values estimated from the 11C-AA studies before and after PVC are summarized in Table 2. No significant group difference was detected in absolute values. After normalization, a lower Vb value (P < 0.05) was found in the frontal lobe of old subjects; this difference was not significant after PVC. There were no other regional group differences before or after PVC.
Cerebral Blood Volume
Absolute and normalized CBF values before and after PVC for young and old subjects are shown in Table 3. Before PVC, absolute CBF values were significantly lower in the older subjects in the frontal cortex (P = 0.025) and the cerebellum (P = 0.027), with trends in other regions, including global gray matter (P = 0.053). Frontal cortex differences were no longer significant after PVC. On the contrary, cerebellum P values for both 2S-PVC and 3S-PVC remained close to the statistical threshold (P = 0.040 and P = 0.054, respectively). After normalization, old subjects had significantly lower CBF only in the frontal lobe (P = 0.011); this difference was eliminated by PVC. Significant group differences were introduced by the 3S-PVC—that is, higher normalized CBF values in the old group in the parietal and occipital cortex (P = 0.028 and P = 0.032).
Cerebral Blood Flow
Table 4 reports the percentage increase in regional and global values for K*, Vb, and CBF after 2S-PVC and 3S-PVC, respectively. For all parameters, the percentage increase was greater in older than in young subjects, reflecting greater cortical atrophy. As a percentage of brain volume, older subjects had less gray matter (46% ± 2% vs. 49% ± 2% of pixels in the ROIs examined; P = 0.016) and more CSF (10% ± 3% vs. 7% ± 2%; P = 0.027); white matter percentage was equal in the 2 groups (44% ± 2%).
Percentage Increase in PET Parameters After PVC
For all measurements, the percentage increase in PET values was substantially higher with the 3S method and somewhat larger in old subjects. The percentage increases after 2S-PVC were very similar for all tracers (whole group: 18% ± 7%, 17% ± 6%, and 16% ± 6% for K*, Vb, and CBF, respectively). The 2S-PVC CBF percentage increases were in the range of previous results (11). The percentage increases after 3S-PVC were quite similar for K* and CBF and somewhat lower for Vb. Each individual’s percentage increase after 3S-PVC was compared with his percentage of gray matter, white matter, and CSF, calculated by applying ROIs to the corresponding binary segments. A significant negative correlation of the percentage increase in K* with gray matter volume was found (r = −0.70; P < 0.005) and a positive correlation with regional CSF volume was found (r = 0.87; P < 0.0001). Correlation results obtained with 2S-PVC percentage increases as well as with CBF and Vb were similar.
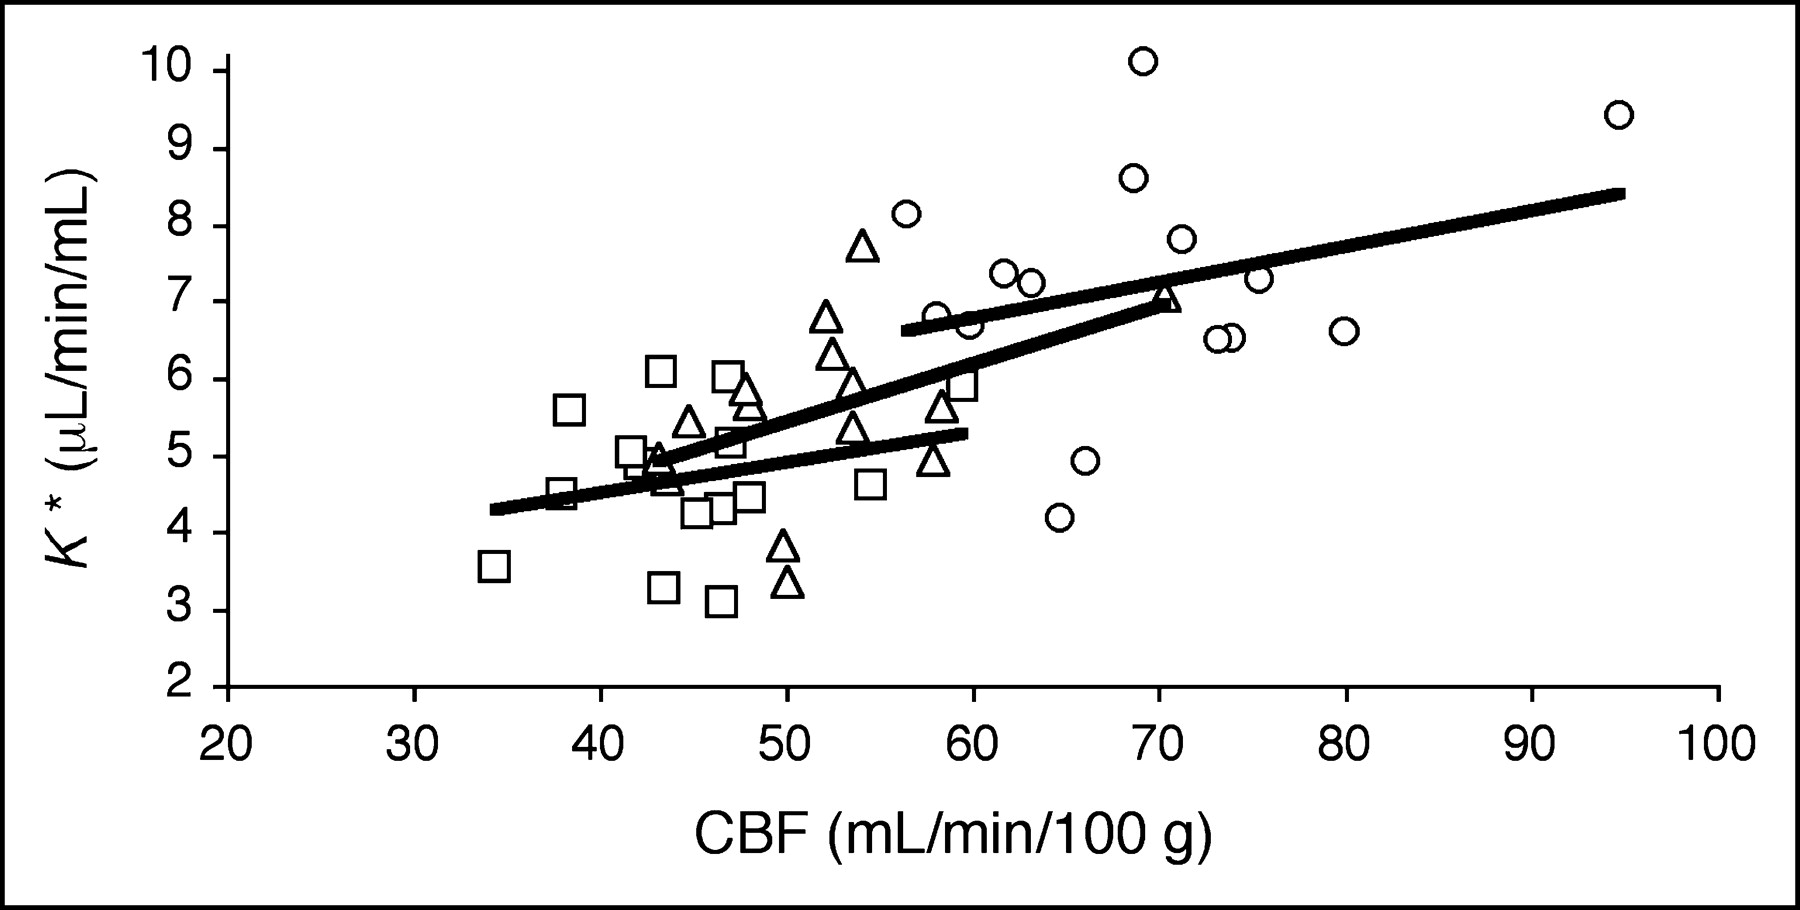
For each subject, K* values for global gray matter were plotted against corresponding CBF values (Fig. 3). In agreement with previous results in young subjects (7), there was no significant relationship between K* and CBF for uncorrected data (K* = 2.93 + 0.039 CBF; P = 0.35). Application of PVC did not introduce significant K*–CBF correlations. There were also no significant correlations when young and old groups were analyzed separately.

Relationship between CBF and 11C-AA incorporation rate (K*) before PVC (□), after 2S-PVC (▵), and after 3S-PVC (○). Each point represents global gray matter value for 1 subject (n = 15). No significant relation between K* and CBF was detected. Regression equations were as follows: Uncorrected, K* = 2.93 + 0.039 CBF (r = 0.26; P > 0.05); 2S, K* = 1.65 + 0.075 CBF (r = 0.45; P > 0.05); 3S, K* = 3.98 + 0.047 CBF (r = 0.30; P > 0.05).
In the whole group, intersubject variability was not increased by PVC. The percent CVs of uncorrected, 2S-PVC, and 3S-PVC data were 20%–21% for K*, 10%–12% for Vb, and 13%–14% for CBF.
DISCUSSION
We performed PET studies in 8 young and 7 elderly healthy subjects with and without PVC to assess the effect of aging on the cerebral incorporation rate (K*) for 11C-AA. K* has been shown to be sensitive to PLA2-related neural signaling (8). The effect of aging on Vb was also examined, since this parameter is obtained through the 11C-AA analysis (7), and no aging study of Vb corrected for the partial-volume effect. PVC was applied with 2S and 3S methods, with white matter activity estimated with a new automatic method for 3S. Both methods correct gray matter data for loss of activity to CSF and nonbrain regions. The 3S method, which also corrects for averaging between gray and white matter, is more accurate but is more sensitive to segmentation and registration errors.
Motion Correction
Sequential AIR registration of dynamic frames was adopted to correct for head movement during the 11C-AA acquisition. This algorithm assumes that registered images have a relatively uniform ratio between corresponding pixel values (13). Initial attempts to motion correct 11C-AA frames using a threshold that included brain tissue failed, possibly due to spillover of the high nonbrain activity into the brain. Therefore, registration based on noncerebral pixels was used. Motion of the ocular muscles, as detected from the sequential display of activity frames, was considered a sufficient, although not ideal, index of head movement. A threshold equal to 20% of peak frame activity provided the best performance, removing or reducing head motion in 14 of 15 subjects.
PVC Methods
The 3S-PVC method (18) corrects for spill-out of activity from gray matter as well as spill-in of white matter activity into gray matter pixels. Other ROI-based PVC methods also correct for partial-volume averaging between adjacent gray matter regions (25–27). Such methods are the preferred choice when gray matter activity is heterogeneous—for example, in receptor studies (28). Alternatively, the creation of PVC images permits the use of various ROI sampling strategies independent of the PVC process.
Estimation of White Matter Activity
The 3S-PVC method requires estimation of a global white matter value (CWM). We developed a new method that uses pixels with smoothed white matter mask values (sWM) close to 1. Previously, white matter was sampled from the centrum semiovale (18). Our approach has the advantage of being automatic and properly accounting for white matter size. In the young group, white matter K* (2.14 ± 0.40 μL/min/mL) was smaller than that previously calculated in the same population with an ROI approach (2.57 ± 0.54 μL/min/mL) (7). Thus, the ROI approach may overestimate the true white matter activity.
To assess the sensitivity to the estimated white matter value, in 1 young subject, PVC values were calculated with CWM set to 0 and compared with the original 3S values. In this case, K* and CBF were overestimated by 17% ± 3% and 11% ± 3%, respectively. Thus, a 10% error in the CWM estimate would introduce only a 1%–2% error; this result is consistent with previous simulations (18,23).
Extracranial Activity and PVC
Ideal 11C-AA PVC would require a fourth segment to account for spillover of muscle activity into cerebral pixels. Although most brain pixels are far from extracranial muscles, a worst-case scenario was evaluated by defining an orbitofrontal region and a nearby ocular muscle segment in a typical subject on a late 11C-AA frame. K* obtained without correction for muscle spillover was ∼16% higher than the corrected value. This suggests that correction for extra-brain activity may be necessary for the orbitofrontal cortex. Since the exact physiologic mechanisms underlying 11C-AA-derived extracranial radioactivity are not known, additional evaluation is necessary to define the magnitude and intersubject variability of this muscle partial-volume effect.
Aging Effect
No significant group differences were detected before or after PVC in K* or Vb in cortical regions. In contrast, lower CBF values were found in the frontal lobe of the older population; this difference was no longer significant after PVC. Because of the small number of subjects, normalization to global gray matter was performed to increase statistical power. Significantly lower normalized K*, Vb, and CBF values were detected in the frontal cortex of older subjects; these differences also lost statistical significance after PVC. Reductions in frontal cortex function in normal aging have been observed in previous PET studies, both before (9–11,29) and after (11,30) PVC. In our 3S-PVC data, a few significant group differences in normalized cortical K* and CBF were found. We attribute the increases in normalized occipital 3S-PVC values to normalization artifact produced primarily by the (nonsignificant) reduction in global gray matter values.
Cerebellum
Lower CBF values were detected in the cerebellum in the elderly group with uncorrected and 2S-PVC data; differences were close to significance after 3S-PVC. These results differ from previous studies, in which cerebellar physiology was not affected by age (9–11,31). This difference may be due to our ROI strategy, using segmented MR even for the uncorrected data. If there are group differences in segmentation accuracy, artificial differences will be introduced into uncorrected and, potentially, PVC-corrected data.
Influx of AA
It has been postulated that the net brain utilization of AA, Jin (5), can be determined by multiplying K* by the unlabeled AA plasma concentration. However, there are limitations to this postulate. The 11C-AA model only estimates the irreversible uptake rate into membrane lipids. It does not directly measure the PLA2-induced release of AA from phospholipids, nor does it include the production of pro-inflammatory metabolites from released AA. However, since AA cannot be synthesized in the mammalian brain, Jin may be an index of AA metabolism (5). Results in a rat model of neuroinflammation are consistent with this hypothesis (32).
CONCLUSION
In a carefully screened but small sample, and after performing PVC, the incorporation rate for 11C-AA, CBV, and CBV show little or no aging effect.
Acknowledgments
The authors thank Giuseppe Esposito, MD, for helpful discussions; Margaret G. Der and Jane Bell for their excellent laboratory talents; and the entire staff of the National Institutes of Health PET Department for their technical assistance.
Footnotes
Received Dec. 3, 2003; revision accepted Apr. 12, 2004.
For correspondence or reprints contact: Richard E. Carson, PhD, PET Department, National Institutes of Health, Building 10, Room 1C-401, 10 Center Dr. MSC 1180, Bethesda, MD 20892-1180.
E-mail: richard-e-carson{at}nih.gov
REFERENCES
In this issue


Jump to section
Related Articles
Cited By...
- Temporal Cognitive and Brain Changes in Korsakoff Syndrome
- Age-Related Change in 5-HT6 Receptor Availability in Healthy Male Volunteers Measured with 11C-GSK215083 PET
- The Synthesis and In Vivo Pharmacokinetics of Fluorinated Arachidonic Acid: Implications for Imaging Neuroinflammation
- Brain phospholipid arachidonic acid half-lives are not altered following 15 weeks of N-3 polyunsaturated fatty acid adequate or deprived diet
- Using Cerebral White Matter for Estimation of Nondisplaceable Binding of 5-HT1A Receptors in Temporal Lobe Epilepsy
- Imaging incorporation of circulating docosahexaenoic acid into the human brain using positron emission tomography
- Whole-body synthesis-secretion rates of long-chain n-3 PUFAs from circulating unesterified {alpha}-linolenic acid in unanesthetized rats
- Arachidonic Acid and the Brain
- Imaging Neuroinflammation in Alzheimer's Disease with Radiolabeled Arachidonic Acid and PET
- 5-HT1A Receptors Are Reduced in Temporal Lobe Epilepsy After Partial-Volume Correction