


Abstract
Neuronal nicotinic acetylcholine receptors (nAChRs) are widely distributed in the human brain, especially the α4β2 subtype of nAChR. The cholinergic systems have roles in various neurophysiologic functions, such as learning, memory, and cognition, whereas normal aging and neurodegenerative diseases have been associated with changes in nAChRs. Recently, 5-iodo-3-(2(S)-azetidinylmethoxy)pyridine (5IA) has been synthesized as a radioligand for imaging nAChRs with SPECT. 123I-5IA shows higher affinity toward the nAChR α4β2 subtype, enhanced receptor subtype selectivity, good safety, and low nonspecific binding. Methods: In this study, a SPECT quantitative study of human nAChRs binding with 123I-5IA was conducted in healthy volunteers. An arterial input function was obtained for each subject and a 2-compartment model was used to determine the kinetic parameters of 123I-5IA using data from a 6-h scan. The distribution volume (VT) (mL/mL), which is related to the number of unoccupied binding sites in the brain, was calculated and values were compared with results of a graphical analysis (Logan plot, VLG). Results: Analysis of the unmetabolized compound showed a high parent fraction of 123I-5IA in plasma. The results from the 2-compartment model analysis showed high VT values for the thalamus; moderate values for the brain stem, cerebellum, and basal ganglia; and low values for the cortical regions. Good agreement was observed between VT values and results of autoradiographic experiments done in vitro for nAChR density in human brain. A high correlation index was observed between distribution volumes from model and graphical analyses. Conclusion: Our results indicated that 123I-5IA SPECT is suitable for the quantification of nAChRs in human brain.
- 5-123I-iodo-3-(2(S)-azetidinylmethoxy)pyridine
- SPECT
- nicotinic acetylcholine receptors
- human brain
- distribution volume
- quantitative measurement
- Logan plot
- compartmental model analysis
Nicotinic acetylcholine receptors (nAChRs) are widely distributed in mammals, appearing in the central and peripheral nervous systems, neuromuscular junctions, and adrenal glands. The majority of high-affinity nAChRs in the brain are of the α4β2 subtype (1–5). It has been reported that cholinergic systems play important roles in various neurophysiologic functions such as learning, memory, and cognition (2,6). Normal aging and neurodegenerative diseases (such as Alzheimer’s disease and Parkinson’s disease) have been associated with changes in nAChRs (2,7–10). Furthermore, a dose-dependent increase in the subtype in the brain has been observed in chronic nicotine treatment in animal models (4,11). This upregulation was also seen in homogenates of autopsied brain samples from smokers (12,13), with a return to control levels after cessation of (−)-nicotine treatment (14). These findings suggested that upregulation of the α4β2 subtype of nAChR in the brain plays an important role in tobacco tolerance and dependence (13).
Therefore, the development of high-affinity radioligands suitable for in vivo imaging of nAChRs, which can provide valuable information from living subjects at different stages of a disease, and the effects of different drugs in patients with neurodegenerative diseases, as well as the upregulation of nAChRs to baseline levels after cessation of treatment with (−)-nicotine or tobacco use, have been of major interest.
Recently, 5-iodo-3-(2(S)-azetidinylmethoxy)pyridine (5IA) has been synthesized as a radioligand for imaging nAChRs with SPECT. This compound exhibits extremely high affinity, high selectivity and specificity for the α4β2 subtype of nAChR, relatively low acute toxicity, and acceptable dosimetry (15–24).
In this study, a SPECT quantitative study of human nAChRs with 123I-5IA was performed in healthy volunteers. A compartmental model was used to determine the kinetic parameters of 123I-5IA based on the data for a 6-h scan time. Furthermore, due to the necessity of measuring nAChRs in the human brain with a reasonably short scan time for specific achievements, such as in patients with neurodegenerative diseases, a 90-min scan time was also evaluated in another group of healthy subjects.
MATERIALS AND METHODS
Groups of Volunteers
The healthy volunteers included in this study were divided into 2 groups. In group 1, 6 young subjects (5 men, 1 woman; age, ∼20 y; mean age, 19.5 ± 0.6 y) were included. All subjects underwent a 6-h scan. In group 2, 15 other subjects (6 men, 9 women; age, 20–71 y; mean age, 41.2 ± 18.7 y) were integrated. In this group, a short scan time was applied (90 min). None of the volunteers had a history of either neurologic or psychiatric illness or tobacco use. All subjects gave their written informed consent to participate in this study in compliance with the regulations of the Joint Committee on Clinical Investigation of the Kyoto University Hospital.
Radiolabeling
To a sodium 123I-iodide solution (1,110 MBq) (Nihon Medi-Physics), 100 μg of 5-(tri-n-butylstannyl)-3-([1-t-butoxycarbonyl-2(S)-azetidinyl]methoxy)pyridine, 1.5% acetic acid, 3 mol/L HCl, and 5% H2O2 solution were added, and the mixture was stirred at 75°C for 15 min. Concentrated HCl was then added and the resulting solution was stirred for another 10 min at 75°C. The mixture was made basic with sodium hydroxide and extracted with ethyl acetate, and the organic layer was evaporated. The residue was purified by reverse-phase high-performance liquid chromatography (HPLC) (Cosmosil 5C18-AR-300, 10 × 250 mm, Nacalai Tesque; 10 mmol/L ammonium acetate/methanol/triethylamine = 752:750:2; 1.5 mL/min; retention time for 5IA = 40 min). After evaporation of the HPLC eluent, the residue was dissolved in 0.9% saline and filtered through a 0.2-μm filter into a sterile vial. Radiochemical purity was >98% and radiochemical yields were ∼42%. The specific activity determined from the ultraviolet absorbance at 254 nm was >169 GBq/μmol (the detection limit for this method).
SPECT
All SPECT dynamic scans were acquired with a triple-head rotating γ-camera system (PRISM 3000; Picker International, Inc.) equipped with low-energy, high resolution, fanbeam collimators. This system provides a spatial resolution of 8.0-mm full width at half maximum at the center of the field of view with a sensitivity of 135 cps/MBq. The volunteer’s head was placed in a semicylindric head-holder lined with a rubber sponge to prevent motion during the study. Data acquisition was performed in 64 × 64 matrices in a continuous rotation mode with 40 steps for 120° and 1.5 s per step, which translate into 1 min for 1 SPECT dataset. For the first group of subjects, the 6-h scan time, volunteers underwent a 120-min scan (2 min × a 60-frames scan) after intravenous injection of 123I-5IA, followed by 4 sets of 20-min scan (2 min × a 10-frames scan, at 3, 4, 5, and 6 h after the injection), while for the other group of volunteers, only a 90-min (2 min × a 45-frames scan) was performed in each subject.
A cross-calibration between the SPECT scanner and well counter was performed using a series of uniform cylindric phantoms (16-cm inner diameter × 15-cm height) containing an aqueous solution of 123I. The activity on the SPECT images was linearly related to the activity concentration in the phantom measured with the automatic well-type γ-counter (Cobra 2; Packard).
All SPECT images were filtered with a Butterworth filter (cutoff frequency, 0.25; order, 4), and reconstructed using a filtered backprojection algorithm with a ramp filter. Attenuation correction was performed using ellipses outer line approximation and Chang’s method (coefficient of 0.06/cm) adjusted for each slice, which assumes that the attenuation process is homogeneous throughout the brain and can be described by an exponential function. The same ellipse size was kept for the different scans of each volunteer. Scatter correction was not applied.
Arterial Input Function
A catheter was inserted into the left brachial artery for blood sampling, while another catheter was inserted into the right cubital vein for the injection of the radioligand. A dose of ∼150 MBq 123I-5IA was administered intravenously over a period of 1 min at a constant rate with an infusion pump. The scan started simultaneously with the injection.
An arterial input function was obtained for each volunteer. Twenty-five arterial blood samples were drawn, initially every 10 s during the first 2 min, followed by 15 s during the next minute, and then subsequently at 5, 7, 10, 20, 30, 45, 60, 90, and 120 min (for those subjects with a short scan time, the last sample was not drawn). Additionally, 6 venous blood samples were obtained at 1.5, 2, 3, 4, 5, and 6 h after injection using different vessels. Blood samples were centrifuged at 1,750g for 3 min at 4°C. From each sample, 100 μL of plasma were removed and the radioactivity was measured in an automatic well-type γ-counter (Cobra 2; Packard). All radioactivity measurements were decay corrected to the time of radioligand administration. The first 2 venous samples were drawn to verify the suitability of venous blood sampling to be used for the input function instead of arterial sampling. We previously confirmed its suitability in preliminary analytic studies of arterial and venous samples at several time points, including 1.5, 2, 4, and 6 h after injection.
Sixteen samples (1, 2, 3, 5, 7, 10, 20, 30, 45, 60, 90, 120, 180, 240, 300, and 360 min) were analyzed for metabolite determination. An aliquot of 300 μL of plasma was mixed with an equal volume of acetonitrile, and the denatured proteins were removed from the plasma by centrifugation at 1,750g for 5 min at 4°C. The radioactivity in the supernatant was analyzed by thin-layer chromatography (TLC) (Rf = 0.55 for 123I-5IA) (LK6DF Silica Gel 60 Å; Whatman). The TLC plates were developed in a solution of 10% ammonium acetate and methanol (1:1). Furthermore, some of the plasma supernatant samples (1, 3, 10, 30, 60, and 120 min) were also analyzed by reverse-phase HPLC (Cosmosil 5C18-AR-300, 4.6 × 150 mm; Nacalai Tesque) at a flow rate of 1.0 mL/min (retention time for 123I-5IA = 10 min).
The unmetabolized fraction, M(t), of the arterial input function was determined from the ratio of parent compound counts to the total plasma counts derived from TLC results. The following empiric equation was used to describe α and β:
 Eq. 1 where the parameters α and β were estimated by nonlinear least-squares fitting. This empiric equation was designed to equal 1 at time 0 with a zero first derivative. Metabolite correction was performed by plotting the activity in arterial plasma samples against the time.
Data Analysis
Initially, 60 circular regions of interest (ROIs) (21 pixels per circle) were manually drawn on a 120-min composite transaxial SPECT image of each subject. The ROIs were distributed among various regions (basal ganglia, thalamus, brain stem, cerebellum, and frontal, parietal, temporal, and occipital cortices) on both sides. Then, ROIs were placed on the delayed scans (3-, 4-, 5-, and 6-h scans). To accomplish the best coregistration between the initial scan (120 min) and subsequent delayed scans (4 sets of 20 min), the slice with the highest tissue count (thalamus region) was identified for each scan. Then, based on that slice, the exact position of the ROIs used on the 120-min scan were repositioned on the other scans using an image analysis package (Dr. View; Asahi-Kasei) and dedicated software. Thus, we could maintain the same ROI position for the same region in different image sets. For the 90-min scan time, the same procedure was used. However, no coregistration with another scan time was necessary. ROI data were further decay corrected. SPECT data were calibrated to the well counter used to measure the injected activity. Time–activity curves were generated for each ROI using the same image analysis package (Dr. View).
Derivation of Receptor Parameters
The analysis of 123I-5IA distribution begins with the kinetic model depicted in Figure 1A. Owing to the limited statistical quality of SPECT data, we initially proposed a model that has only 2 tissue compartments. The model consists of 1 blood compartment, representing the arterial plasma concentration of unchanged tracer (Cp), a tissue compartment (Cf+ns) that encloses free ligand in tissue (Cf) plus ligand bound to nonspecific sites (Cns), and another tissue compartment representing ligand bound to specific sites (Cs). In this model, the free and nonspecifically bound tissue compartments are assumed to equilibrate rapidly. The units of concentration (or radioactivities) for each compartment presented in this article are in kBq/g.
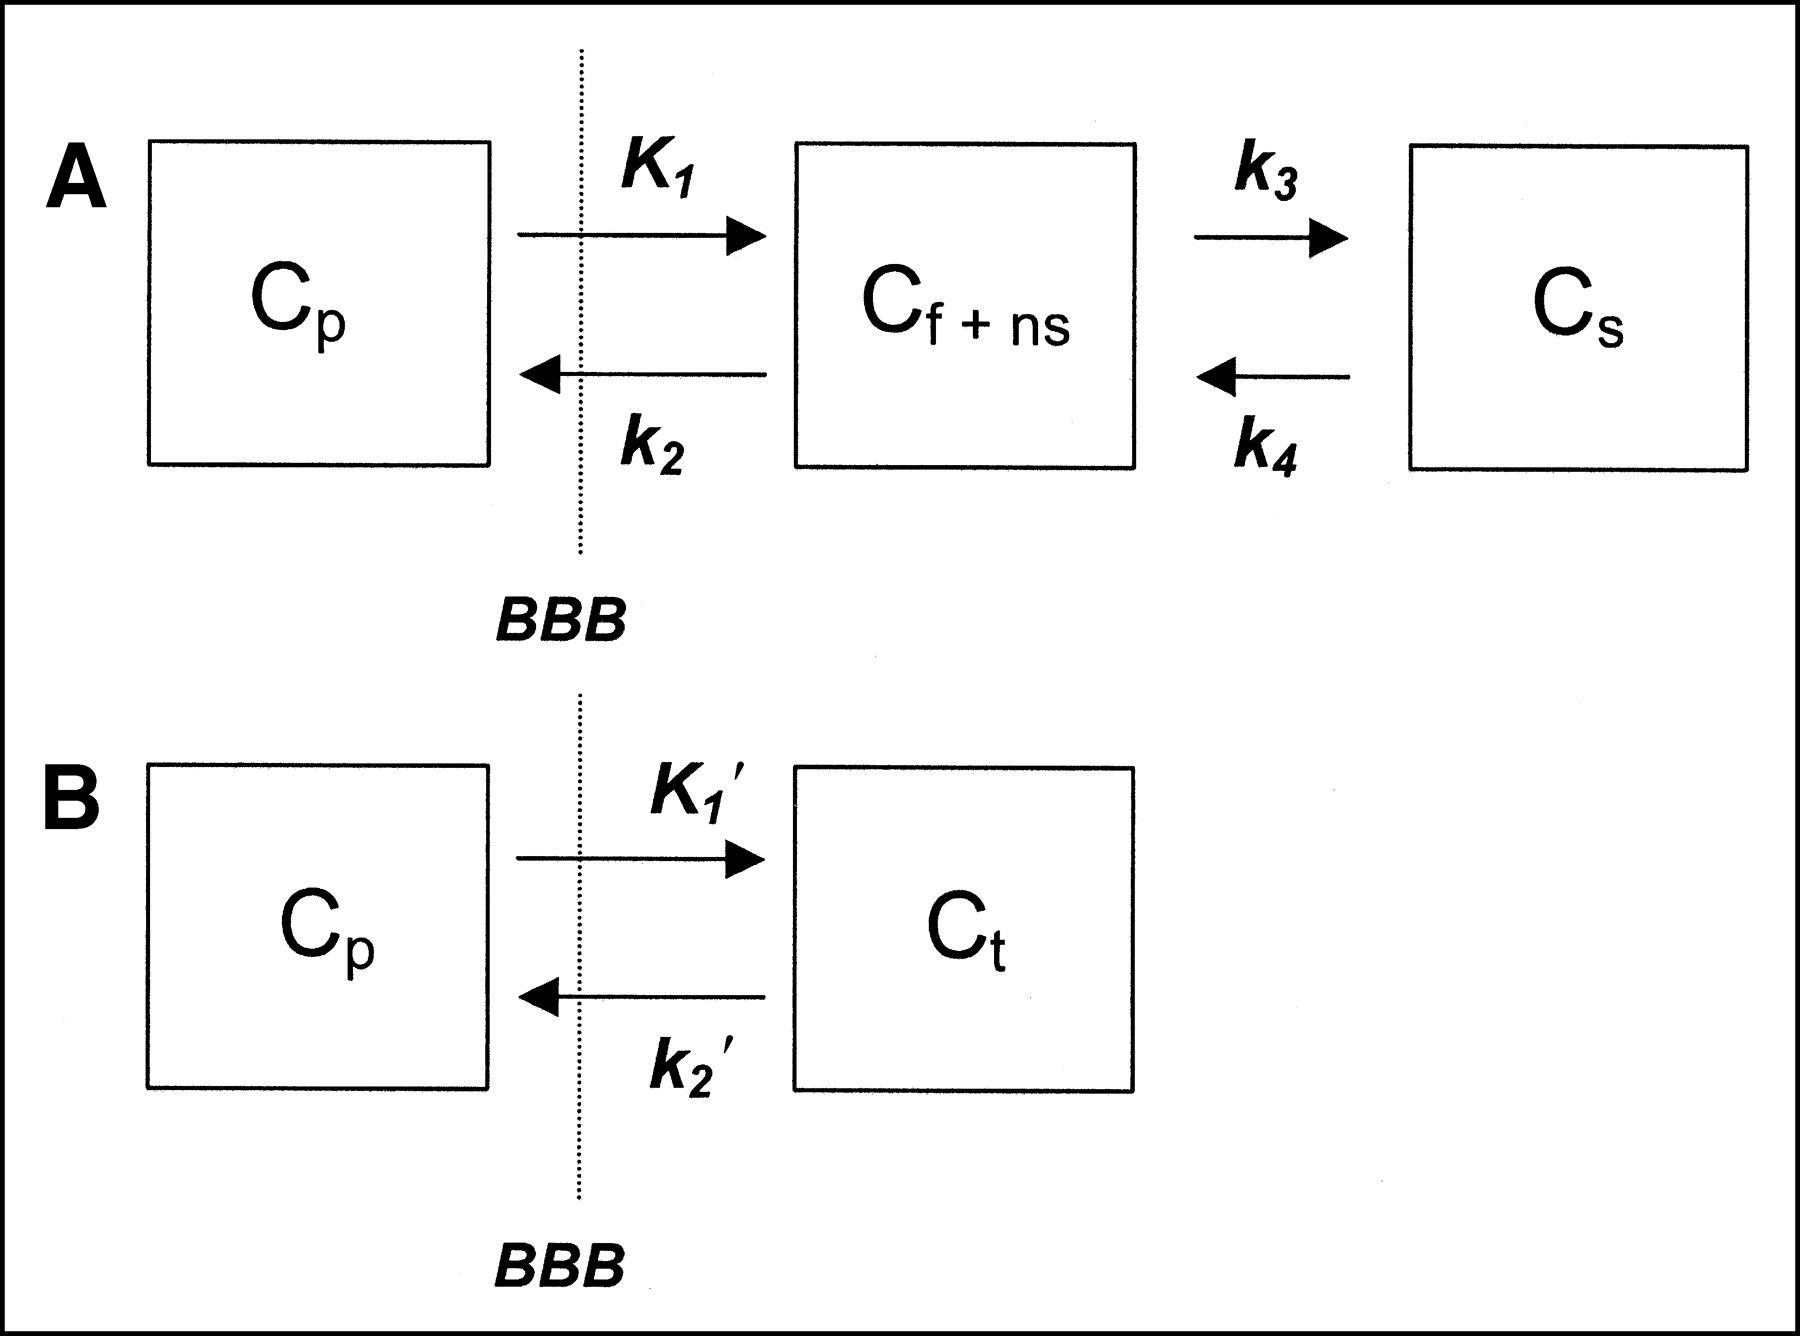
(A) Three-compartment, 4-parameter kinetic model. This model consists of 1 blood compartment (Cp), a tissue compartment (Cf+ns) that encloses the free ligand in tissue (Cf) plus ligand bound to nonspecific sites (Cns), and another tissue compartment representing ligand bound to specific sites (Cs). Free and nonspecifically bound tissue compartments are assumed to equilibrate rapidly. Rate parameters (K1, k2, k3, and k4) describe exchange across blood–brain barrier (BBB), association and dissociation from sites in free plus nonspecifically bound compartment, and association and dissociation from sites in specifically bound compartment. (B) Two-compartment, 2-parameter kinetic model. This configuration simplifies the model described in A by combining free plus nonspecifically bound compartment and specific compartment into a single compartment (Cf+ns+s) and assumes that rate constants k3 and k4 are rapid compared with BBB transport rates.
The equilibrium distribution volume of a compartment i (Vi; mL/g) was defined as the equilibrium ratio of the tracer concentration in this compartment (Ci) to the free arterial concentration (Cpf1, where f1 represents the fraction of unbound to plasma proteins unmetabolized parent radioligand activity in plasma):
 Eq. 2
Eq. 2
Vf+ns and Vs are the equilibrium distribution volumes of the free plus nonspecific compartments and specific compartment, respectively. Vf+ns+s (Vt) is the total regional equilibrium distribution volume, equal to the sum of Vf+ns and Vs.
The tracer concentration over time in Cf+ns and Cs is given by:
 Eq. 3
Eq. 3
 Eq. 4
Eq. 4
The parameters are defined as follows:
 Eq. 5
Eq. 5
 Eq. 6
Eq. 6
 Eq. 7
Eq. 7
 Eq. 8
Eq. 8
 Eq. 9
Eq. 9
 Eq. 10
The rate parameter K1 represents the delivery rate constant from plasma to compartment Cf+ns, and k2 defines the rate constant of return from compartment Cf+ns to plasma. We assume that, at equilibrium, the concentration of free tracer in tissue water equals the concentration in plasma water. The parameter k3 is the rate constant of transfer from compartment Cf+ns to Cs, and the parameter k4 is equal to koff, the dissociation rate from the receptor.
The parameter F is regional blood flow (mL/g/min), E0 is the single-pass extraction fraction of ligand into brain, PS is the permeability-surface area product (mL/g/min), kon is the biomolecular association rate between ligand and receptor (g/pmol/min), Bmax′ is the receptor density or concentration of “unoccupied” receptors (pmol/g), koff is the dissociation rate of ligand from the receptor complex (min−1), and Kd is the equilibrium ligand binding constant for the specific receptor site (pmol/g). The ratio of receptor-related parameters Bmax′ and Kd has been previously referred to as the binding potential (BP) (25). The solution to this model form is given by:
 Eq. 11 where Ct(t) is defined as concentration in tissue (Cf+ns + Cs):
 Eq. 12 ⊗ represents the mathematic operation of convolution.
If the binding and dissociation of ligand from the specific receptor compartment are rapid compared with the transport parameters K1 and k2, the model can be further reduced to a single tissue compartment that contains free, nonspecifically bound, and specifically bound ligand, as shown in Figure 1B. The kinetic parameters of this simplified model are described as follows:
 Eq. 13
 Eq. 14
 Eq. 15
The solution equation to this model form is given by:
 Eq. 16
Since k3 and Bmax′ are no longer isolated model parameters, receptor information in this model configuration is represented only by VT. As the ratio of the association to dissociation rate (k3/k4) becomes progressively higher, the specific distribution volume term dominates and Vf+ns′ yields a progressively better estimate of Bmax′.
Due to its simplicity and independence from a model—that is, no knowledge is required of the compartmental configuration of the underlying data—a graphical method of analysis (26) was also used. In SPECT, regions of brain tissue are sampled by drawing a ROI. The radioactivities in a ROI at time t can be expressed as:
 Eq. 17 that is, the sum of radioactivities from all compartments in a given ROI plus the contribution from regional blood volume V. V is estimated at 5% and often has a negligible contribution after the initial part of the study. Thus, Equation 17 can be rearranged into Equations 18 and 19 for the 3- and 2-compartmental models, respectively:
 Eq. 18
 Eq. 19 Equations 18 and 19 are linear forms when the last term (int) is constant. The points plotted are defined by the scanning time t.
Plotting ∫0tROI(t′)dt′/ROI(t) versus ∫0t Cp(t′)dt′/ ROI(t) for time t, a representative plot of a ROI is linear after some time t*. The slope of this linear function represents the total distribution volume plus the blood contribution, here defined as VLG. In this study, the K1 value from the Logan plot is designated as K*1 as well as k*2. The effects of blood flow and capillary permeability are implicitly included in K*1 and k*2. For the 2-compartment model, nonspecific binding is also included in k*2. Estimates of K*1 can be calculated by taking the ratio of the slope (VLG value, neglecting V) of the linear function, while k*2 can be calculated by taking the ratio of K*1 to VLG. This will be valid for the 2-compartment model when the second term, the intercept, is small compared with the first.
Statistical Analysis
All data are expressed as the mean ± SD and the percentage of the rate constants (coefficient of variation [%COV]) (100 × SD/mean). The distribution volumes obtained from the different regions in the brain were analyzed using 1-way ANOVA with the Bonferroni protected least-significant difference test. A factorial ANOVA was also performed considering interacted factors, different time intervals (90 and 360 min) and regions in the brain, to determine the VT values. An analysis of correlation (Pearson test) between distribution volumes calculated from different methods of analyses was performed. A Student t test was also applied for comparisons between the first (90-min scan time) and second group of volunteers with matched age for the same region. All tests were 2-sided, and P values <0.05 were considered significant.
RESULTS
Plasma Analysis
For group 1 volunteers and the 6-h scan time, the peak plasma activity occurred between 70 and 80 s after injection in all subjects and decreased rapidly to 3.6%–7.9% of the peak level in 10 min. Analysis of the unmetabolized compound by TLC demonstrated a high parent fraction of 123I-5IA in the plasma (89.9% ± 5.1%) in the first minute. These values were estimated using Equation 1, which showed good fitting for all volunteers. 123I-5IA was rapidly metabolized and the unchanged fraction represented 46.6% ± 9.5% and 27.4% ± 6.0% of total plasma activity at 20 and 60 min, respectively. Figure 2 shows typical radioactivity in whole plasma and the free parent compound of 123I-5IA throughout the scan time. For the 90-min scan time, the second group of volunteers, the results were similar to those described for the 6-h scan time.

Typical plasma time–activity curves show radioactivity in whole plasma (○) and free parent (•) compound of 123I-5IA acquired throughout scan time (360 min) after intravenous bolus injection of 172 MBq 123I-5IA in 20-y-old man (subject 4). Inset shows same plasma time–activity curves for short period (20 min). Peak plasma activity occurred at 80 s after injection of 123I-5IA and decreased rapidly to 5.9% of peak level in 10 min.
The suitability of using venous blood sampling for the input function was confirmed by the good agreement of the radioactivity in whole plasma (0.00099 ± 0.00015 [arterial] and 0.00100 ± 0.00013 [venous] %dose/mL at 90 min; 0.00090 ± 0.00011 [arterial] and 0.00094 ± 0.00012 [venous] %dose/mL at 120 min) and the ratio of measured free parent fraction between arterial and venous blood samples drawn at 90 and 120 min (0.29 ± 0.05 [arterial] and 0.27 ± 0.04 [venous] at 90 min; 0.20 ± 0.04 [arterial] and 0.20 ± 0.04 [venous] at 120 min). Thus, venous blood sampling is a simple and acceptable choice for input function following 2 h after injection of 5IA.
The results obtained by TLC were in agreement with those from HPLC at 1, 3, 10, 30, 60, and 120 min after injection. The labeled metabolites were not identified, but they were more polar than the parent compound and may not cross the blood–brain barrier.
Brain Imaging Analysis
For all volunteers (first and second groups), 123I-5IA-SPECT images clearly revealed the cortical regions, cerebellum, thalamus, brain stem, and basal ganglia. Initially, within the first 20 min, the images seemed to have a similar pattern as cerebral blood flow. Subsequently, the thalamus and brain stem showed higher uptake than the other structures in the brain, which became more prominent throughout the scan time. Figure 3 shows a typical 6-h scan time distribution and the dynamics of 123I-5IA in the brain throughout the scan time. No side effects were observed during the scan in any volunteers.
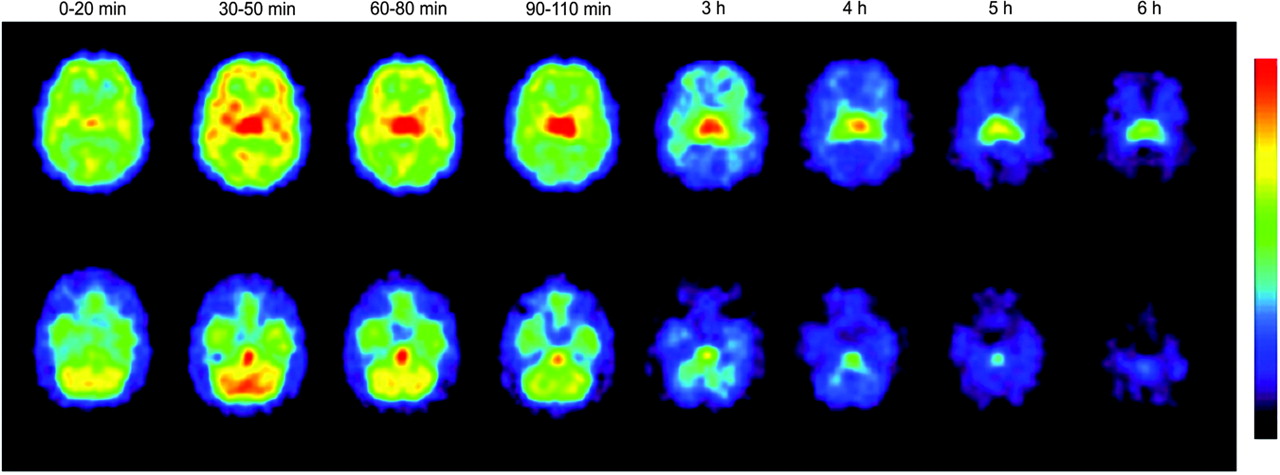
Selected slices of human brain after intravenous bolus injection of 172 MBq 123I-5IA in 20-y-old man (subject 4). Reconstructed tranverse slices were summed according to scan time (0–20 min, 30–50 min, 60–80 min, 90–110 min, 3 h, 4 h, 5 h, and 6 h). Top row of slices represents midpart of brain (frontal, temporal, occipital, thalamus, and basal ganglia). Bottom row represents slices from inferior part of human brain (cerebellum, brain stem, and temporal cortex). 123I-5IA SPECT images clearly show cortical regions, cerebellum, thalamus, brain stem, and basal ganglia. Thalamus and brain stem exhibited higher uptake than other structures in brain, which became more prominent throughout scan time.
Figure 4 shows typical 6-h scan time–activity curves of 123I-5IA in the thalamus, brain stem, and frontal cortex. The concentration of radioactivity was highest in the thalamus followed by the brain stem. An intermediate accumulation of radioactivity of 123I-5IA was observed in the cerebellum, basal ganglia, and cortical regions. In all subscripts, the peaks of radioactivity in the thalamus and brain stem occurred at 90–110 min and 70–90 min after injection of 123I-5IA, respectively. These peaks were observed later than in the other brain regions, which were found at around 30–50 min. A differential dissociation of 123I-5IA from the binding sites was noted in the brain. The cortical regions, basal ganglia, and cerebellum showed an earlier dissociation than the brain stem and thalamus. These findings reflected a distinct regional distribution of nAChRs in the human brain (27,28).
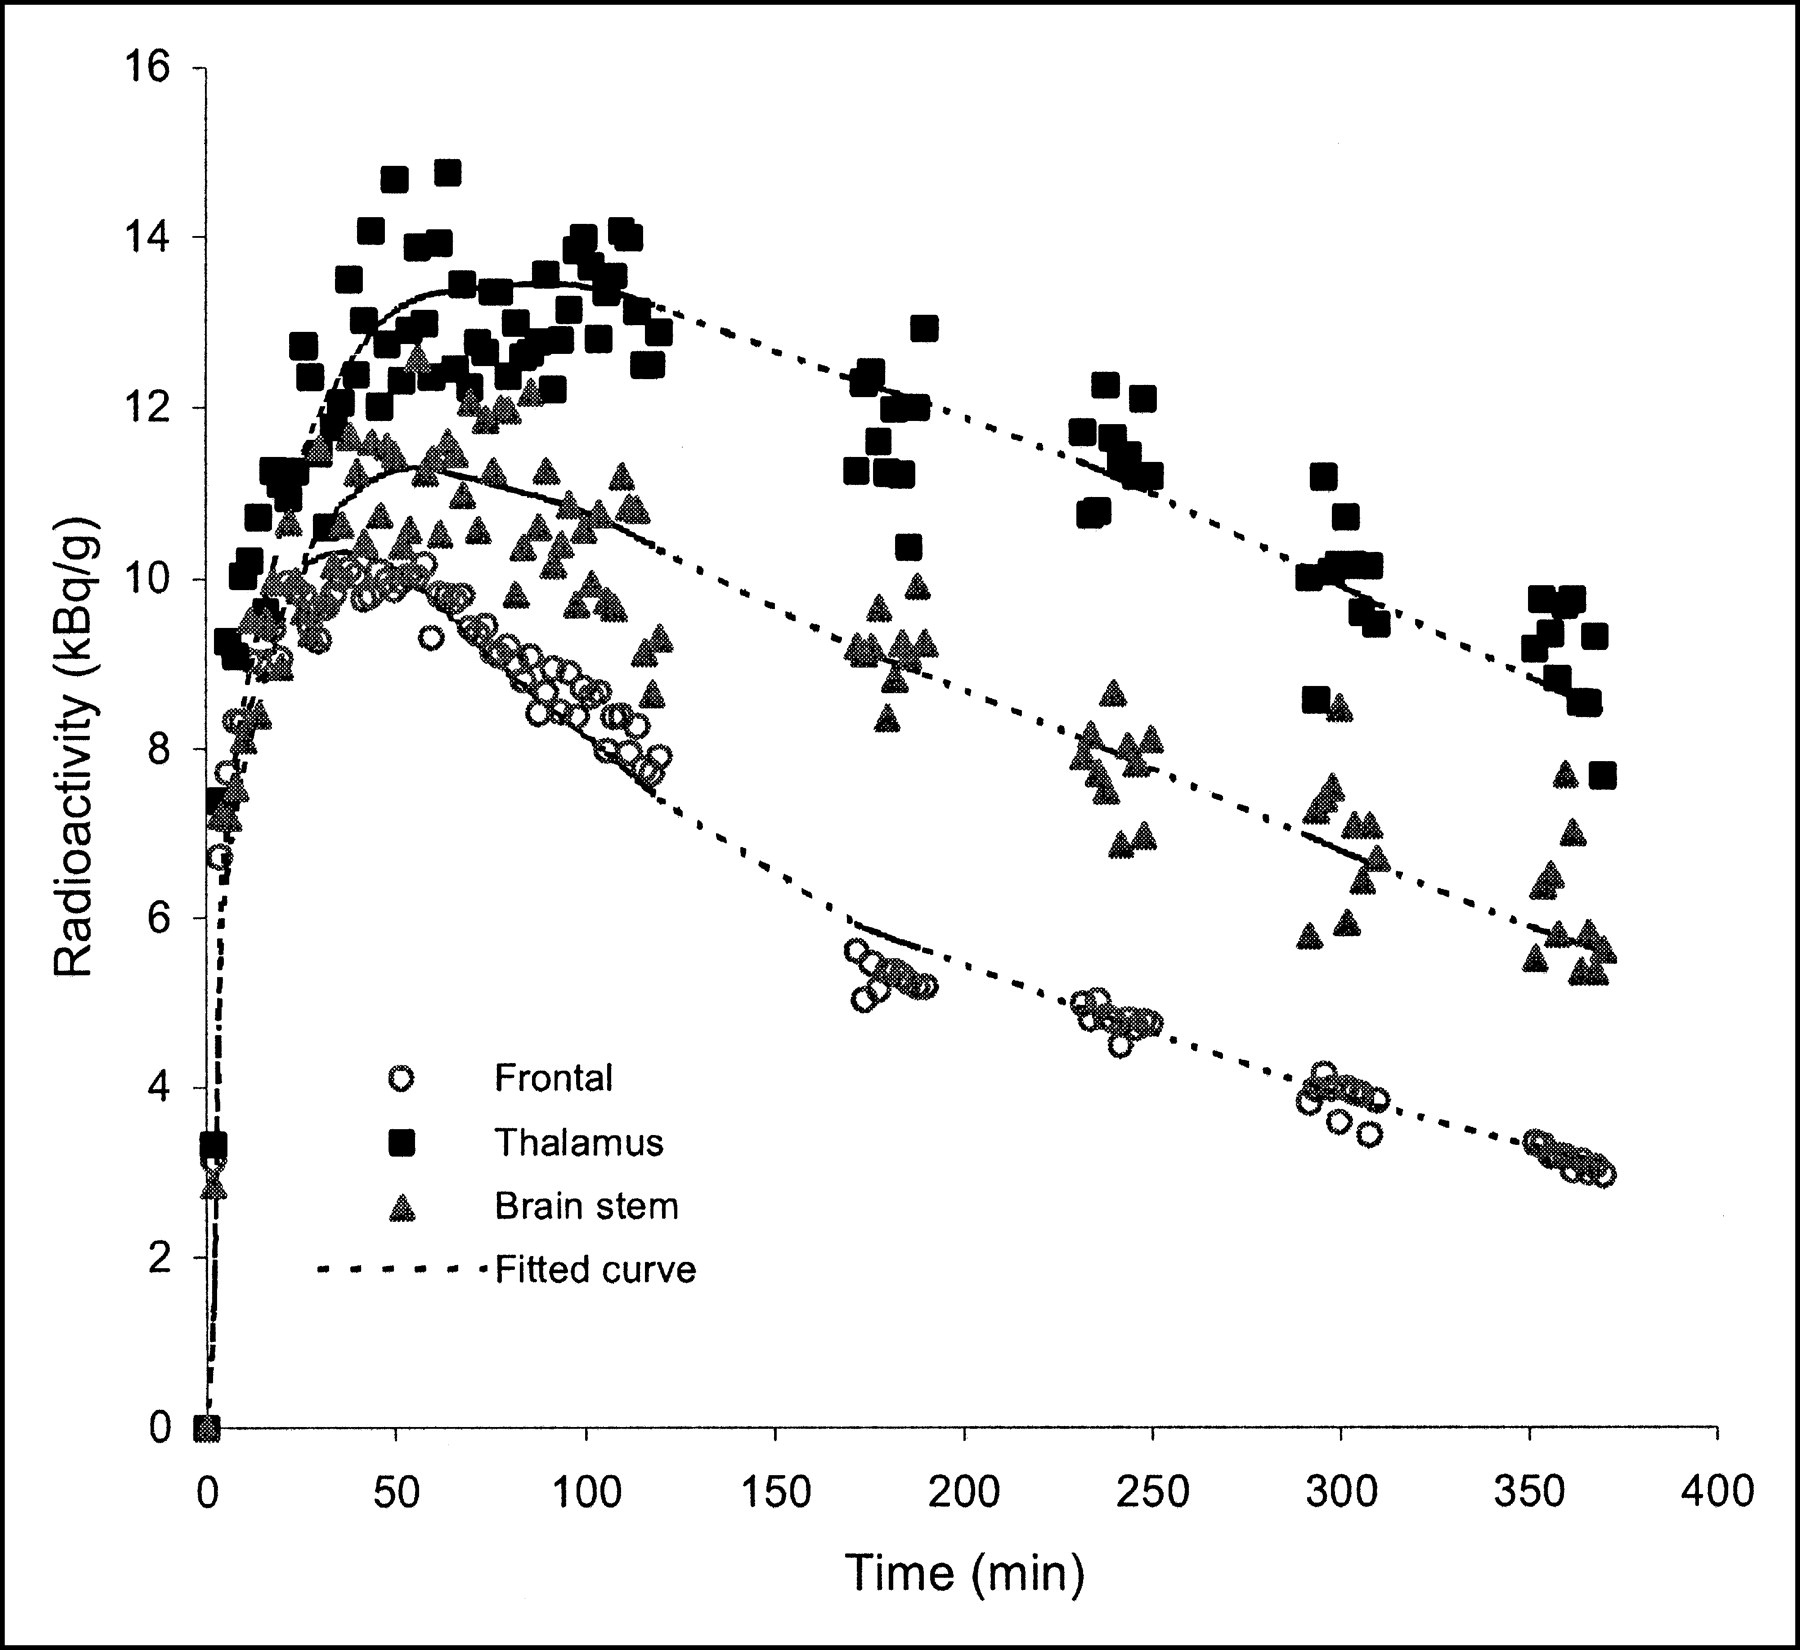
Typical time–activity curves of 123I-5IA in regions of human brain after intravenous injection of 172 MBq 123I-5IA in 20-y-old man (subject 4). Concentration of radioactivity in brain was highest in thalamus followed by brain stem. Little accumulation of radioactivity was observed in cortical regions (represented by frontal cortex).
For the second group of volunteers, the pattern of radioactivity in the brain was almost the same as that described for the first group, except for the thalamus. The peak of radioactivity in the thalamus could not be seen precisely throughout the scan time. The time–activity curve in the cortical regions, basal ganglia, and cerebellum had a similar pattern observed during the 6-h scan time.
Based on these data, a quantitative analysis of nAChR density was performed. First, the 3-compartment model analysis was performed. The 4-parameter model configuration could not appropriately fit the present data and inadequately identified the rate parameter constants. Variable lower VT values in different regions in the human brain were also observed (data not shown). The 3-compartment model could not provide goodness of fit, indicating that the association and dissociation of ligand from the specific receptor compartment were rapid, and the nonspecific and specific compartments mixed instantaneously. Thus, all analyses were made with the 2-compartment model.
Table 1 summarizes the VT, K1′, and k2′ values from 2-compartment model analysis in different brain regions for each subject studied in the first group. The highest VT values were found in the thalamus (ANOVA, P < 0.01). Subsequently, the brain stem, cerebellum, and basal ganglia were assembled in a group of moderate α4β2 binding density. No statistically significant difference was observed between them. The VT values of the brain stem and cerebellum were higher (P < 0.05) than the values for the cortical regions (frontal, parietal, temporal, and occipital cortices), whereas for the basal ganglia this finding was observed only for the occipital cortex (P < 0.05). The remaining regions were arranged in a group of low-binding density. The relative performance of the 2-parameter model configuration can be evaluated through comparison of the estimated parameters using %COV. The estimation of parameters VT, K1′, and k2′ is relatively stable and the variation was small in each subject across all brain regions (Table 1). The intersubject variability was also reasonable and generally ranged from 11% to 21%.
123I-5IA Parameter Estimates for 2-Compartment, 2-Parameter Model Analysis Using 6-Hour Scan Time (6 Healthy Volunteers)
Figure 5 illustrates a typical example of graphical analysis applied to ROIs from the frontal cortex, thalamus, and brain stem. The linear region begins at about 4 min after injection (t*). The same time point (t*) was observed for all subjects across all regions. The slope is greatest for the ROI from the thalamus, followed by the brain stem and frontal cortex. Table 2 lists VLG, K*1, and k*2 determined by the graphical analysis in the brain. The pattern of distribution of VLG in the human brain was the same as that of VT in all subjects at the 6-h scan time, as was the variability accounted for by %COV.

Typical example of graphical analysis applied to ROIs from frontal cortex, thalamus, and brain stem (subject 4). At about 4 min after injection (t*), a representative plot of ROI is linear. Slope of this linear function represents total distribution volume plus blood contribution (VLG). Greatest slope is for ROI from thalamus, followed by brain stem and frontal cortex. Slopes representative of linear curves are 10.5, 15.7, and 13.3, respectively.
123I-5IA Parameter Estimates for Graphical Analysis from 2-Compartment Model Using 6-Hour Scan Time (6 Healthy Volunteers)
Parameter estimates as a function of the duration of data used in the fits from the 6-h scan time are shown in Table 3. Estimations were made using a short time interval (0–90 min) for the entire 360-min sequence. The estimation of parameters VT, K1′, and k2′ is quite stable in the cortical regions and basal ganglia throughout the time intervals. On the other hand, some variability was observed in the thalamus, brain stem, and cerebellum for a shorter scan time. One-way ANOVA demonstrated no significant difference between those time intervals across all regions.
123I-5IA Parameter Estimates For 2-Compartment, 2-Parameter Model Analysis with 6-Hour Scan Time at Different Time Intervals
Table 4 summarizes the receptor parameter values (VT, K1′, and k2′) from the 2-compartment model analysis in different brain regions for each volunteer in a short scan time (90 min). Results of the first 6 volunteers (subjects 1–6, group 1) were generated from a 6-h scan time when a short time interval (0–90 min) was applied. Results of the remaining 15 volunteers (subjects 7–21, group 2) were calculated from a single 90-min scan time. To verify the homogeneity of VT values determined between these 2 groups of subjects, aged-matching comparisons were done. The VT values from the first group of subjects were compared with those from the second group with the same age. No statistical differences were observed between VT values for all regions in the brain between these 2 groups of subjects for the same age. The distribution of VT values for all subjects with a short scan time (first and second groups) had a pattern similar to that observed for a 6-h scan time. The thalamus showed also the highest VT value (ANOVA, P < 0.01).
123I-5IA Parameter Estimates for 2-Compartment, 2-Parameter Model Analysis with 90-Minute Scan Time
DISCUSSION
To our knowledge, this article describes the first quantitative study of 123I-5IA SPECT for the measurement of nAChRs in the human brain. There were several reasons for selecting 123I-5IA to quantitatively study nAChRs in the human brain. First, there were several previous studies of radioiodine-labeled compounds of these series with extremely high affinity and selectivity for the nAChR α4β2 subtype in vivo, with low nonspecific binding, good persistence in animal and human brain, and acceptable dosimetry for human use (19–24). Second, the procedure for the synthesis of 123I-5IA is not complicated, the radiochemical purity is high (>98%), the radiochemical yields are good (42%), and highly specific radioactivity can be achieved with this radiolabeling sequence (18). Third, the longer imaging time frame afforded with 123I (half-life = 13.2 h) and the prevalence of SPECT scanners in laboratories worldwide, with no requirement for an on-site cyclotron for positron-emitters, might provide some advantages, although the spatial resolution of SPECT systems is lower, and the quantitative accuracy of the SPECT data is poor compared with that of dedicated PET systems. Fourth, the satisfactory safety profile of this compound, with such a high specific activity, ensures that the administration dose of 123I-5IA is well below the threshold at which pharmacologic effects first appear (18–21,23,24).
The quantitative analysis of 123I-5IA was performed using a compartmental model. First, the 3-compartment model was chosen. This configuration might theoretically be a better choice for estimating the kinetic parameters for 123I-5IA; however, the 4-parameter configuration could not provide goodness of fit for the present data—namely, it seemed that the 123I-5IA in nonspecific and specific compartments mixed immediately. Therefore, 4-parameter kinetic analysis seemed to be an unsuitable choice for quantification of human nAChRs using 123I-5IA SPECT. Thus, the quantitative VT values in various regions of the human brain were estimated by 2-compartment model analysis. The 2-compartment model has a small number of parameters to be identified in the brain, making this choice simpler and acceptable for 123I-5IA. This fact could be observed by the relatively stable performance of the estimated parameters using %COV (Table 1).
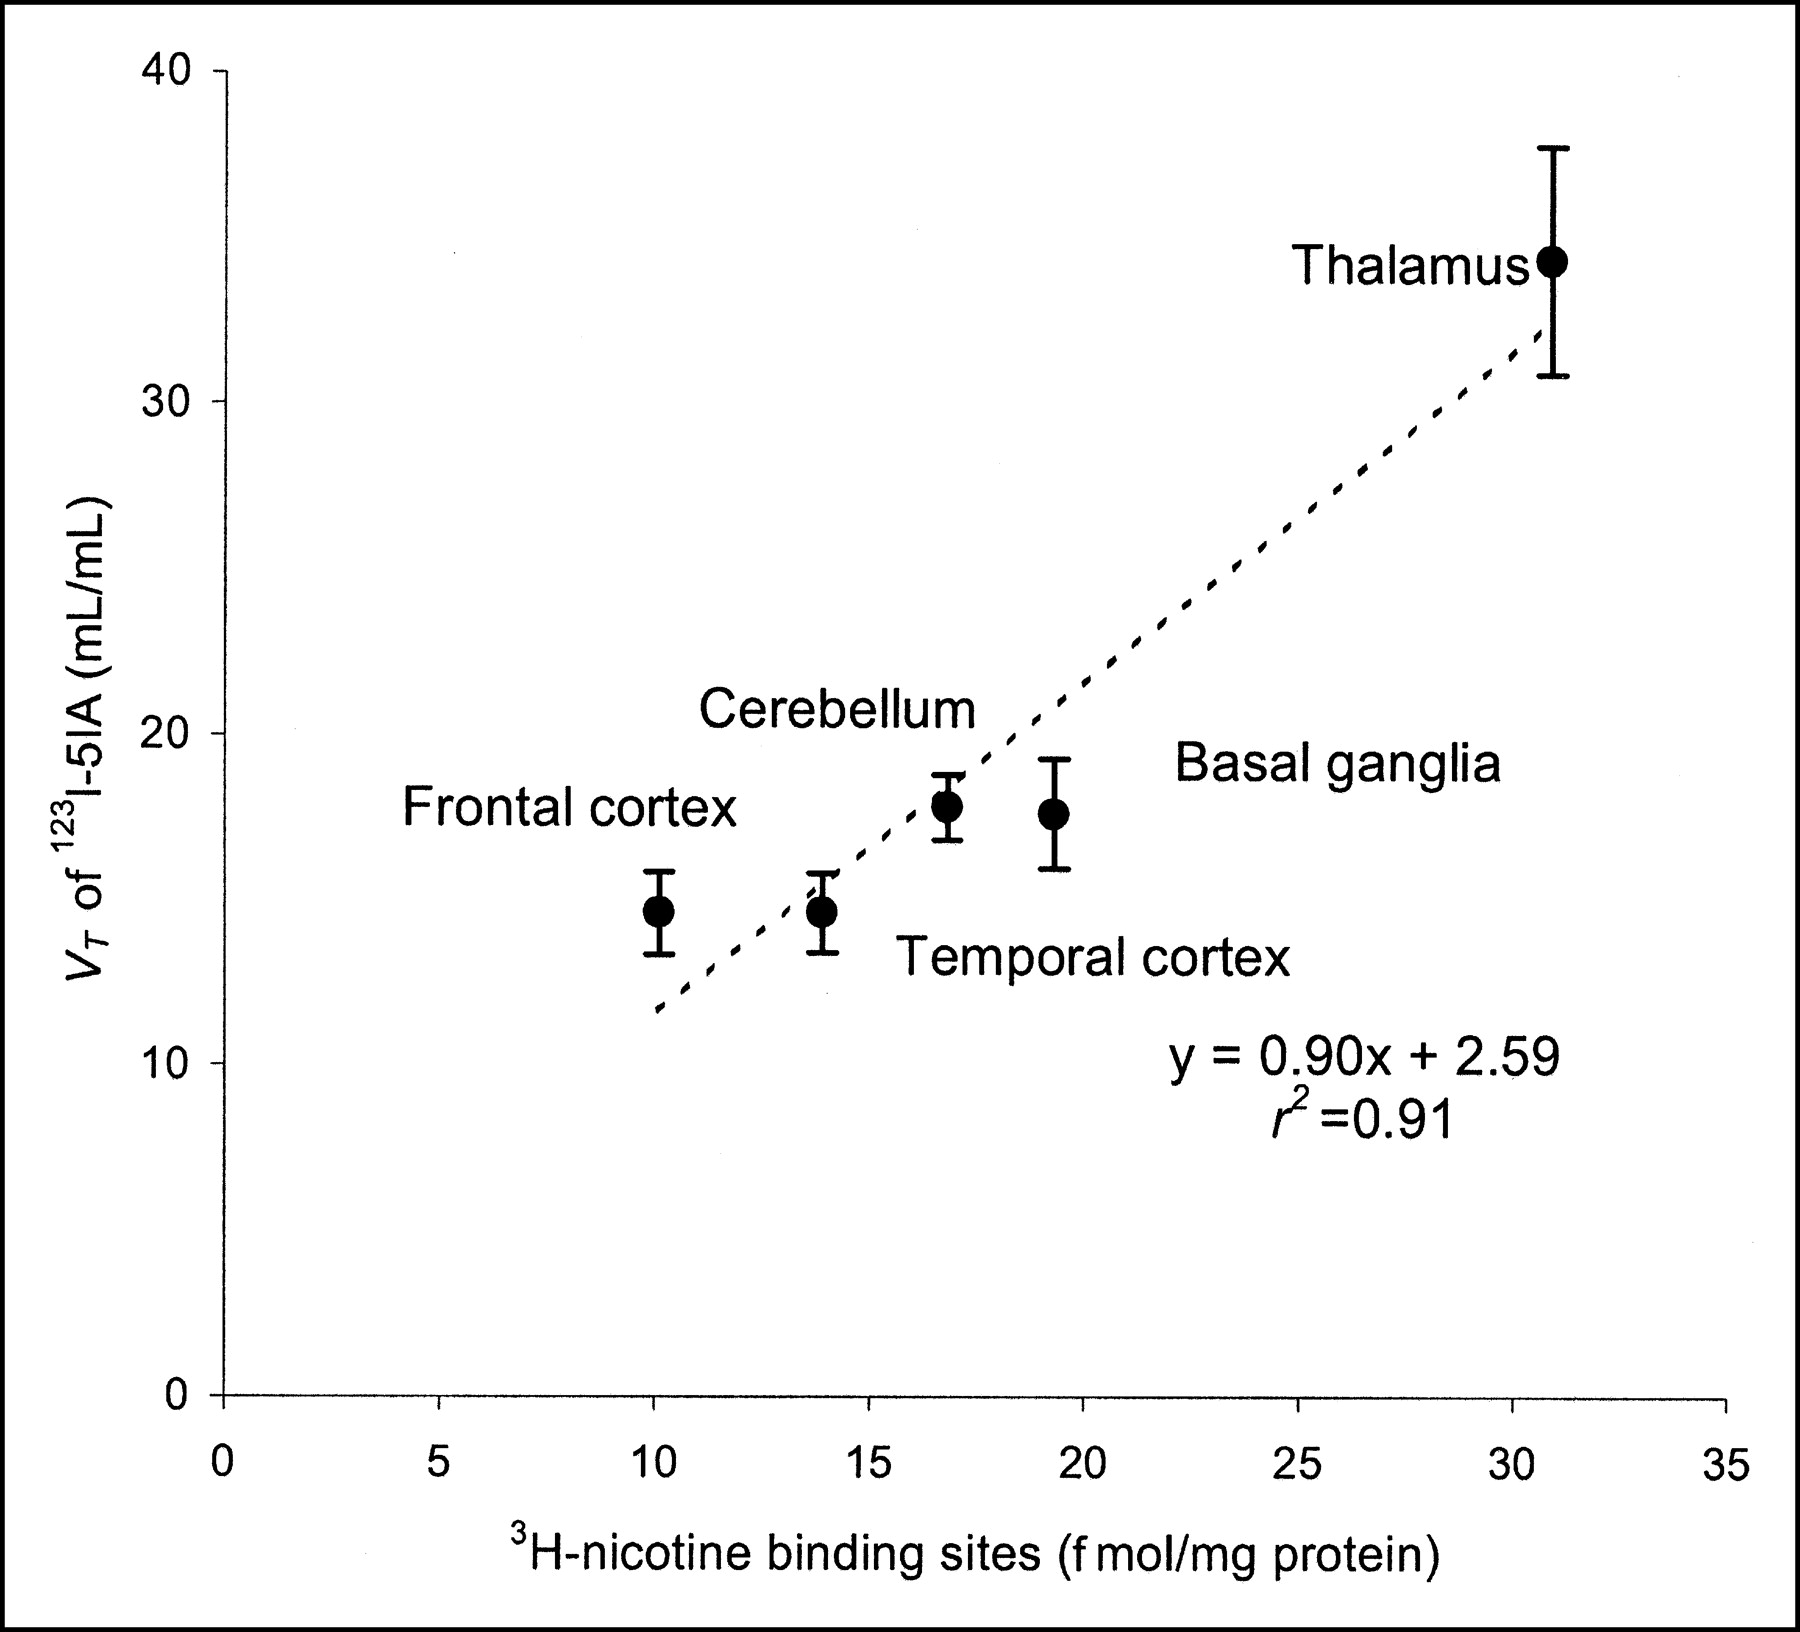
The VT values from 2-compartment model analyses using the 6-h scan time showed the highest density of nAChRs in the thalamus; moderate density in the brain stem, basal ganglia, and cerebellum; and low density in the frontal, parietal, temporal, and occipital cortices. This distribution is compatible with the known distribution of nicotinic receptors in humans (2). A previous autoradiographic study using 3H-epibatidine, which has similar affinity for the α4β2 subtype of nAChR, described 3 levels of density of nAChRs in the human brain (high, moderate, and low) (29). The results of the present study are consistent with those for almost all regions evaluated in the study of Marutle et al. (29). Shimohama et al. (10) described the regional distribution of nAChRs in human brain using (−)-3H-nicotine in an in vitro receptor assay study. The distribution volumes described for 123I-5IA at 360 min after injection correlated well with the nAChR densities measured using (−)-3H-nicotine (r2 = 0.91) (Fig. 6), although there is some variation at the area with low density of nAChRs. Some divergence in the affinity of these compounds to the nAChR α4β2 subtype, associated with some affinity toward other subunits in the brain, could explain these small differences (15,29,30). Thus, the possibility that 123I-5IA binds with other mammalian nAChR subtypes cannot be excluded (17,29,31). In addition, significant losses or upregulation of nAChRs in the brain have been related to various situations, such as normal aging, neurodegenerative diseases, and tobacco use (2,7–10,29). In this context, 123I-5IA will provide valuable information from living subjects in various clinical situations.

Correlation between distribution volumes described for 123I-5IA at 360 min after injection with those specific bindings for (−)-3H-nicotine in postmortem study (r2 = 0.91) (10).
Furthermore, although the density of the α4β2 subtype of nAChR in the cerebellum was lower in animals, a substantial presence was found in the human brain (2). Therefore, the cerebellum is an inappropriate reference region in quantitative studies using 123I-5IA in humans. The study also indicated that there is no other receptor-poor region that is appropriate as a reference region for SPECT (2). Thus, use of the reference region is not applicable to the quantification of nAChR in the human brain.
In the present study, the rate parameter constant K1′ showed relative low values (0.25 ± 0.04 in cerebellum at 90-min scan time, Table 4). The K1′ represents the delivery rate constant from the plasma to the tissue compartment (Cf+ns+s), and it is basically driven by the regional cerebral blood flow (F) and the single-pass extraction fraction of the ligand into the brain (E0). Considering that the cerebral blood flow is normal in the groups of subjects, the extraction fraction of 123I-5IA might be the reason for these lower values. Saji et al. (18) showed in an animal study that 123I-5IA has a moderate brain uptake index (BUI = 31 ± 6), which was lower than that of nicotine (BUI = 103 ± 12). These findings are in complete agreement with our results.
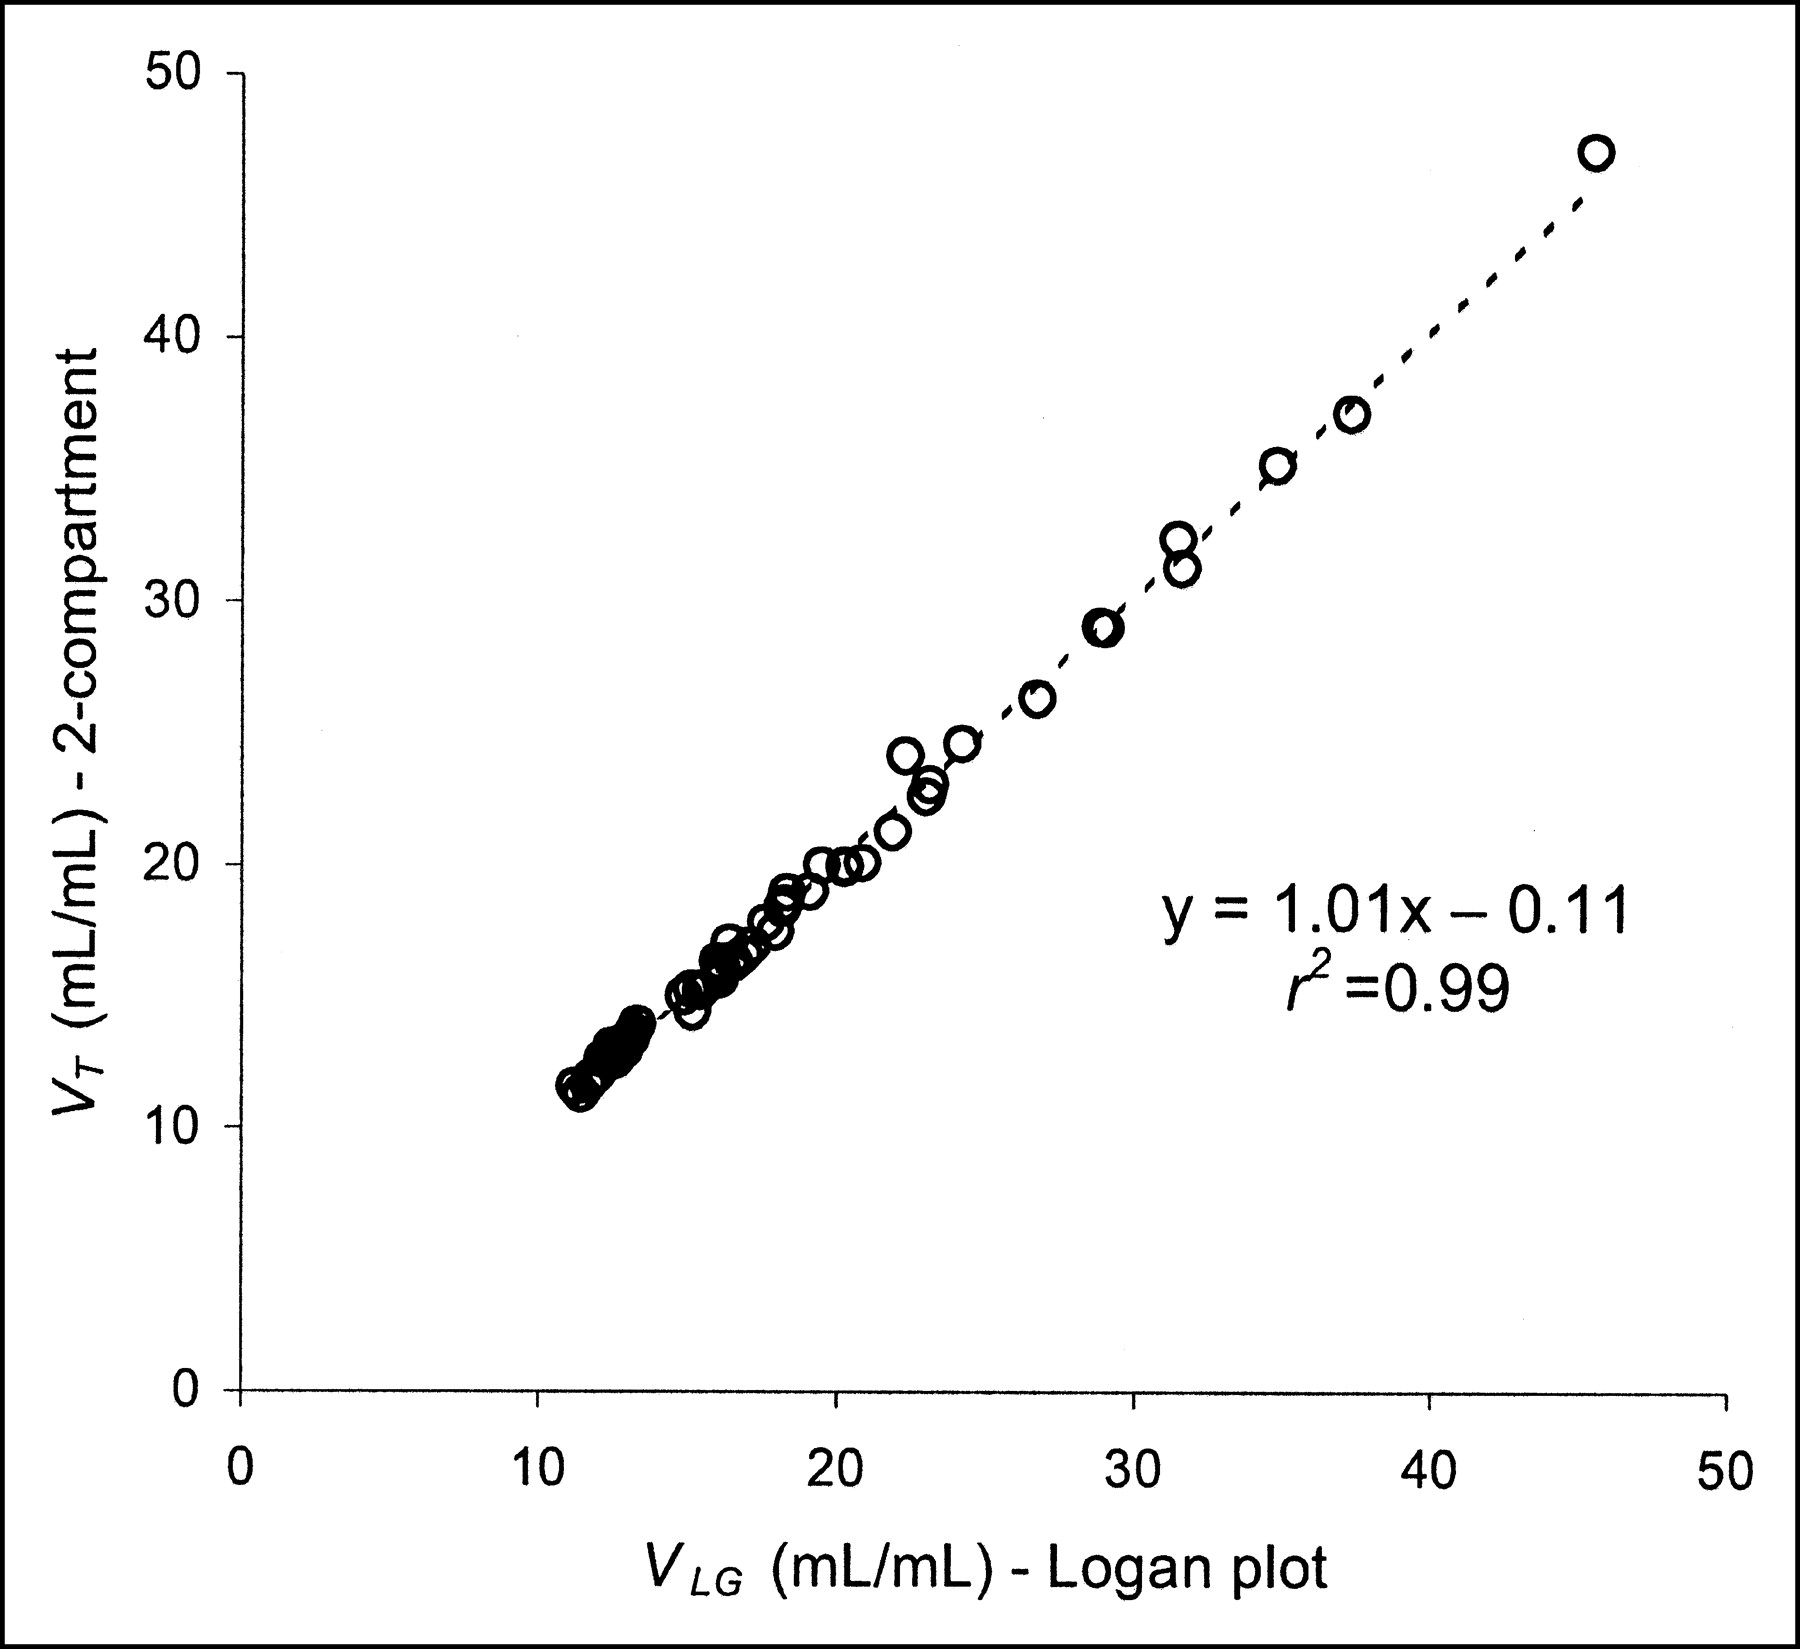
Besides the simplicity of the method and the independency of the model configuration of the tissue compartment, the application of graphical analysis for determination of distribution volumes (VLG) in receptor binding studies offers greater accuracy. The main outcome from this method of measurement can be estimated with much higher accuracy than individual parameters of radioligand kinetics (32). In the present study, the highest slopes correlated with those regions with higher densities of nAChRs in the human brain using 123I-5IA SPECT (2). The analysis of the correlation between VT and VLG values showed good agreement (r2 = 0.99) (Fig. 7) as well as between the transfer constant K1′ and K*1 (r2 = 0.96) (P < 0.01, for both). The results indicate that the graphical method showed essentially the same information of measurement of nAChRs using 123I-5IA SPECT with acceptable accuracy.

Analysis of correlation between distribution volumes from compartmental model (VT) and graphical analyses (VLG) performed during 360-min scan time. Circles represent VT and VLG values in various brain regions analyzed from all subjects in first group of volunteers. VT and VLG values from 2-compartment model and Logan plot analyses demonstrated high correlation index (r2 = 0.99) (P < 0.01).
Taking account of all factors that determine the VT values of 123I-5IA in the present study, 2 independent variables were identified: regions in the brain and length of data acquisition. The variable subject was not considered due to the uniform population evaluated in this study (age of subjects around 20 y in group 1 subjects). The variability of receptor densities and metabolism of 123I-5IA should be quite small in such a uniform population, and distribution volumes would be successfully estimated from data of a short scan time because biases caused by short data should be similar in all subjects. Thus, a factorial ANOVA was applied considering all factors together. The results showed that the length of the scan was not critical to determining the distribution volume in different brain regions. The factor region in the brain was significant and this finding can be easily explained by the differences in the VT values between those regions in the brain. Once both factors interacted as a single term (region length), the results showed no statistical significance, so the region and length effects can be assumed to be consistent across levels of the other factor. Therefore, a short scan time (i.e., 90-min) can be used to evaluate the distribution volume in human brain using 123I-5IA.
However, the factorial ANOVA has shown that the scan length was not of critical importance in determining the VT values in the human brain regions; the 6-h scan time seems to have allowed more sensitive evaluation of the thalamic region. That is because the kinetics of 123I-5IA in the human brain have some peculiarities for the thalamus (later peak of radioactivity in the brain around 110 min), making the longer scans more suitable for estimating the nAChRs in the thalamic regions.
Based on these results, another group of subjects (group 2) was included and scanned using a short scan time (90 min) (Table 4). To verify the reproducibility of measurement using a short scan time, subjects of around 20 y old were grouped (subjects 7–13). The VT values were calculated and their results were compared with those VT values calculated from the first group (using a 90-min time interval) for the same age (subjects 1–6). No significant difference was observed between them, confirming the reproducibility of the measurement with a short scan time.
Once the data for all volunteers (first group analyzed in a 90-min time interval and second group) were assembled in a single group (Table 4), the distribution of VT values showed a pattern similar to that described for the 6-h scan time, with the highest VT values for the thalamus (ANOVA, P < 0.01). Some studies have mentioned aged-related changes in the nicotinic neuroreceptors in the human brain (2,7,10), but our study did not observe statistically significant values. The inability to observe age-related changes in this study is probably due to the small number of subjects from different age groups. Further studies might be necessary to elucidate the age-related change in human nAChRs.
CONCLUSION
We have described a novel method for the quantitative analysis of nAChRs in the human brain using 123I-5IA. A 2-compartment model analysis (2-parameter configuration) was chosen to fit the present data, and results were relatively stable across all regions. Three different levels of density of nAChRs in the human brain (expressed as VT) were identified. The VT values showed the highest density of nAChRs to be in the thalamus; moderate densities were found in the brain stem, basal ganglia, and cerebellum, and low densities were found in the frontal, parietal, temporal, and occipital cortices. Good agreement was observed between VT values and autoradiographic studies done in vitro for nAChR density in human brain. A high correlation index was observed between distribution volumes from the compartmental model and graphical analyses. Our results indicate that 123I-5IA SPECT is suitable for the quantification of nAChRs in the human brain.
Acknowledgments
The authors thank Dr. Sadahiko Nishizawa, Hamamatsu Medical Photonics Foundation, for valuable comments, and Dr. Mahbubur Rahman, Department of Epidemiological and Clinical Research Information Management, Kyoto University, for advice regarding the statistical analysis. This work was supported in part by a grant from the Research for the Future Program of the Japan Society for the Promotion of Science (JSPS-RFTF97K00201), Grants-in-Aid for Scientific Research from the Ministry of Education, Science and Technology of Japan, a research grant for Longevity Sciences from the Ministry of Health and Welfare, and a grant from the Smoking Reseach Foundation. The authors thank Nihon Medi-Physics Co. Ltd., Japan, for providing sodium 123I-iodide.
Footnotes
Received Oct. 30, 2003; revision accepted Mar. 4, 2004.
For correspondence or reprints contact: Koichi Ishizu, MD, PhD, Department of Nuclear Medicine and Diagnostic Imaging, Graduate School of Medicine, Kyoto University, Sakyo, 606-8507, Kyoto, Japan.
E-mail: ishizu{at}kuhp.kyoto-u.ac.jp
REFERENCES
In this issue


Jump to section
Related Articles
Cited By...
- Quantification of Smoking-Induced Occupancy of {beta}2-Nicotinic Acetylcholine Receptors: Estimation of Nondisplaceable Binding
- The effects of donepezil on nicotinic receptor status in dementia: a 123I-5IA-85380 SPECT study
- Positron emission tomography imaging in dementia
- Temporal Change in Human Nicotinic Acetylcholine Receptor After Smoking Cessation: 5IA SPECT Study
- {alpha}4{beta}2 nicotinic receptor status in Alzheimer's disease using 123I-5IA-85380 single-photon-emission computed tomography
- 123I-5-IA-85380 SPECT Measurement of Nicotinic Acetylcholine Receptors in Human Brain by the Constant Infusion Paradigm: Feasibility and Reproducibility