


Abstract
We evaluated quantitative measurement series (MS) with 18F-FDG and PET and compared different quantification methods for prediction of individual survival in patients with metastatic colorectal cancer receiving chemotherapy with 5-fluorouracil, folinic acid, and oxaliplatin (FOLFOX). Methods: The study comprised 25 patients. All patients were examined before the onset of FOLFOX therapy and after completion of the first and fourth cycles. SUV, fractal dimension (FD), a 2-compartment model with computation of k1, k2, k3, and k4, and vascular fraction (VB) were used for data evaluation. Survival data served as a reference for the PET data. Discriminant analysis (DA), regression, and best-subset analysis were applied to the data. Results: Twenty of 25 patients died up to 801 d after the first PET study. A cutoff of 1 y (364 d) was used to classify the patients into 2 a priori groups, namely the short- and long-term survival groups. DA was used to predict the 2 categories using SUV and kinetic parameters of 18F-FDG metabolism as predictor variables. SUV provided a correct classification rate (CCR) ranging from 62% to 69%. SUV of the third MS resulted in a CCR of 69% as a single parameter. The best results were yielded by the use of kinetic parameters (k1, k3, VB, and FD) as predictor variables. CCR was 78% using kinetic 18F-FDG parameters of the first and third MS, in comparison with 69% for the corresponding SUVs. A multiple linear regression model was applied to the data to assess the relationship between individual survival and the PET data. The best-subset method revealed a correlation coefficient of 0.850 for the kinetic parameters of the first (k3, k4, VB, and FD) and third (k1, k2, k4, and VB) MS. Conclusion: The combination of kinetic parameters of the first and the third MS is acceptable for classification into a short or long survival class. Furthermore, even an individual prognosis of survival can be achieved using kinetic 18F-FDG parameters of the first and third MS.
PET with 18F-FDG is currently the most powerful noninvasive tool for imaging metabolic processes in patients. The greatest advantage of 18F-FDG PET over morphologic imaging modalities is in assessing treatment effects, since the anatomic changes that follow treatment frequently lag behind tumor response in terms of viability. However, using 18F-FDG PET for prediction of therapy response early in the course of a prolonged treatment regimen in patients with colorectal carcinomas has not been investigated adequately. The idea of this approach is that an accurate prediction of treatment failure may allow the oncologist to apply an alternative treatment regimen without subjecting the patient to the toxicity of the full treatment scheme.
The situation is more complicated when the task is to predict tumor response early in a course of a prolonged chemotherapeutic treatment, as in the patients with metastatic colorectal cancer in this study. It is known from other tumor entities, such as malignant lymphomas, that the use of static measurements and the calculation of the standardized uptake value (SUV) in follow-up may show a transient reduction or enhancement of the SUVs, which does not necessarily correlate with the long-term therapeutic outcome (1). Therefore, the key question, which is open at the moment, is, what is the most appropriate approach for 18F-FDG PET measurements in order to predict therapeutic outcome accurately and as early as possible in the course of a prolonged treatment course?
The purpose of this study was to quantitatively assess dynamic 18F-FDG PET measurement series (MS) and to compare different quantification methods (SUV, compartmental analysis, and noncompartmental analysis) for prediction of 2 survival groups (short and long term) on the basis of 1 to 3 18F-FDG MS early in the course of chemotherapy. Furthermore, we examined the impact of 18F-FDG PET follow-up MS on the prediction of individual survival. We studied patients with metastatic colorectal carcinomas who were scheduled for second-line chemotherapy with the new combined regimen 5-fluorouracil (FU), folinic acid (FA), and oxaliplatin (FOLFOX). The reported response rate of the FOLFOX scheme is up to 51%–67% in untreated patients and up to 25%–46% in previously treated patients (2,3).
MATERIALS AND METHODS
Patients
The study comprised 25 patients treated according to the FOLFOX protocol. Twenty of 25 patients died up to 801 d after the first PET study. The final evaluation included 20 patients with 43 metastases from primary colorectal tumors at the time of the first MS. All patients had previous chemotherapy based on FU and FA. Second-line chemotherapy based on the FOLFOX protocol was initiated because of nonresponse to the FU/FA protocol according to the criteria of the World Health Organization (WHO). Patients received oxaliplatin, 85 mg/m2 intravenously, for 2 h on day 1; FA, 500 mg/m2 intravenously, for 2 h on days 1 and 2; and FU, 1,500 mg/m2 intravenously, as a continuous infusion on days 1 and 2. The treatment was repeated every 2 wk and continued until progression or unacceptable toxicity occurred. Patients with unacceptable toxicity were not included in the study. Most of the monitored metastases were in the liver (n = 40), some were in the lung (n = 2), and 1 patient had a local recurrence. The reference for the 18F-FDG data was patient survival. Death of patients included in the study was related to malignancy.
All patients were examined in 3 consecutive studies. The interval between the FU/FA protocol and the FOLFOX chemotherapy was at least 4 wk. The first 18F-FDG MS was performed within 1 wk before onset of FOLFOX chemotherapy and served as a baseline. The second 18F-FDG MS was done after completion of the first cycle, and the third 18F-FDG MS was done after the completion of the fourth cycle (3 mo after the initiation of FOLFOX and parallel to the restaging process). Informed consent was obtained from each patient. The study was performed in accordance with the institutional review board and the local Ethical Committee of the University of Heidelberg.
Data Acquisition
Dynamic PET studies were performed after intravenous injection of 300–370 MBq of 18F-FDG for 60 min with a 23-frame protocol (10 frames of 1 min, 5 frames of 2 min, and 8 frames of 5 min). 18F-FDG was prepared according to the method described by Toorongian et al. (4).
A dedicated PET system (ECAT EXACT HR+; Siemens Co.) based on the block detector technology, with an axial field of view of 15.3 cm and operated in septa-extended (2-dimensional) mode, was used for patient studies. Transmission scans were obtained for a total of 10 min before radionuclide application for attenuation correction. An image matrix of 256 × 256 pixels was used. The images were reconstructed using an iterative reconstruction algorithm (weighted least-squares method, ordered subsets, 4 subsets, 6 iterations, median root prior) running on a Pentium III platform (600 MHz, double processor; Intel Corp.) and the Windows 2000 Professional operating system (version 4.0; Microsoft Co.), with 512 MB of random-access memory (RAM). Details on image reconstruction are described elsewhere (5,6).
Data Analysis
The dynamic PET data were evaluated using the software package PMod (provided by the University of Zürich, Switzerland) (7,8). Time–activity curves were created using volumes of interest (VOIs). We used for the basic analysis the semiquantitative approach based on the calculation of a distribution value, for which the term standardized uptake value was introduced by Strauss and Conti (1): SUV = tissue concentration (MBq/g)/(injected dose [MBq]/body weight [g]). The 56- to 60-min uptake values served for the quantification of the 18F-FDG SUV data.
In general, a detailed quantitative evaluation of tracer kinetics requires the use of compartment modeling. A 2-tissue-compartment model is standard methodology for the quantification of dynamic 18F-FDG studies (9). For the input function, the mean value of the VOI data obtained from the descending aorta was used. Noise in the input curve affects the parameter estimates. Therefore, we used a preprocessing tool available in PMod software that allows a fit of the input curve, namely by a sum of up to 3 decaying exponentials, to reduce noise.
The rate constants k1–k4 were calculated using a 2-tissue-compartment model implemented in the PMod software taking into account the vascular fraction (VB) in a VOI. The rate constants k1 and k2 refer to, respectively, forward and reverse transmembrane transport of 18F-FDG, whereas k3 and k4 refer to phosphorylation and dephosphorylation, respectively. VB improves the model by considering blood activity within the target area, which can be a significant fraction of the total tissue activity. Details about the applied compartment models are described by Burger and Buck (8). The unit for rate constants k1–k4 is 1/min, whereas VB and SUV are relative measures.
In addition, a noncompartment model based on the fractal dimension (FD) was applied to the data (10). As already shown by other investigators, the FD is a parameter for heterogeneity. The program is based on the box-counting method (10). Standardized model parameters were used for data analysis, with a subdivision in 7 × 7 boxes and a maximum SUV of 20. For the mentioned model variables, the values of FD vary from 0 to 2 and are a parameter for a deterministic or more chaotic distribution of the tracer activity over time. For this purpose, no input function is needed (11).
The data were evaluated statistically using the Statistica software package (version 6.0; StatSoft Co.) on a personal computer (600-MHz Pentium III double processor and 512 MB of RAM) running with the Windows 2000 Professional operating system. Besides SUV and FD, the kinetic parameters (k1, k2, k3, k4, and VB) of up to 2 MS were included in the evaluation. For patients with more than 1 metastasis in follow-up, we handled each metastasis separately and directly compared the kinetic data for each metastasis with the individual survival data. Whereas SUV and FD were provided for each metastatic lesion, kinetic data were missing for 2 metastases of the first MS and 4 of the second MS. One reason for the missing values was problems with tracer application, and a second reason was the disappearance of a few metastatic lesions after chemotherapy.
We chose 2 statistical procedures for analysis of the 18F-FDG data. The first approach was based on a 2-group classification, namely a short- and a long-term survival group, and used a cutoff of 1 y (364 d). Referring oncologists use 1-y survival as a criterion for the evaluation of response after second-line chemotherapy. Discriminant analysis (DA) was then applied to determine which PET MS and which variables discriminate best between these 2 a priori–defined groups. The second approach was based on a multiple linear regression model to examine the relationship between individual survival time (dependent variable) and SUV on the one hand and individual survival time and some of the kinetic parameters on the other hand. A maximum of 8 independent variables and a combination of up to 2 MS were used for this analysis. Based on the best-subset analysis, 8 variables that showed the highest significant correlation to survival were used as independent variables. A χ2 fit was applied as a criterion for the quality of the fit. Scatterplots of individually predicted and observed values for survival time were used to assess the appropriateness of the fit.
RESULTS
A patient who partially responded to therapy is shown in Figure 1. The quantitative data demonstrated a continuous decrease in SUV, almost constant VB values, a decrease in k1, and a strong decrease in k3 in follow-up (Table 1). Survival was 712 d. In contrast, Figure 2 shows a patient with a metastasis in the left liver lobe who had a transient response to treatment. The quantitative data showed a slight increase in SUV and almost stable FD values. A temporary decrease in k1 and k3 paralleled the transient therapy response (Table 2). Survival was 484 d.
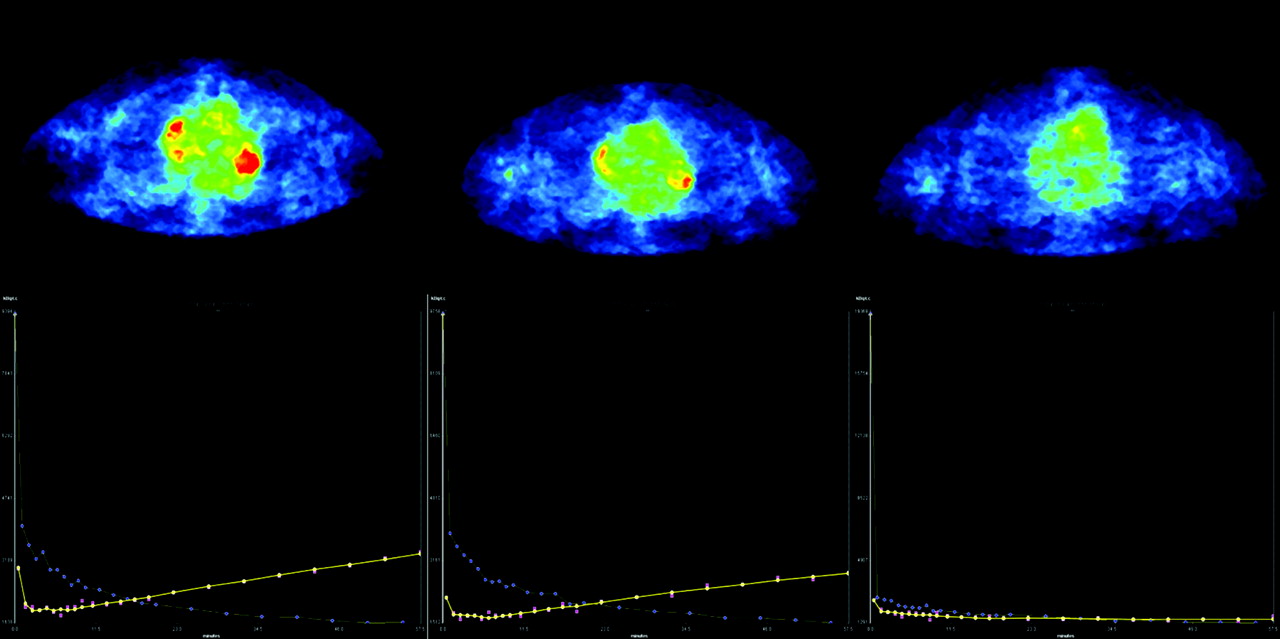
(Top) Transverse images from the first MS (left), second MS (middle), and third MS (right) of a patient with colorectal carcinoma metastatic to the hilum of the left lung. The metastasis partially responded to FOLFOX chemotherapy (survival was 712 d). PMod software evaluated the PET images, which are standardized and can be compared visually (SUV images). (Bottom) Corresponding time–activity curves. Yellow = 18F-FDG kinetics in metastasis; purple = 18F-FDG kinetics in an artery. Corresponding 18F-FDG kinetic data are in Table 1.

(Top) Transverse images from the first MS (left), second MS (middle), and third MS (right) of a patient with a metastasis in the left liver lobe. The metastasis showed a transient response and then progressed (survival was 484 d). The images are standardized and can be compared visually (SUV images). (Bottom) Corresponding time–activity curves. Yellow = 18F-FDG kinetics in metastasis; purple = 18F-FDG kinetics in an artery. Corresponding 18F-FDG kinetic data are in Table 2.
18F-FDG Kinetic Data for Follow-up of Lung Metastasis of Patient Presented in Figure 1
18F-FDG Kinetic Data for Follow-up of Liver Metastasis of Patient Presented in Figure 2
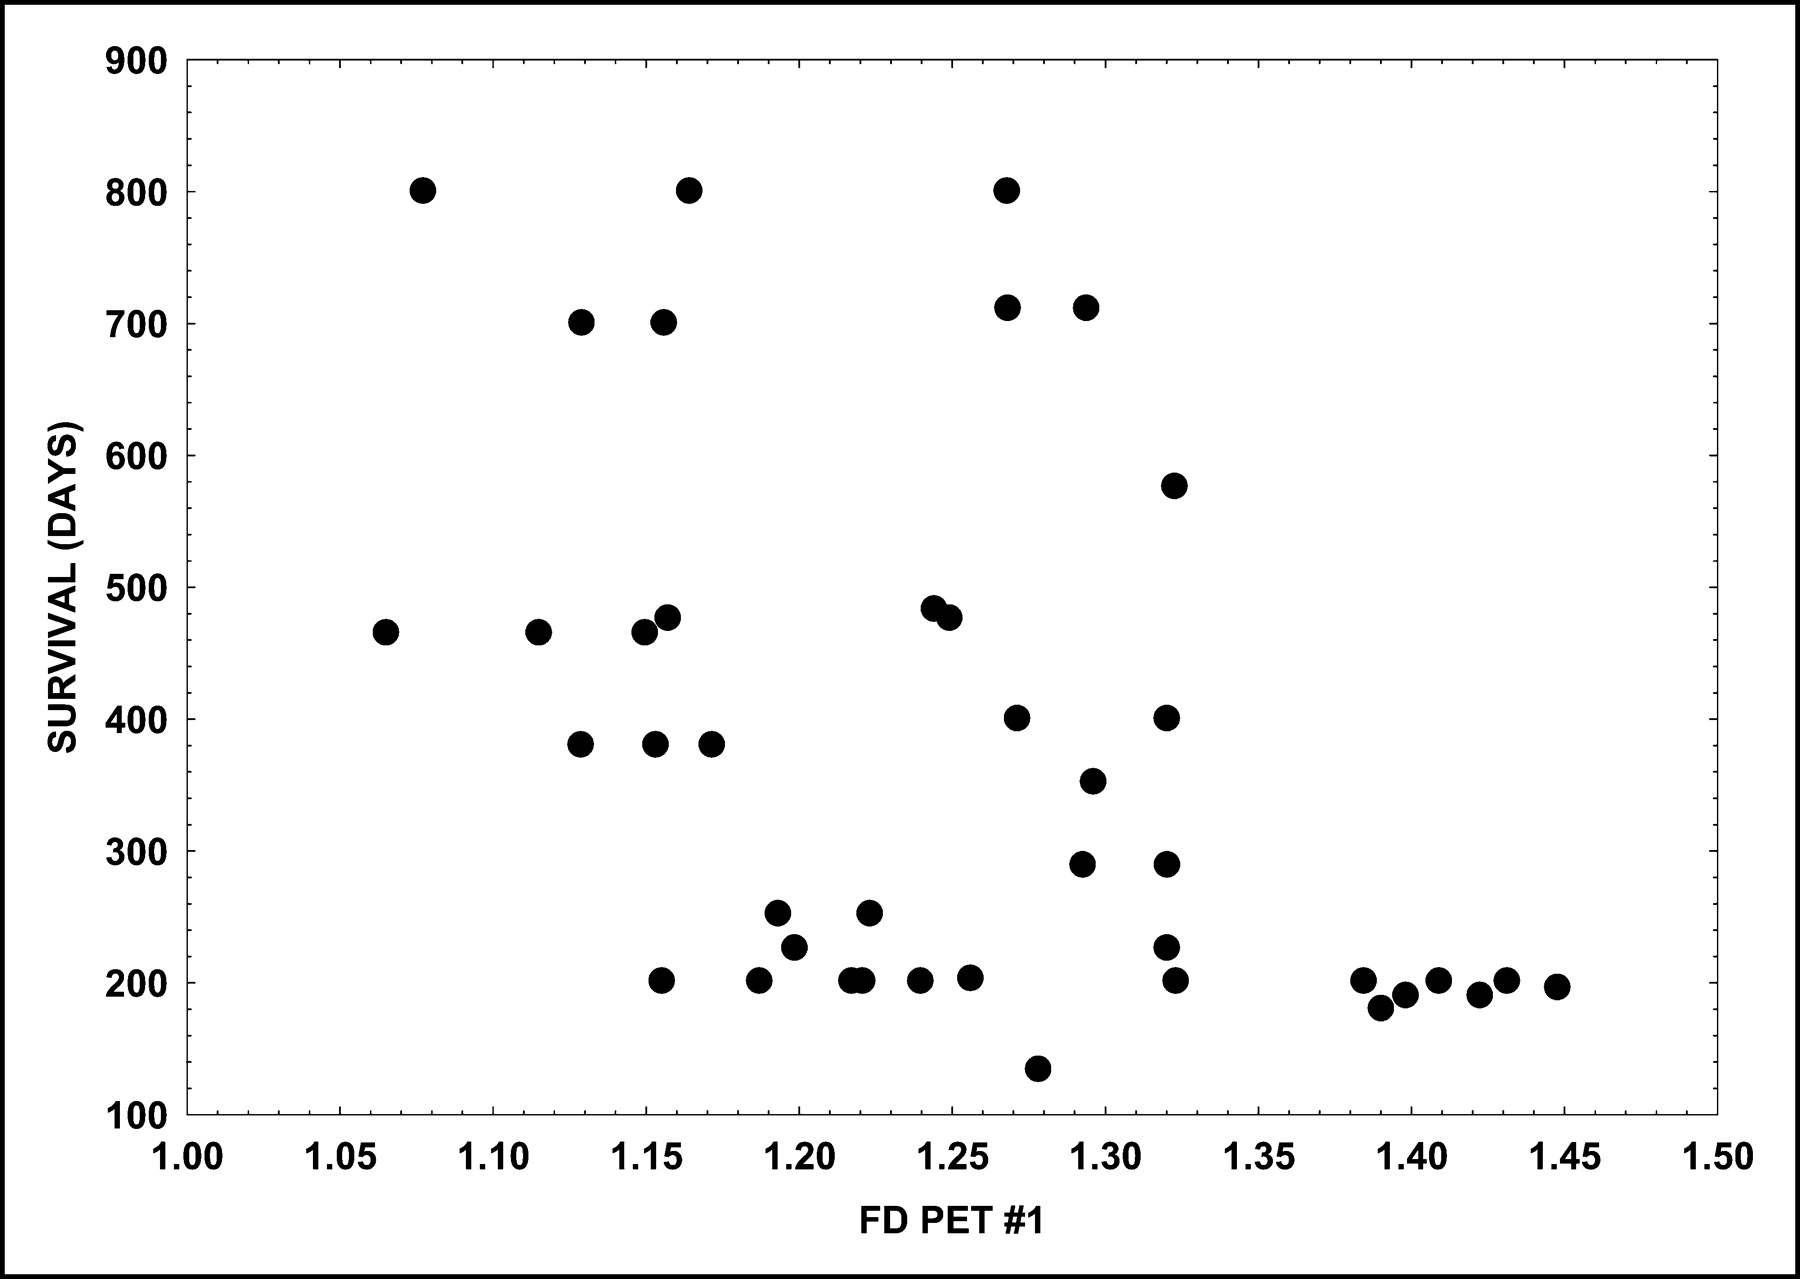
A scatterplot of the SUV of the first MS and the survival time demonstrated that metastases with a baseline SUV greater than 6.0 were associated with a survival of 200 d or less (Fig. 3). Metastases belonging to the group of patients with a survival of at least 700 d showed an initial SUV of less than 4.0. However, the low-uptake group also included metastases from patients with a short survival. The scatterplot of the FD of the first study and the survival time demonstrated that metastases with a baseline FD exceeding 1.35 were associated with a short survival (<200 d), as shown in Figure 4. The results show that both a high baseline SUV (>6.0) and a high baseline FD (>1.35) in the metastases are criteria for a poor prognosis and a short survival.

Scatterplot of metastasis SUV of first MS (PET #1) vs. survival time.

Scatterplot of metastasis FD of first MS (PET #1) vs. survival time.
DA was used to classify the 2 a priori–defined groups (target variables). The predictor variable for DA was either SUV or the combination of k1, k3, VB, and FD of the 18F-FDG kinetics derived from 1 or 2 MS. In general, SUV provided a correct classification rate (CCR) ranging from 62% to 69% for both groups (Table 3). SUV was generally superior for the CCR of the group with longer survival, compared with the group with shorter survival. In particular, the SUV of the third MS demonstrated the highest CCR for both groups (69%) as a single parameter and was comparable to the combined use of the SUV of the first and third MS. However, better results were yielded by the kinetic parameters than by SUV, in particular for prediction of the group with shorter survival (Table 4). The combination of the first and second MS demonstrated a CCR of 72% for kinetic data versus 64% for SUV, whereas the first and third MS showed a 78% CCR for kinetic data versus 69% CCR for SUV.
Discriminant Analysis Results Using Only SUV of Metastases as Independent Variable for Prediction of 2 Groups Defined by 364-Day Survival
Discriminant Analysis Results Using 4 Kinetic Parameters (k1, k3, VB, FD) of Metastases as Independent Variables for Prediction of 2 Groups Defined According to 364-Day Survival
A multiple linear regression model was applied to the data to assess the relationship between individual survival times and 18F-FDG kinetics (SUV and kinetic parameters). Use of SUV as a single independent variable led to a low correlation with the observed survival data (Table 5), whereas best results were obtained by use of the SUV of the second and third MS (r = 0.564), followed by use of the SUV of the first and third MS (r = 0.521). The regression model was then applied to the kinetic data of up to 2 MS (independent variables) and the individual survival times. Table 6 was based on the best-subset method for selection of the independent variables among the kinetic data and the SUV of up to 2 MS for the multiple regression analysis. In general, the correlation coefficients were higher for the selected kinetic parameters than for SUV alone. The highest correlation coefficients were observed for the combination of the second and third MS (r = 0.901) and for the first and third MS (r = 0.850). Based on the best-subset analysis, the k3, k4, VB, and FD of the first MS and the k1, k2, k4, and VB of the third MS contributed most to a high correlation with the observed survival time. Figure 5 demonstrates the scatterplot for the observed and predicted survival data using the selected kinetic variables of the first and third MS. Table 7 shows all patients, the number of metastatic lesions evaluated using PET, the observed survival time, and the predicted survival based on the first and third MS according to Table 6. For patients with more than 1 metastatic lesion, the range for predicted survival is given. The median value of the absolute residuals of predicted survival is 58 d (mean, 76 d).
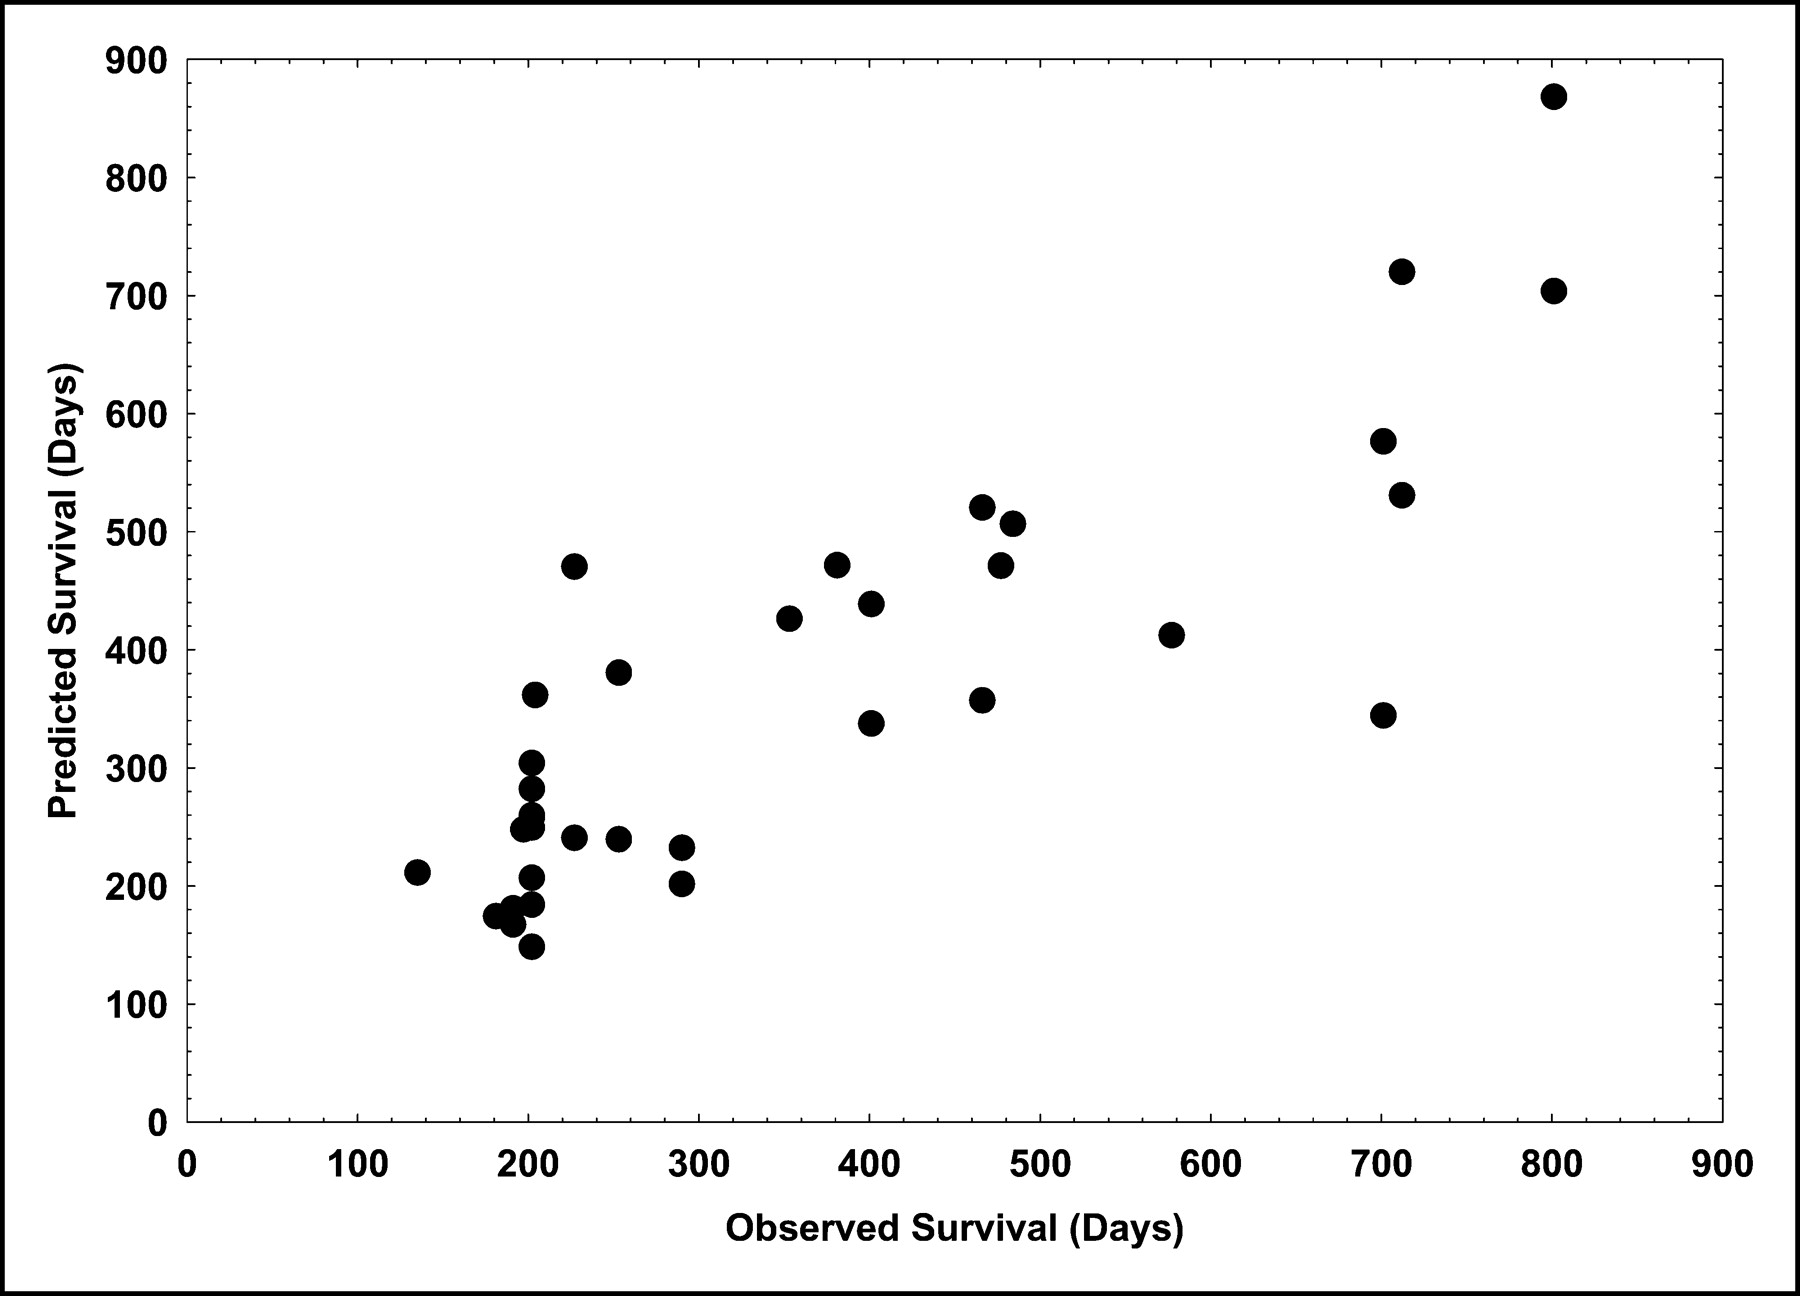
Scatterplot of observed and individually predicted survival times (as calculated by multiple linear regression) using kinetic data (as calculated by the best subset method) of the first (k3, k4, VB, FD) and third (k1, k2, k4, VB) MS.
Correlation Coefficients of Observed Survival Times (Dependent Variable) and Predicted Survival Times as Calculated by Linear Regression Function
Correlation Coefficients of Observed Survival Times (Dependent Variable) and Predicted Survival Times as Calculated by Multiple Linear Regression Function
Observed Versus Predicted Survival Time for Each Patient
DISCUSSION
FOLFOX increased the response rate. De Gramont et al. compared FU and FA with FOLFOX in 420 untreated patients with metastatic colorectal cancer and reported an objective response rate of 50.7% for FOLFOX versus 22.3% for FU and FA (control group) and a longer progression-free survival (median, 9.0 vs. 6.2 mo). Furthermore, FOLFOX gave higher incidences of common toxicity criteria, such as neutropenia (41.7% vs. 5.3%), diarrhea (11.9% vs. 5.3%), and neurosensory toxicity (18.2% vs. 0%), but these higher incidences did not impair quality of life (12). The authors concluded that an early introduction of oxaliplatin may be advantageous. The data demonstrate a need to predict therapy outcome on an objective basis in order to individualize and optimize chemotherapy.
Different strategies can be applied to gain valuable prognostic information on the therapeutic outcome of patients treated with FU-based chemotherapy. Influx and efflux of FU can be evaluated noninvasively by PET double-tracer studies using 15O-labeled water, an inert perfusion tracer, and 18F-labeled FU (13). In a previous study, we demonstrated that 18F-FU uptake, as measured with a PET study in individual metastases before onset of chemotherapy, correlated well with tumor growth rate during FU-based chemotherapy (14). Moehler et al. evaluated the prognostic value of 18F-FU PET in patients with unresectable liver metastases of colorectal cancer (15). The authors compared the 18F-FU uptake values in individual metastases as measured by PET before onset of chemotherapy to the survival data and found a correlation of 0.65 between the 2 parameters. Furthermore, 18F-FU studies demonstrated that liver metastases are heterogeneous and may exhibit a nonuniform 18F-FU influx and efflux even in the same patient (13).
The literature has limited data on monitoring chemotherapeutic effects using PET in patients with colorectal cancer. Several authors have examined the role of 18F-FDG PET for therapy management in oncologic patients using different methodologies for the evaluation of the PET studies. Most authors used only a visual or a semiquantitative method (e.g., SUV or tumor-to-normal tissue ratio) to evaluate the data. However, it is still debatable which parameters are most suitable to predict therapy outcome in tumor patients. A decrease of global 18F-FDG uptake generally indicates response to therapy and therefore a longer survival, whereas an increase in 18F-FDG uptake is associated with progressive disease and a shorter survival (1). Most authors demonstrated a relationship between change in 18F-FDG uptake and response to therapy and to group-based survival based on Kaplan–Meier analysis in different tumor types (16). Besides SUV, the metabolic rate of 18F-FDG according to Patlak analysis has been used in parallel to SUV by a few investigators. Römer et al. performed dynamic 18F-FDG measurements on 11 patients with untreated non-Hodgkin’s lymphomas and noted a significantly larger change in the metabolic rate of 18F-FDG, compared with SUV (17). Freedman et al. found even divergent results for the changes in SUV and Patlak values in patients with renal cell carcinomas (18). The absolute difference in percentage change was outside the 95% confidence limits for 6 of 43 tumors and greater than 50% for 2 of 43 tumors. The authors found that correction for the unmetabolized 18F-FDG in tumors reduced some, but not all, discrepancies. However, the data demonstrate that a multiparameter analysis of the 18F-FDG kinetic data may be superior to the use of a single value to assess early therapeutic effects.
A 2-tissue-compartment model is a generally accepted as a method for accurate, detailed analysis of 18F-FDG metabolism. A prerequisite for compartment modeling is acquisition of the input function. Previous studies have shown that hepatic metastases are primarily supplied by vessels originating from the hepatic artery (13). A feasible way to approximate the input function noninvasively is by retrieving the input data from the image data. We used a vessel VOI consisting of at least 7 contiguous ROIs in the aorta abdominalis. Keiding et al. examined whether time–activity curves based on arterial blood sampling could be replaced by time–activity curves obtained from the descending aorta in patients with liver tumors (19). The authors demonstrated that the k-values obtained with the aorta VOI agreed best with the k-values based on arterial blood sample measurements. The authors concluded that arterial blood sampling can be replaced by the aorta VOI in the calculation of net metabolic clearance of 18F-FDG from human liver tumors. Comparable results were reported by Ohtake et al., who found that the input function calculated from the time–activity curves of the descending aorta correlated well with venous sample data (20). Application of FD to the time–activity curves is another independent parameter, which describes the time–activity curve and gives evidence of a more chaotic or deterministic nature of the 18F-FDG kinetics. We previously demonstrated that malignant tumors have a higher FD than do benign lesions, which may be related to the fact that tumors are more heterogeneous and show a more chaotic distribution of 18F-FDG (11). This hypothesis is supported by previous data indicating that liver metastases are heterogeneous even in the same patient (13). Therefore, we preferred to evaluate each metastasis individually and to compare the 18F-FDG kinetic data of each metastasis to survival.
In this study, we defined 2 groups of patients according to the survival time of 1 y (364 d). One-year survival is a criterion that referring oncologists use to define short- or long-term survival in patients receiving second-line chemotherapy. We applied the DA to the data to analyze the values of the different 18F-FDG kinetic parameters for predicting the 2 groups. Generally, the use of the SUV of a single MS was superior for the classification of patients with a longer survival (CCR > 73%) than for patients with a shorter survival (Table 3) but ranged from 62% to 69% CCR for both groups. Interestingly, the SUV of the third MS as a single parameter was best, demonstrating a CCR comparable to the combination of the SUVs of the first and third MS. Better results were obtained when kinetic data were used for classification (Table 4). Combination of 2 MS generally improved the results. Römer et al. noted in patients with untreated non-Hodgkin’s lymphoma that the SUV of the third study (42 d after onset of chemotherapy) was superior for the prediction of long-term outcome (17). This result is in agreement with the data of our study. The SUV of the third MS as a single parameter was superior to the SUVs of the other MS for prediction of both groups. However, the prediction of the short survival group was relatively low (57%) based on the SUV of the third MS. The combined use of the first and third MS enhanced the CCR (78%) based on kinetic data with regard to the prediction of both groups. In a recently published study, we compared the PET data (SUV, FD) of the patients included in this study (first and second MS) with the clinical follow-up data, as defined at least 3 mo after the initiation of FOLFOX therapy (21). We defined 3 groups according to the WHO classification, namely progressive disease, stable disease, and partial response. We could demonstrate that SUV was a good criterion for classifying progressive disease when using DA (CCR: 81.5% for the second MS and 96.4% for the first MS). Generally, DA inclined to misclassify the data toward progressive disease. In particular, the CCR for the PR group was at most 10%. The data demonstrate that SUV is a sensitive parameter for the detection of nonresponders approximately 3 mo after the onset of chemotherapy. However, the comparison of SUV to survival data demonstrated that the former is less accurate in predicting survival. As the presented results show, prediction of individual survival demands a multiparameter analysis of kinetic PET data.
To our knowledge, no literature data are available on the use of kinetic parameters in liver metastases undergoing chemotherapy. Okazumi et al. reported on 2 patients with hepatocellular carcinoma treated with transcatheter arterial embolization who had a significant decrease in k3 after intervention (22). These results are interesting but limited with regard to statistics to indicate the potential usefulness of quantitative 18F-FDG studies for assessment of therapy response.
Limited data exist on the use of static 18F-FDG uptake measurements for monitoring the therapy response of patients with colorectal cancer. A well-documented 18F-FDG study on prediction of therapy response in metastatic colorectal cancer was published by Findlay et al. (23). The authors examined 20 colorectal cancer patients with liver metastases treated with FU with or without interferon-α in a triple follow-up with 18F-FDG PET. They found no correlation between the pretreatment SUV or tumor-to-liver ratios and the tumor response as assessed by restaging data. Discrimination between response and nonresponse was possible only on the basis of the 4- to 5-wk tumor-to-liver ratio. The data suggest that a late 18F-FDG examination may be better for therapy prognosis, as in the study of Römer et al. (17). In our study, a higher CCR was found when the SUV of the third study was used for the prediction of both groups (69%) and in particular for the group with the longer survival time (87%). A comparison of our data with the data of Findlay et al. is limited because the authors used, as a reference, not survival—a parameter that reflects the overall efficiency of chemotherapy—but the intermediate restaging data.
No data exist on the value of 18F-FDG for prediction of individual survival. Prediction of individual survival requires more complex statistical methods and cannot be achieved by Kaplan–Meier analysis. One main purpose of this study was the evaluation of 18F-FDG kinetics, using compartmental and noncompartmental models in 3 consecutive MS, with respect to individual survival. We used a multiple linear regression function with a maximum of 8 independent variables and a combination of up to 2 MS to reduce the parameters with respect to the number of evaluated lesions (Tables 5–7). Best-subset analysis was applied for the selection of those kinetic parameters that correlated most significantly with observed survival. The most powerful combination for prediction of individual survival was, according to these data, the combination of the second and third MS (r = 0.901), followed by the combination of the first and third MS (r = 0.850). However, for clinical application, the use of the first and third MS is more convenient for assessing response to therapy. Best-subset analysis revealed that the k3, k4, VB, and FD of the first MS and the k1, k2, k4 and VB of the third MS contributed most to a significant correlation. No comparable literature data about kinetic 18F-FDG studies on metastatic colorectal tumors are available for comparison with these data.
Prediction of short- or long-term survival and, in particular, prediction of individual survival are topics that raise several questions about the handling of data. Kinetic PET data derived from multiple PET follow-up studies provide absolute values that demand dedicated statistical procedures for evaluation. In this paper, we have presented a methodology that allows individual prediction of survival on the basis of a multiple linear regression analysis. Furthermore, no consensus exists about the evaluation of therapy outcome by handling more than 1 metastatic lesion per patient, using multiple kinetic parameters. In our opinion, assessing each metastatic lesion separately is more accurate than is, for example, using some kind of a global score for each patient.
CONCLUSION
Individual prognosis after FOLFOX chemotherapy is a challenging application for PET. Quantitative assessment of the complex kinetics of 18F-FDG in tumors can help to solve this problem. More sophisticated statistical methods, such as discriminant analysis and regression analysis, should be used to assess the therapeutic effects of FOLFOX therapy and to quantify the inhibitory effect of chemotherapy on tumor growth. Although the results of this study are confined to metastatic colorectal tumors after FOLFOX chemotherapy, the presented methodology may be helpful for individualization and optimization of chemotherapeutic protocols in general.
Footnotes
Received Oct. 27, 2003; revision accepted Mar. 19, 2004.
For correspondence or reprints contact: Antonia Dimitrakopoulou-Strauss, MD, Medical PET Group—Biological Imaging (E0601), German Cancer Research Center, Im Neuenheimer Feld 280, D-69120 Heidelberg, Germany.
E-mail: ads{at}ads-lgs.com or a.dimitrakopoulou-strauss{at}dkfz.de
REFERENCES
In this issue


Jump to section
Related Articles
Cited By...
- Additional Clinical Value for PET/MRI in Oncology: Moving Beyond Simple Diagnosis
- 18F-FDG Kinetics Parameters Depend on the Mechanism of Injury in Early Experimental Acute Respiratory Distress Syndrome
- Tumor Aggressiveness and Patient Outcome in Cancer of the Pancreas Assessed by Dynamic 18F-FDG PET/CT
- Shortened Acquisition Protocols for the Quantitative Assessment of the 2-Tissue-Compartment Model Using Dynamic PET/CT 18F-FDG Studies
- Impact of Dynamic 18F-FDG PET on the Early Prediction of Therapy Outcome in Patients with High-Risk Soft-Tissue Sarcomas After Neoadjuvant Chemotherapy: A Feasibility Study
- Monitoring and Predicting Response to Therapy with 18F-FDG PET in Colorectal Cancer: A Systematic Review
- Colorectal Tumor Cells Treated with 5-FU, Oxaliplatin, Irinotecan, and Cetuximab Exhibit Changes in 18F-FDG Incorporation Corresponding to Hexokinase Activity and Glucose Transport
- Comparison of Image-Derived and Arterial Input Functions for Estimating the Rate of Glucose Metabolism in Therapy-Monitoring 18F-FDG PET Studies
- 18F-FDG PET in Evaluating Patients Treated for Metastatic Colorectal Cancer: Can We Predict Prognosis?