


Abstract
The use of dynamic 18F-FDG PET to determine changes in tumor metabolism requires tumor and plasma time–activity curves. Because arterial sampling is invasive and laborious, our aim was to validate noninvasive image-derived input functions (IDIFs). Methods: We obtained 136 dynamic 18F-FDG PET scans of 76 oncologic patients. IDIFs were determined using volumes of interest over the left ventricle, ascending aorta, and abdominal aorta. The tumor metabolic rate of glucose (MRGlu) was determined with the Patlak analysis, using arterial plasma time–activity curves and IDIFs. Results: MRGlu using all 3 IDIFs showed a high correlation with MRGlu based on arterial sampling. Comparability between the measures was also high, with the intraclass correlation coefficient being 0.98 (95% confidence interval, 0.97–0.99) for the ascending aorta IDIF, 0.94 (0.92–0.96) for the left ventricle IDIF, and 0.96 (0.93–0.98) for the abdominal aorta IDIF. Conclusion: The use of IDIFs is accurate and simple and represents a clinically viable alternative to arterial blood sampling.
Because metabolic changes may precede changes in lesion morphology, there is growing interest in applying 18F-FDG PET as an adjunct to anatomic imaging for the evaluation of chemotherapeutic response. 18F-FDG PET may increase the accuracy with which response and overall treatment outcome are monitored and provide information helpful to physicians who are making early decisions on the course of therapy. Monitoring response during chemotherapy requires quantification to accurately determine changes in tumor metabolism. The most accurate quantitative results are obtained with dynamic data acquisition to determine time–activity curves for both the tumor and the plasma. For the latter, arterial sampling is considered the gold standard (1–6). Because arterial sampling is invasive and laborious, blood time–activity curves derived by placing volumes of interest (VOIs) on large vascular structures on PET images are attractive and, if validated, can make the quantification accurate and practical.
In this study, metabolic rate of glucose (MRGlu) obtained noninvasively from large-vascular-structure image-derived input functions (IDIFs) was compared with MRGlu obtained from arterial plasma time–activity input functions to assess the accuracy of 18F-FDG PET measurements based on the two different input functions.
MATERIALS AND METHODS
Patient Population
We obtained 136 dynamic 18F-FDG PET scans of 76 patients (47 men and 29 women; mean age, 63 y; range, 33–79 y) with colorectal (n = 36), lung (n = 37), or breast (n = 3) cancer. Patients with diabetes mellitus were excluded. The Institutional Review Board of the Radboud University Nijmegen Medical Centre approved the study, and written informed consent was obtained from all patients.
PET Image Acquisition
The patients fasted for at least 6 h. Cannulas were inserted in an antecubital vein for 18F-FDG injection and in a radial artery (20-gauge cannula) for blood sampling. The blood glucose level was within the reference range in all patients (hexokinase method, Aeroset; Abbott Diagnostics).
All scans were acquired on an ECAT EXACT47 scanner (Siemens/CTI) in septa-extended (2-dimensional) mode. After a 20-min transmission scan, 200 MBq of 18F-FDG were injected intravenously over a 1-min period followed by a 40-mL saline flush at a rate of 8 mL/s, using an infusion pump (Medrad). Dynamic data acquisition was started simultaneously with 18F-FDG injection for 16 time frames (10 × 30 s, 3 × 300 s, 3 × 600 s), for a total time of 50 min. Images were corrected for decay, attenuation, and randoms. Scatter correction based on measured scatter fractions as implemented in the ECAT 7.2.1 software was used. Attenuation-corrected images were reconstructed in 128 × 128 matrices using filtered backprojection with a 4-mm gaussian filter.
Arterial Plasma Input Function (n = 136)
Immediately after 18F-FDG injection, 7 arterial blood samples (2 mL each) were drawn at 15-s intervals, followed by the drawing of 2-mL samples at 135 s, 165 s, 225 s, 285 s, 7.5 min, 12.5 min, 17.5 min, 25 min, 35 min, and 45 min after injection. Plasma radioactivity was determined in a well-type γ-counter (Wallac 1480 Wizard; PerkinElmer, Inc.) using the standard solution method (7).
IDIF (n = 231)
One or 2 IDIF-derived MRGlu values per 18F-FDG PET scan were calculated by placing VOIs over the heart (n = 98), the ascending aorta (n = 79), or the abdominal aorta (n = 54) on early time frames that best showed the bolus of activity. For VOI definition in the ascending and abdominal aorta, a semiautomatic threshold-based region-growing program was used. All VOIs were verified visually. In the heart, VOIs were drawn manually on the left ventricular cavity. The VOIs were copied to the last time frame to check for contamination from myocardial uptake. Spillover and partial-volume effects were minimized by placement of regions at least 2 pixels (≈7 mm) away from the myocardial wall. Whether myocardial uptake had any influence was investigated by separate analysis of patients with and without myocardial uptake. Time–activity curves were created using VOIs that consisted of several regions of interest drawn over the blood-pool area in as many planes as possible.
Tumor Time–Activity Curves
Primary and metastatic tumors with high as well as low 18F-FDG uptake were included. The locations of the lesions were verified visually on the summed late frames. VOIs were placed semiautomatically over the tumors, using a threshold of 50% of the maximum pixel value within the lesion. The tumor VOIs were then copied to the dynamic imaging sequence to obtain time–activity curves. The same tumor VOIs were used for both image-derived and arterial-sampling–derived Patlak plots to eliminate any variability in VOI size or placement. The volume-weighted mean value for all lesions on each PET scan was derived to provide 1 MRGlu for each PET scan.
Patlak Graphical Analysis
Patlak graphical analysis (8) was used to compare the tumor MRGlu values calculated from IDIF and arterial sampling at 5–50 min after injection. Tumor MRGlu (μmol·mL−1·min−1) was calculated by multiplication of the slope of the Patlak plot (K1k3·(k2 + k3)−1) and the blood glucose level (μmol·mL−1). The lumped constant was set to 1 and assumed to be constant over time. The fractional blood volume in tumor was set to zero.
Statistical Analysis
The intraclass correlation coefficient (ICC) was estimated as a statistic to express the comparability of the reference data and the MRGlu values obtained with IDIFs. In addition, regression analysis was performed to predict the IDIF-derived MRGlu values based on the reference data and to estimate the slope of the function of the relationship between the measures.
RESULTS
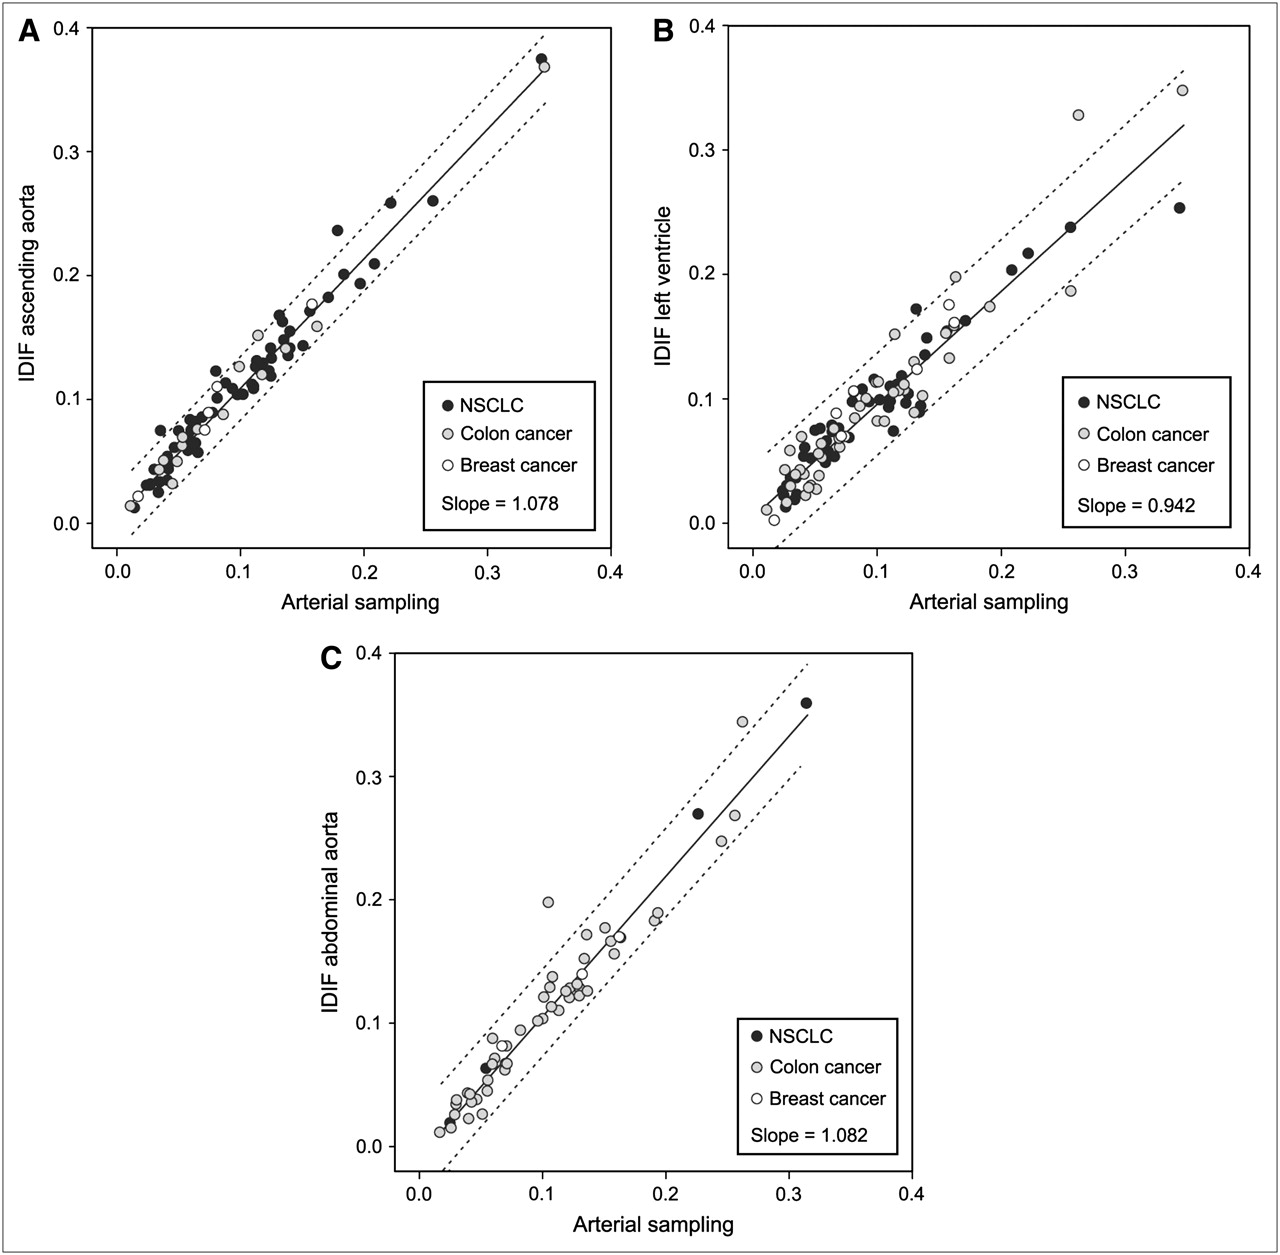
MRGlu based on the ascending aorta IDIF (Fig. 1A), the left ventricle IDIF (Fig. 1B), and the abdominal aorta IDIF (Fig. 1C) showed a strong relationship with MRGlu based on arterial sampling. Comparability between the measures was also high, with ICC being 0.98 (95% confidence interval, 0.97–0.99) for the ascending aorta IDIF, 0.94 (0.92–0.96) for the left ventricle IDIF, and 0.96 (0.93–0.98) for the abdominal aorta IDIF. The slopes of the 3 scatterplots showed a slight systematic deviation of 6%–8%; intercepts were near zero (Fig. 1). No differences in distribution were observed between the 3 types of cancer.

Scatterplots of MRGlu, expressed in μmol·mL−1·min−1, as calculated using ascending aorta IDIF (A), left ventricle IDIF (B), or abdominal aorta IDIF (C) to that calculated using arterial-sampling–derived input function. Ninety-five percent prediction intervals are indicated by dotted lines.
Comparability for MRGlu based on the left ventricle IDIF and the ascending aorta IDIF was 0.95 (95% confidence interval, 0.92–0.97). For MRGlu based on the left ventricle IDIF and abdominal aorta IDIF, the ICC was 0.95 (0.90–0.97).
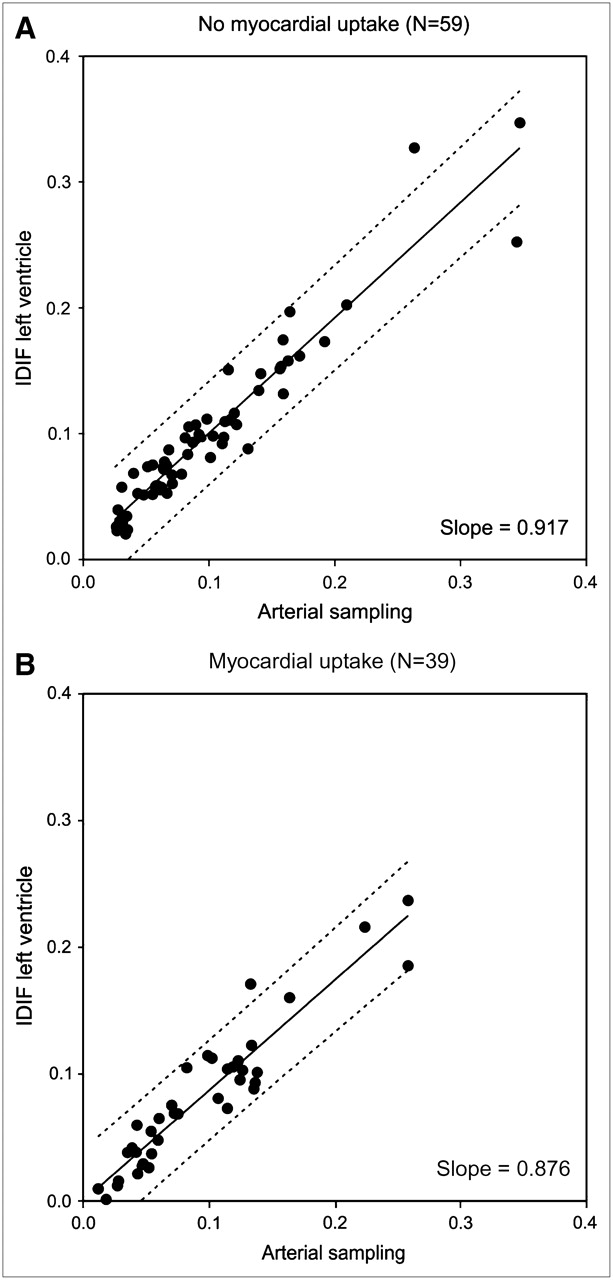
Figure 2 shows the scatterplots of the MRGlu based on the IDIF of the left ventricle in patients without (Fig. 2A) and with (Fig. 2B) myocardial 18F-FDG uptake, versus arterial-sampling–based MRGlu. For the group without myocardial 18F-FDG uptake (n = 59), the ICC was 0.95 (0.92–0.97). The ICC for the group with myocardial 18F-FDG uptake (n = 39) was 0.94 (0.89–0.97).

Scatterplots of MRGlu values based on IDIF of left ventricle vs. MRGlu values based on arterial sampling, for groups without (A) and with (B) 18F-FDG uptake in myocardial wall.
DISCUSSION
MRGlu based on IDIFs from the ascending aorta, the left ventricle, and the abdominal aorta showed highly significant correlations with MRGlu derived from arterial blood sampling, which served as the reference method. The ascending aorta IDIF did not show any prominent outliers and had the strongest correlation with the gold standard. The fact that the ICCs for MRGlu estimated by all 3 types of IDIFs compared well with those for arterial-sampling–derived MRGlu suggests that the use of uncorrected IDIF methods provides consistent data that can be translated to clinical practice. The advantage of using the ascending aorta is the possibility of defining larger VOIs, thus obtaining data with better statistical properties and less spillover from potentially high-uptake tissues such as myocardium. Partial-volume effects, however, remain possible.
In studies monitoring therapeutic response, IDIFs from large vessels or the left ventricle are already used (9,10). However, the data are rarely validated against the gold standard. Although the validity of using IDIFs has previously been investigated in several studies of PET radiopharmaceuticals other than 18F-FDG (2–4,11,12), similar studies using 18F-FDG have never been performed on large numbers of oncologic patients.
Our findings are in line with the findings of van der Weerdt et al. (1), who evaluated the accuracy of IDIF from the left ventricle, left atrium, and ascending aorta in 18 cardiac 18F-FDG PET studies. However, the left atrium is difficult to localize in oncology studies because of poor contrast after 6 h of fasting, and potential spillover from the myocardium is less than in cardiac 18F-FDG PET. Therefore, results obtained from such cardiac studies (1,6,13) cannot be directly extrapolated to 18F-FDG PET for oncologic applications.
A number of factors can affect the accuracy of IDIFs. IDIFs potentially suffer from partial-volume effects. Several methods have been reported for correcting time–activity curves for partial-volume effects—for example, estimation of the diameter of the vessel via activity profile analysis with nonlinear regression techniques (14). Furthermore, the left ventricular curve can contain spillover from the myocardium, because of the limited spatial resolution of PET scanners and cardiac movement. This spillover can affect the tail of the input curve and lead to errors in glucose consumption. The errors could be corrected by using information from independent venous blood samples in later time frames (15). IDIFs are also susceptible to errors due to patient movement. In addition, noise could be introduced by the limited number of counts acquired in each time frame. Especially small VOIs suffer from higher noise levels. The dependence of the final recovery coefficient on the filter used in the image reconstruction process can be determined analytically (14). The blood volume in tumor tissue modulates uptake of the tracer. Therefore, the use of blood volume corrections can influence diagnostic accuracy (16). Fractal dimension may help to quantify heterogeneity. An increased fractal dimension indicates a more chaotic distribution of 18F-FDG (16). The application of factor analysis, a method of generating an input function from smaller vessels, also appears promising but needs further evaluation (17). Furthermore, manual VOI definition of vessels could introduce inter- and intraobserver variability.
In general, arterially sampled and uncorrected IDIFs will differ. When only the partial-volume effect is important, the IDIF curve will be isomorphic to the arterially sampled curve (Fig. 3A). For all time points, the IDIF activity concentrations will be lower than the arterially sampled ones by the same factor f (f < 1), resulting in an IDIF-derived MRGlu that is higher by 1/f than the MRGlu derived from arterial sampling. Conversely, when trapping of 18F-FDG occurs, such as in the myocardium or in blood vessel walls, and partial-volume effects are small, the IDIF and arterially sampled values will be equal up to the time at which the relative contribution of trapped 18F-FDG can be neglected. At later times, however, the IDIF values will exceed the arterially sampled ones (Fig. 3B). This trapping effect will lead to lower MRGlu values for IDIFs than for arterial sampling. Obviously, in clinical practice, both effects may be present, leading to slope values greater than 1 when the partial-volume effect is predominant and to slope values less than 1 when trapping is predominant. It is clear that for both aorta-derived input functions, the partial-volume effect dominates (slopes > 1), whereas for the left ventricle-derived input functions, the trapping effect is stronger. This effect is further exemplified by the fact that MRGlu values based on left ventricle–derived input functions lead to a slope of 0.98 when myocardial 18F-FDG uptake is absent and to a slope of 0.88 when myocardial uptake is high.

IDIF left ventricle of a patient without myocardial uptake of 18F-FDG (A) and a patient with high myocardial uptake of 18F-FDG (B) plotted against arterially sampled input functions derived from same dynamic dataset. In A, only partial-volume effect affects IDIF. All time points are lower, but IDIF curve stays isomorphic to arterial-sampling curve. In B, trapping of 18F-FDG is predominant. Curves stay isomorphic until time at which trapping cannot be neglected and IDIF values start to exceed arterial-sampling values.
CONCLUSION
Despite a variety in potential errors when generating IDIFs, strong correlations were observed between MRGlu based on IDIFs and MRGlu based on arterial sampling. The use of uncorrected image-derived methods is accurate and simple, can be applied to studies monitoring oncologic therapy, and represents a clinically viable alternative to arterial blood sampling.
References
- Received for publication December 1, 2005.
- Accepted for publication February 11, 2006.


Jump to section
Related Articles
Cited By...
- Total-Body Quantitative Parametric Imaging of Early Kinetics of 18F-FDG
- Measurement of PET Quantitative Bias In Vivo
- Consensus Recommendations on the Use of 18F-FDG PET/CT in Lung Disease
- Metabolic Subtyping of Pheochromocytoma and Paraganglioma by 18F-FDG Pharmacokinetics Using Dynamic PET/CT Scanning
- Practical Clinical Measurement of Radiotracer Concentration in Blood: Initial Device Concept and Feasibility Testing
- Hepatic glucose utilization in hepatic steatosis and obesity
- A Monte Carlo Study of the Dependence of Early Frame Sampling on Uncertainty and Bias in Pharmacokinetic Parameters from Dynamic PET
- Searching for Alternatives to Full Kinetic Analysis in 18F-FDG PET: An Extension of the Simplified Kinetic Analysis Method
- A Curve-Fitting Approach to Estimate the Arterial Plasma Input Function for the Assessment of Glucose Metabolic Rate and Response to Treatment
- Chemotherapy Response Monitoring of Colorectal Liver Metastases by Dynamic Gd-DTPA-Enhanced MRI Perfusion Parameters and 18F-FDG PET Metabolic Rate
- Comparison of 3 Methods of Automated Internal Carotid Segmentation in Human Brain PET Studies: Application to the Estimation of Arterial Input Function
- Comparison of Tumor Volumes Derived from Glucose Metabolic Rate Maps and SUV Maps in Dynamic 18F-FDG PET
- Image-Derived Input Function for Assessment of 18F-FDG Uptake by the Inflamed Lung
- Chemotherapy Response Evaluation with 18F-FDG PET in Patients with Non-Small Cell Lung Cancer
- Optimizing Experimental Protocols for Quantitative Behavioral Imaging with 18F-FDG in Rodents