


Abstract
Static single–time-frame 18F-FDG PET/CT is useful for the localization and functional characterization of pheochromocytomas and paragangliomas (PPGLs). 18F-FDG uptake varies between PPGLs with different genotypes, and the highest SUVs are observed in cases of succinate dehydrogenase (SDH) mutations, possibly related to enhanced aerobic glycolysis in tumor cells. The exact determinants of 18F-FDG accumulation in PPGLs are unknown. We performed dynamic PET/CT scanning to assess whether in vivo 18F-FDG pharmacokinetics has added value over static PET to distinguish different genotypes. Methods: Dynamic 18F-FDG PET/CT was performed on 13 sporadic PPGLs and 13 PPGLs from 11 patients with mutations in SDH complex subunits B and D, von Hippel-Lindau (VHL), RET, and neurofibromin 1 (NF1). Pharmacokinetic analysis was performed using a 2-tissue-compartment tracer kinetic model. The derived transfer rate-constants for transmembranous glucose flux (K1 [in], k2 [out]) and intracellular phosphorylation (k3), along with the vascular blood fraction (Vb), were analyzed using nonlinear regression analysis. Glucose metabolic rate (MRglc) was calculated using Patlak linear regression analysis. The SUVmax of the lesions was determined on additional static PET/CT images. Results: Both MRglc and SUVmax were significantly higher for hereditary cluster 1 (SDHx, VHL) tumors than for hereditary cluster 2 (RET, NF1) and sporadic tumors (P < 0.01 and P < 0.05, respectively). Median k3 was significantly higher for cluster 1 than for sporadic tumors (P < 0.01). Median Vb was significantly higher for cluster 1 than for cluster 2 tumors (P < 0.01). No statistically significant differences in K1 and k2 were found between the groups. Cutoffs for k3 to distinguish between cluster 1 and other tumors were established at 0.015 min−1 (100% sensitivity, 15.8% specificity) and 0.636 min−1 (100% specificity, 85.7% sensitivity). MRglc significantly correlated with SUVmax (P = 0.001) and k3 (P = 0.002). Conclusion: In vivo metabolic tumor profiling in patients with PPGL can be achieved by assessing 18F-FDG pharmacokinetics using dynamic PET/CT scanning. Cluster 1 PPGLs can be reliably identified by a high 18F-FDG phosphorylation rate.
- pheochromocytoma
- paraganglioma
- succinate dehydrogenase
- Warburg effect
- 18F-fluorodeoxyglucose positron emission tomography
Static 18F-FDG PET/CT has been proven useful for localization and characterization of both primary and metastatic pheochromocytomas and paragangliomas (PPGLs) (1). These catecholamine-producing tumors derive from the adrenal medulla and extraadrenal sympathetic chromaffin tissues. At least one third of PPGLs are associated with hereditary cancer susceptibility syndromes (2). Germline mutations have been identified in more than 15 well-characterized genes, most commonly in succinate dehydrogenase (SDH) complex subunits B and D (SDHB/D), RET, von Hippel-Lindau (VHL), and neurofibromin 1 (NF1) (2,3). Furthermore, somatic mutations are found in at least one third of sporadic PPGLs (2). Hereditary PPGLs can be segregated into 2 clusters based on their transcription profiles: cluster 1 (SDH, VHL) is enriched for genes that are associated with the hypoxic response, and cluster 2 (RET, NF1) implicates gene mutations that activate kinase signaling (4,5). SDHB mutations are associated with a particularly malignant phenotype (6–8).
The degree of 18F-FDG uptake mirrors glucose metabolism in tumor cells and varies between different PPGL genotypes. The highest SUVs on static PET/CT images are observed in SDHx- and VHL-related tumors (9–11). The high SUVs observed in cluster 1 PPGLs are currently not well explained or reflected by dedifferentiation or high proliferation rate (9,12–14). Increased glucose uptake could be due rather to genotype-related changes in energy metabolism (15,16). This possibility is supported by our previous observation that 18F-FDG accumulation in SDHx-related PPGLs is associated with increased expression of hexokinases, indicating an increase in aerobic glycolysis, also known as the Warburg effect (10). Alternatively, high SUVs could be related to a high proportion of unmetabolized (e.g., unphosphorylated) 18F-FDG present in the PPGL tissue. Dynamic 18F-FDG PET/CT gives the opportunity to determine the proportion of unmetabolized (e.g., unphosphorylated) 18F-FDG (17). The unmetabolized 18F-FDG includes 18F-FDG located in compartments such as the extracellular spaces (in the blood plasma, in the extravascular extracellular space) and the cells. Pharmacokinetic analysis of dynamic PET/CT allows quantitative assessment of in vivo glucose metabolic rate (MRglc). Additionally, pharmacokinetic rate-constants of 18F-FDG metabolism and Vb can be calculated using a 2-tissue-compartment model (17).
The aims of this study were, first, to assess in vivo 18F-FDG uptake and pharmacokinetics across sporadic and hereditary PPGLs using dynamic multiple–time-frame PET/CT scanning to analyze the glycolytic activity of cluster 1 PPGLs and, second, to investigate whether dynamic PET/CT has added value over static 18F-FDG PET/CT for distinguishing between different genotypes.
MATERIALS AND METHODS
Patients
Between October 2013 and April 2017, we prospectively included 26 patients who underwent 18F-FDG PET/CT imaging as part of their diagnostic evaluation for PPGL. The initial 15 patients were included consecutively regardless of genotype. To achieve a representative mix of different hereditary cases, the additional 11 patients were selected for inclusion on the basis of (high pretest suspicion of) the presence of a germline mutation. All patients were investigated at the Radboud University Medical Center. Exclusion criteria were diabetes mellitus, a fasting glucose level of at least 8.0 mmol⋅L−1, severe claustrophobia, breast feeding, and pregnancy. Twenty-four patients (13 men, 11 women; mean age, 52.7 y; range, 20–85 y) were analyzed, as 2 patients were excluded because of fasting hyperglycemia at the time of scanning and were later proven to have diabetes mellitus. The biochemical diagnosis of PPGL had been confirmed in all cases. In 20 patients, the diagnosis of PPGL was reconfirmed histologically after surgery. Twenty-one patients had nonmetastatic PPGLs (19 adrenal, 2 extraadrenal). Three patients had metastatic PPGLs, including one with retroaortic lymph node metastasis, one with retrocaval lymph node metastasis, and one with both paraaortic lymph node and thoracic spine bone metastasis. The presence of germline mutations and large deletions in SDHA/B/C/D/AF2, VHL, RET, TMEM127, and MAX was investigated using standard procedures. Eleven patients had an underlying mutation. The others were classified as having apparently sporadic disease. Patient characteristics are listed in Table 1. Plasma concentrations of free metanephrines were assayed using high-performance liquid chromatography (18). Biochemical phenotypes were categorized as described previously (19). Tumor sizes were recorded from pathology reports. The study was approved by the Institutional Review Board of the Radboud University Medical Center, and written informed consent was obtained from each patient.
Patient Characteristics
18F-FDG PET/CT Image Acquisition and Reconstruction
Patients fasted for at least 6 h before scanning. Venous blood glucose levels were measured before 18F-FDG infusion. All PET/CT scans were acquired on a Biograph mCT-40 (Siemens Medical Solutions), which was calibrated and harmonized and was certified by the European Association of Nuclear Medicine Research Ltd. in accordance with its guidelines (20). CT findings were used to select the index tumor lesion. After low-dose breath-hold spiral CT had been performed, free-breathing PET/CT images at a single bed position were acquired immediately after 18F-FDG infusion in list mode for 55 min, with the patient supine and the index tumor centrally located in the field of view. Subsequently, static 18F-FDG PET/CT from skull base to mid thigh was performed 66 ± 4 min (mean ± SD) after 18F-FDG infusion for clinical purposes. A dose of 1.82 ± 0.23 MBq⋅kg-1 of 18F-FDG (administered dose range, 83–202 MBq) was directly administered in an antecubital vein using a standardized injection protocol (8.0 mL at 0.2 mL⋅s−1) with a remote-controlled pump, followed by a saline flush (40 mL at 8.0 mL⋅s−1), after the start of acquisition. Data were acquired and reconstructed as previously described (10,21).
Image Analysis of Dynamic PET
Decay-corrected PET/CT images were reviewed using Inveon Research Workplace (version 4.2; Siemens Healthcare). Images were analyzed by one investigator under the supervision of two experienced nuclear medicine physicians.
Parametric images of MRglc were derived from tissue and plasma blood time–activity concentration curves using the Patlak linearization approach, with data acquired between 15 and 55 min after injection, as previously described (17,22). A detailed description of the Patlak graphical analyses and its assumptions has been published elsewhere (23).
Tracer pharmacokinetics were assessed by performing pharmacokinetic analysis on the basis of tissue and plasma blood time–activity concentration curves. The rate constants (K1–k3) and vascular blood fraction (Vb) were calculated using nonlinear least-squares regression analysis by assuming an irreversible 2-tissue-compartment model (Fig. 1). The optimization consisted of 99 random starting points with reproducible results to prevent the optimization algorithm from quitting when converging to a local minimum instead of the global minimum.
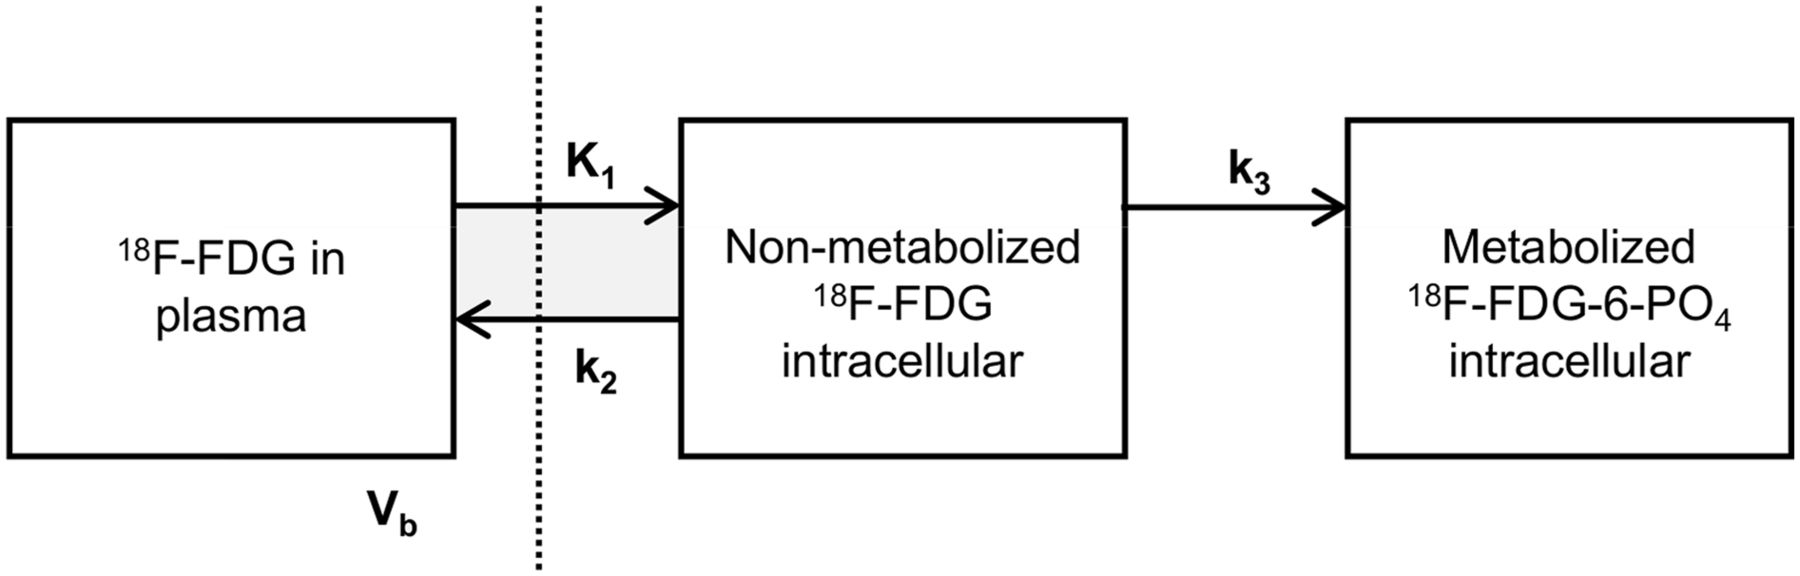
Irreversible 2-tissue-compartment model for 18F-FDG metabolism. Measured PET signal is combination of intracellular activity concentration of free 18F-FDG (nonmetabolized 18F-FDG in tissue), intracellular activity concentration of 18F-FDG-6-phosphate (metabolized 18F-FDG-6-PO4 in tissue), and fraction of activity concentration of 18F-FDG in blood plasma (Vb). By using dynamic PET/CT, pharmacokinetic rate-constants K1 and k2 (rate constants of transport of 18F-FDG into and out of tumor cell by glucose transporters, in mL/g/min), k3 (rate constant of cytoplasmic phosphorylation of 18F-FDG by hexokinase, per minute), and Vb (in milliliters of blood per milliliter of tumor) can be determined using nonlinear least-squares regression of dynamic PET/CT data. Vertical dashed line represents cell membrane
Image Analysis of Static PET
Static 18F-FDG PET/CT scans were also evaluated semiquantitatively by SUV analysis. SUVmax normalized for body weight was calculated as SUV = A/(IA × BW), where A is the activity concentration within the volume of interest (Bq⋅mL−1), BW is body weight (g), and IA is injected activity (Bq). All calculated SUVs were decay-corrected using the half-life of 18F.
Statistical Analysis
Parameter values strongly deviated from a (log)normal distribution and are therefore presented as median and range. For comparisons of MRglc, SUVmax, pharmacokinetic rate-constants (K1–k3), and Vb across different genotypes, data were analyzed using the independent-samples Kruskal–Wallis test with the Dunn post hoc test. To test for differences between primary and metastatic PPGLs, the Mann–Whitney U test was used. Correlations were examined using the Spearman rank correlation test and presented as the fraction of the total variance explained (R2). Cutoffs for mutations in cluster 1 (SDHx, VHL) were determined using receiver-operating-characteristic curve analysis, and the area under the curve was calculated. Statistical analysis was conducted using SPSS 20 (SPSS Inc.) and Prism 6 software (GraphPad Inc.). A 2-sided P value of less than 0.05 was considered to be statistically significant.
RESULTS
The results of semiquantitative and quantitative PET/CT analyses are summarized in Table 2. Dynamic 18F-FDG PET/CT was directed at a single index tumor in the field of view of 1 bed position, except for patient 7, who had multiple lesions in the field of view. For this patient with metastatic disease, only the best-evaluable lesion was included in the data analysis, that is, a lymph node metastasis without necrosis or previous local treatment (131I-metaiodobenzylguanidine therapy and external radiotherapy).
18F-FDG PET/CT Parameters
Dynamic 18F-FDG PET/CT in PPGLs
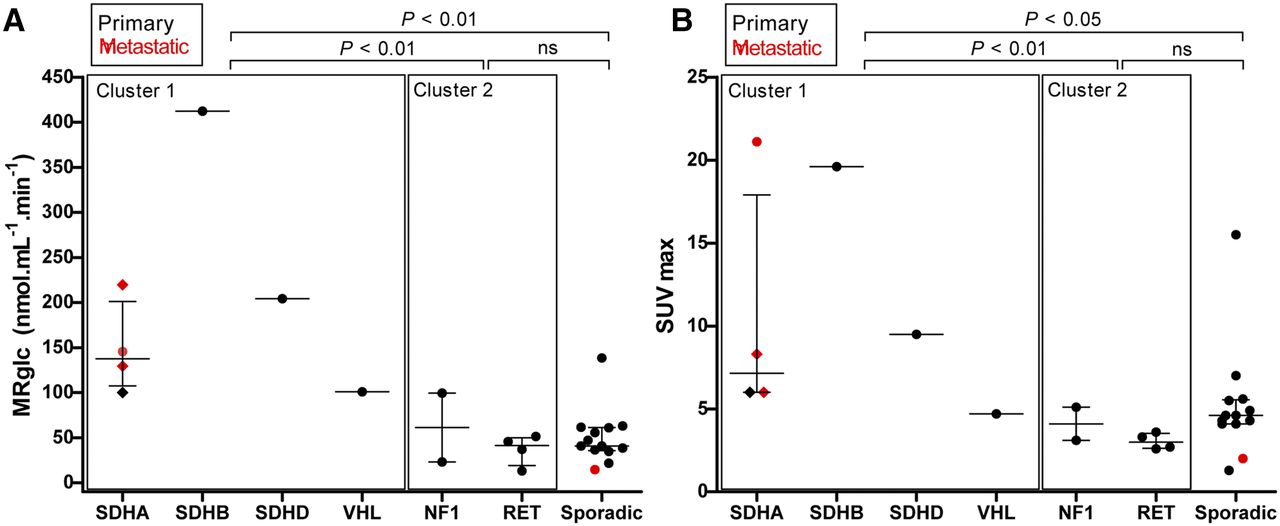
An example of a parametric image of MRglc is shown in Figure 2. The median MRglc for hereditary cluster 1 tumors (SDHx, VHL) was higher than that for hereditary cluster 2 tumors (RET, NF1) (P < 0.01) and apparently sporadic tumors (P < 0.01) (Fig. 3A).

Dynamic 18F-FDG PET/CT results in patient 24, with primary sporadic PPGL in left adrenal. (A) Parametric image of MRglc from dynamic 18F-FDG PET scan. (B) Static 18F-FDG PET/CT scan. (C) CT scan. (D) Image-derived input function and tumor time–activity curve. (E) Patlak plot. Slope of Patlak plot equals influx constant Ki

Scatterplots showing MRglc (A) and 18F-FDG SUVmax (B) in PPGLs across different genotypes. Horizontal bar represents median and interquartile range. Diamonds represent 3 different tumor locations in same patient (patient 7, Table 1). All SUVs are normalized for body weight and decay. P values are from Kruskal–Wallis with Dunn post hoc testing, and groups are compared as indicated. ns = not significant.
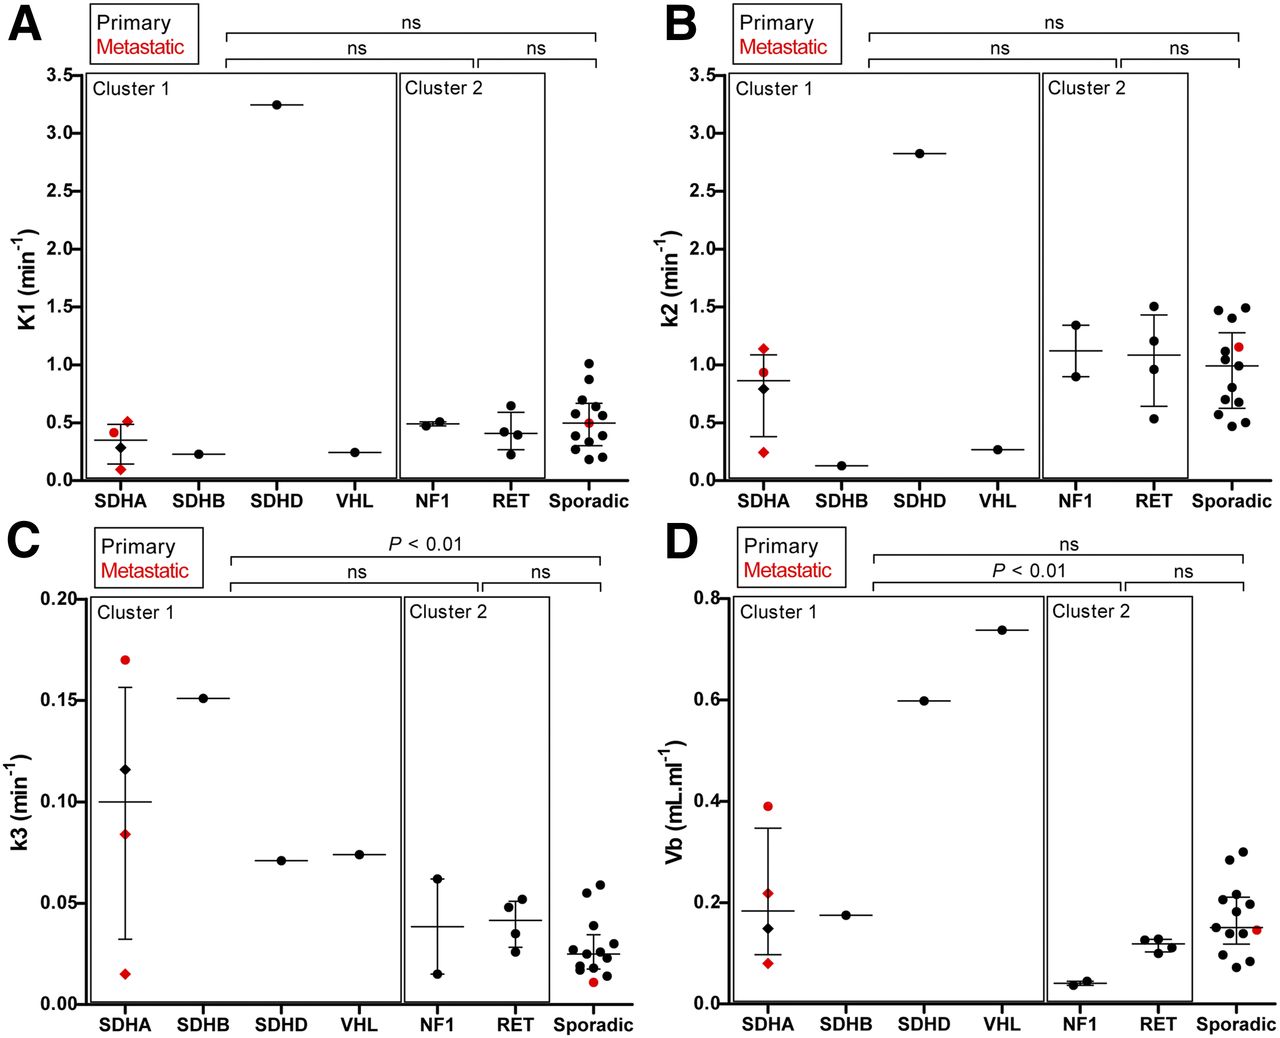
Pharmacokinetic rate-constants in PPGLs across hereditary and apparently sporadic tumors are shown in Table 3 and Figure 4. The median k3 for hereditary cluster 1 tumors (SDHx, VHL) was higher than that for apparently sporadic tumors (P < 0.01). The median Vb for hereditary cluster 1 tumors (SDHx, VHL) was higher than that for hereditary cluster 2 tumors (RET, NF1) (P < 0.01). Vb appeared to be independent of tumor location and size. To exclude bias toward metastatic lesions, and thereby toward genotype, a subanalysis was performed on primary lesions only, yielding similar results (Supplemental Table 1; supplemental materials are available at http://jnm.snmjournals.org).
18F-FDG Pharmacokinetic Rate-Constants for Primary and Metastatic PPGLs

Pharmacokinetic rate-constants (K1, k2, and k3) and blood volume fraction (Vb) in PPGLs across different genotypes. Horizontal bar represents median and interquartile range (IQR). Diamonds represent 3 different tumor locations in same patient (patient 7). P values are from Kruskal–Wallis with Dunn post hoc testing, and groups are compared as indicated. ns = not significant.
Static Versus Dynamic 18F-FDG PET/CT Across Genotypes
The median SUVmax for hereditary cluster 1 tumors (SDHx, VHL) was higher than that for hereditary cluster 2 tumors (RET, NF1) (P < 0.01) and apparently sporadic tumors (P < 0.05) (Fig. 3B).
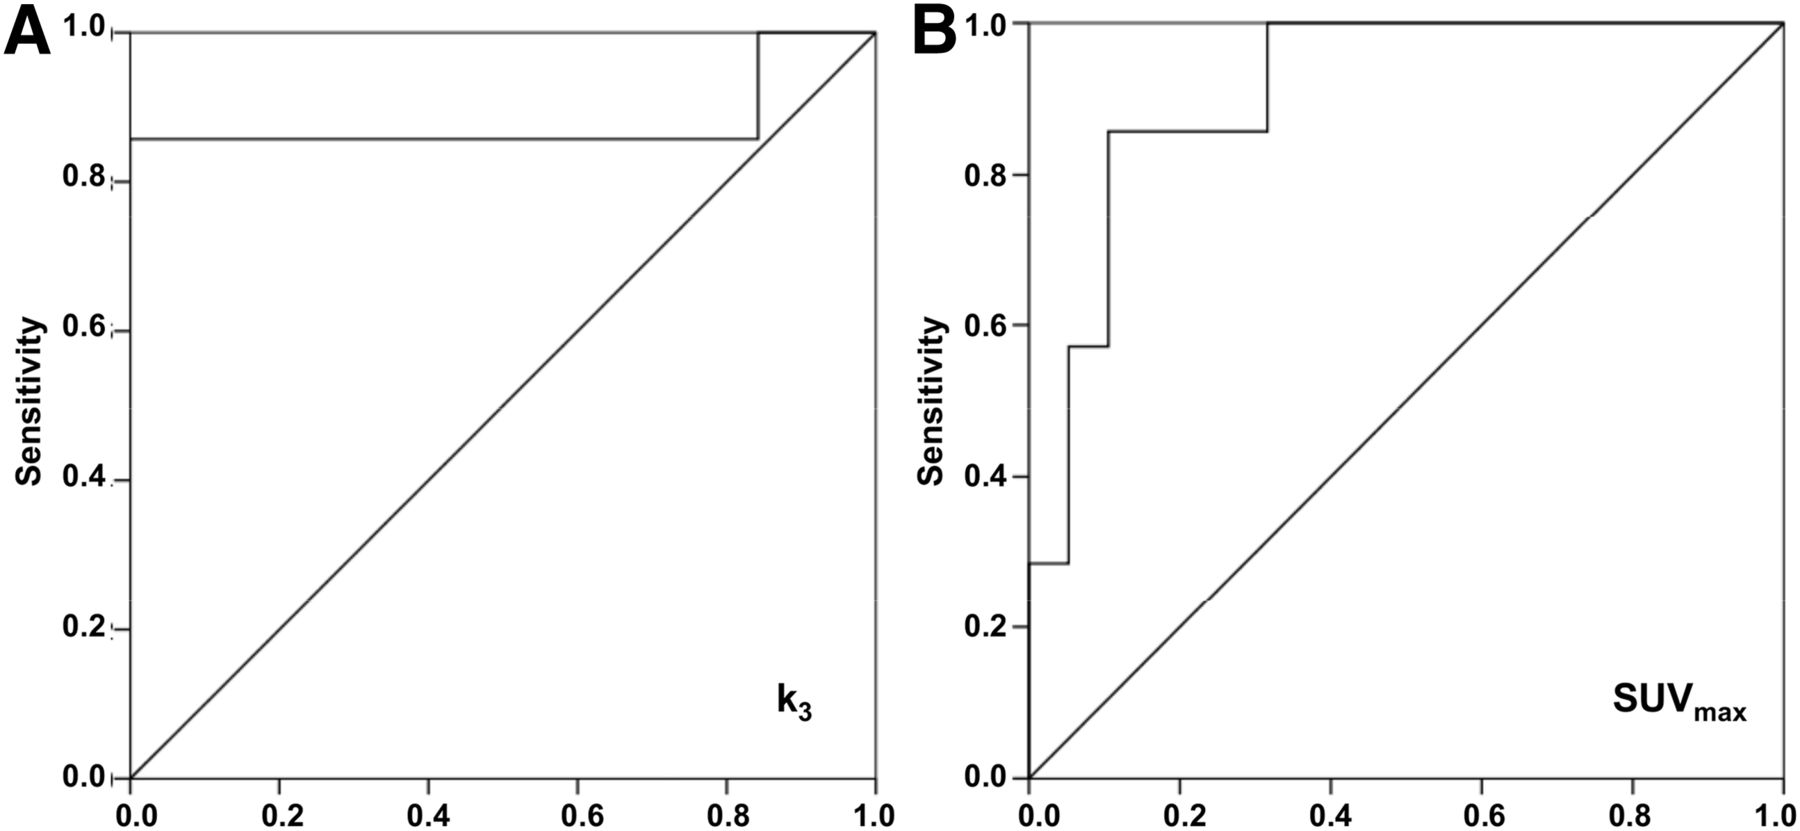
Receiver-operating-characteristic curves were determined for the k3 and SUVmax of all cluster 1 tumors (n = 7) and other (both cluster 2 and apparently sporadic, n = 19) tumors. The area under the curve was 0.880 for k3 (95% confidence interval, 0.66–1.00; Fig. 5) and 0.910 for SUVmax (95% confidence interval, 0.80–1.00; Fig. 5). To provide 100% sensitivity, the upper reference to distinguish cluster 1 tumors from other tumors was established at 0.071 min−1 for k3 (the minimum value for cluster 1 tumors), resulting in a specificity of 100%. To provide 100% sensitivity, the lower reference to distinguish cluster 1 tumors from other tumors was established at 4.7 for SUVmax, resulting in a specificity of 68.4%, which is lower than for k3.

Receiver-operating-characteristic curve for pharmacokinetic rate-constant k3 (A) and SUVmax (B). This curve was constructed from k3 and SUVmax of cluster 1 tumors vs. other (cluster 2 and sporadic) tumors in patients with PPGL. Diagonal line represents line of no discrimination.
Determinants of 18F-FDG Uptake in PPGLs
The correlation coefficients between MRglc and calculated SUVs and pharmacokinetic rate-constants are summarized in Table 4. MRglc significantly correlated with SUVmax (R2 = 0.475; 95% confidence interval, 0.291–0.882; P = 0.001) and k3 (R2 = 0.358; 95% confidence interval, 0.181–0.832; P = 0.002) (Supplemental Fig. 1). No correlations were found between MRglc and K1, k2, or Vb.
Determinants of MRglc
DISCUSSION
Our study provides the first quantitative assessment of in vivo MRglc in PPGLs across some genotypes, using dynamic 18F-FDG PET/CT scanning. We found profound genotype-specific differences in 18F-FDG pharmacokinetics between cluster 1 (SDHx, VHL) and cluster 2 (RET, NF1) or sporadic PPGLs. Both MRglc and SUVmax were significantly higher in cluster 1 PPGLs than in cluster 2 and sporadic tumors. Moreover, the glucose phosphorylation rate-constant k3 was significantly higher in cluster 1 tumors than in sporadic tumors, and the Vb was significantly higher in cluster 1 than in cluster 2. Furthermore, we demonstrated that k3 can be used to reliably distinguish between cluster 1 and other tumors.
PPGLs are usually benign, but up to 15%–20% develop into metastatic disease. Currently, there are no reliable histologic or molecular markers for malignancy. The strongest predictor for the development of metastases is the presence of a germline SDHB mutation (24). In addition, the prognosis is poorest in patients with metastatic PPGL due to an underlying SDHB mutation (8). Therefore, early identification of PPGLs of an aggressive or SDHB-related nature is key for proper management. Radionuclide imaging is instrumental for tumor localization but also for functional characterization of PPGLs (25).
We have previously shown that PPGL features on 18F-FDG PET/CT can point toward particular hereditary syndromes and can be used, along with other clinical characteristics, to guide the genetic testing (9,10,26). Using static 18F-FDG PET/CT, we have observed prominent 18F-FDG accumulation in SDHx and VHL PPGLs, exhibiting higher SUVs than other tumors. This finding is probably related to the fact that cluster 1 mutations result in an HIF-driven activation of the hypoxic–angiogenic pathway and metabolic shift toward aerobic glycolysis, known as the Warburg effect (16,27,28). However, 18F-FDG accumulation is influenced by many factors, such as the presence of necrosis, vascular density, activity of glucose transporters, and glycolytic enzymes (hexokinases). Therefore, the exact determinants of 18F-FDG uptake in PPGLs remains to be established.
Quantitative dynamic 18F-FDG PET/CT is considered the gold standard for measuring in vivo tumor glucose metabolism. MRglc provides the most accurate estimate of glucose consumption (29,30). The cellular expression and activity of hexokinases are best reflected by the pharmacokinetic rate-constant k3. The major hexokinase isoform, hexokinase-2, is regulated by HIF-1α and predominantly expressed in tumor cells that exhibit the Warburg effect (16,31). Okazumi et al. (32) found a significant correlation between k3 and hexokinase activity in liver tumors. Strauss et al. (33) demonstrated that K1 and k3 reflect gene activity of glucose transporters and hexokinases, respectively, and are correlated with their cellular expression. They also reported an association between k3 and HIF-1α (34). In the current study, we found increased k3 values in cluster 1 PPGLs, as well as a significant correlation between k3, MRglc, and SUV, suggesting that increased accumulation of 18F-FDG is determined largely by increased hexokinase activity. In contrast, K1–k2 values did not differ between clusters, suggesting that glucose transporter activity does not account for genotype-specific differences in 18F-FDG avidity.
Differences in 18F-FDG uptake could also reflect differences in tumor blood flow and, in parallel, the delivery and metabolism of 18F-FDG. The dynamic PET-derived parameter Vb represents the fraction of blood within the tumor lesion. We observed relatively high average Vb values in PPGL when compared with other types of tumors (34–36), but also a large variability between PPGLs. Favier et al. have shown that PPGLs are hypervascular tumors with highly heterogeneous vascular patterns (37). This is probably related to the genotype-specific impact on angiogenesis. They also found HIF-induced overexpression of vascular endothelial growth factor in SDHx and VHL-related PPGLs (16). We also demonstrated that vascular endothelial growth factor expression and endothelial surface area was higher in SDHx-related PPGLs than in cluster 2 and sporadic tumors (10). In line with this theory, we observed that Vb was significantly higher in cluster 1 than cluster 2 PPGLs and significantly correlated with SUVmax. Therefore, besides increased glycolysis, increased vascularity or blood perfusion may be largely responsible for the higher SUVmax in cluster 1 tumors.
Recently, Barbolosi et al. calculated the proportions of unmetabolized and metabolized 18F-FDG and kinetic parameters in a small number of sporadic primary PPGLs as compared with other tumors (36). Their model was based on a new mathematic approach that integrates a measurement error model without the acquisition of dynamic images. Interestingly, they found that as compared with other tumors, PPGLs were characterized by a relatively low glycolytic activity as expressed by a high proportion of unmetabolized 18F-FDG and relatively low k3 value. Furthermore, Ki (net influx rate constant) and Vb were relatively higher. In contrast to our current study, however, no comparisons were made between PPGLs of different genotypes. Nevertheless, we indeed also observed relatively low k3 values when compared with previous measurements of k3 in other tumors by our group (35). These results confirm that the glycolytic effect due to the Warburg effect might be less pronounced than in several other types of cancer. Besides a switch to glycolysis, increased uptake of 18F-FDG could also be affected directly by the accumulation and paracrine effects of the oncometabolite succinate, as was recently suggested by a recent study by Garrigue et al. (38). They demonstrated that exposure to succinate increased the in vivo 18F-FDG uptake in an adenocarcinoma xenograft mouse model. Additional in vitro studies showed that succinate did not affect 18F-FDG uptake by tumors cells per se but rather by endothelial cells. These results suggest the presence of a metabolic crosstalk between tumor cells and the microenvironment. The latter phenomenon has been previously described in PPGL by others (39). Unfortunately, our present study cannot further elucidate these mechanisms, since dynamic 18F-FDG PET cannot distinguish the metabolized and unmetabolized component of 18F-FDG in tumor cells versus stromal cells.
Although, on average, we found a significantly higher MRglc and SUVmax in cluster 1 PPGLs, individual values for both parameters considerably overlapped between cluster 1 and sporadic tumors. From a clinical point of view, it would be useful to identify the genotypes on the basis of functional imaging in individual patients, especially high-risk SDHB tumors. This step could be particularly useful in patients carrying variants of unknown significance. Our results suggest that dynamic 18F-FDG PET/CT could serve this purpose when hexokinase activity (k3) is considered. We acknowledge that this study is limited by the small sample size. Obviously, our results would need replication in a larger study sample that includes a better variety of genotypes, primary PPGLs in various locations, and metastases. Such a study would also permit analysis of within-cluster variability, such as SDHx versus VHL. In addition, there are some practical constraints to the clinical application of somewhat laborious dynamic PET in clinical practice. These, however, could be overcome by simplification of the protocol, such as in the Hunter method that was mentioned previously (36). Also, proton (1H) nuclear MR spectroscopy was shown to discriminate between SDH and non-SDH tumors by looking at the presence or absence of a succinate peak, respectively (40,41). This imaging technique could be complementary to dynamic PET/CT for in vivo metabolic profiling.
CONCLUSION
In vivo metabolic tumor profiling in patients with PPGL by assessing 18F-FDG pharmacokinetics can be better achieved using dynamic PET/CT than using static PET/CT. With this technique, cluster 1 PPGLs can reliably be identified by a high 18F-FDG phosphorylation rate.
DISCLOSURE
This research was supported by the European Union Seventh Framework Programme (FP7/2007-2013) under grant agreement 259735 (ENSAT CANCER). No other potential conflict of interest relevant to this article was reported.
Acknowledgments
We thank the PET/CT technologists from the Radboud University Medical Center for assistance with the dynamic PET/CT scans.
Footnotes
Published online Nov. 9, 2018.
- © 2019 by the Society of Nuclear Medicine and Molecular Imaging.
REFERENCES
- Received for publication July 3, 2018.
- Accepted for publication October 29, 2018.


Jump to section
Related Articles
Cited By...
- No citing articles found.