


Abstract
Small-animal PET provides the opportunity to image brain activation during behavioral tasks in animal models of human conditions. The present studies aimed to simplify behavioral imaging procedures without a loss of quantitation by using an intraperitoneal route of administration (no cannulation, no anesthesia) and using a standardized uptake value (SUV) to reduce scan duration. Methods: Sixteen animals with carotid artery cannulations were studied with 18F-FDG small-animal PET accompanied by serial arterial blood sampling. Ten of these animals were anesthetized and were inside the tomograph during 18F-FDG uptake, whereas 6 animals were awake in their home cages and scanned after 60 min of uptake. Of the 10 anesthetized animals, 6 received intraperitoneal 18F-FDG, whereas 4 received intravenous 18F-FDG, and all 6 awake animals received intraperitoneal 18F-FDG. Intravenously injected animals were positioned far enough inside the tomograph to obtain region-of-interest–based measures from the heart and the brain. In all animals, a full arterial input function and plasma glucose levels were obtained. To establish the optimal time during 18F-FDG uptake for blood sampling when using an SUV, a Patlak kinetic model was used to derive absolute rates of glucose metabolism and compared with SUVs calculated using different plasma points from the arterial input function. Results: A single plasma point taken at 60 min after injection for intraperitoneal injections or 45 min after injection for intravenous injections provides a sensitive index of glucose metabolic rate with the highest correlation with data obtained from a fully quantitative input function. Conclusion: These studies support an experimental protocol in which animals can receive the 18F-FDG tracer injection intraperitoneally, away from the small-animal tomograph and with minimal impact on behavior. Further, animals can occupy the tomograph bed for a 10- to 30-min scan with a consequent increase in animal throughput.
PET with 18F-FDG has been used in clinical brain imaging studies for decades and provides an effective measure of human brain function. In activation studies, it is assumed that changes in 18F-FDG uptake or metabolism reflect altered metabolic demand secondary to changes in neuron firing. In this way, regional changes in brain 18F-FDG uptake can reflect changes in brain function associated with performance on a cognitive or behavioral task. Advances in tomograph instrumentation now provide the ability to image animals in the same way as humans, where changes in animal behavior can be directly related to regional changes in rodent brain 18F-FDG uptake. However, there is significant concern that blood sampling from rodents for quantitative PET may alter normal physiology. Just as there have been many proposed methods to circumvent arterial blood sampling in human 18F-FDG PET experiments (1–3), similar efforts have been dedicated to establishing other strategies for quantitative rodent PET (4–6). The primary focus of these efforts has been the use of an image-derived input function by dynamic scanning of the heart (left ventricle) or another suitable organ, such as the liver (6–9), along with factor analysis to extract optimal input functions from the image itself (4). This approach requires a dynamic scan, where radiotracer injection commences with image acquisition, and the time course of radiotracer uptake characterizes the physiologic effect of interest. Because animals must be anesthetized while in the scanner, this is not currently feasible for small-animal behavioral neuroimaging.
One approach to get around the requirement for a dynamic scan is the use of a standardized uptake value (SUV). The SUV is a simple semiquantitative index, calculated by measuring the activity concentration in a region of interest (ROI) during a short-duration (typically, 10−30 min) static scan acquired late (typically, 45−60 min) after injection and then normalized for the injected dose or weight of the animal. The SUV provides a quantitative method that can accommodate a shorter scan duration; however; to be accurate, the SUV must be scaled to the injected dose or an arterial plasma sample. Here we compare SUVs scaled to both the injected dose and several arterial plasma samples to find the combination of factors that produces values that most highly correlate with metabolic rates of glucose metabolism calculated from a full kinetic modeling approach. The Patlak model provides a quantitative method in which linearity is established during the same time points as the static scan protocol we use for behavioral neuroimaging.
Our overarching goal was to establish a fully quantitative method for behavioral neuroimaging. The premise of behavioral neuroimaging with 18F-FDG in rodents relies on the fact that the animals are outside the tomograph and behaving during radiotracer uptake and are anesthetized only for a short duration at the end of the uptake period. Our 2 immediate goals, therefore, were (i) to compare measurements obtained after intraperitoneal versus intravenous injections and (ii) to compare values based on a calculation of the SUV using several single time points versus a kinetic model. We have found that intraperitoneal injections of radiotracer are particularly amenable to behavioral neuroimaging experiments, as these animals may undergo complex training protocols that last for a period of weeks or even years, and such studies can be compromised by a venous cannula.
MATERIALS AND METHODS
To optimize a quantitative behavioral imaging protocol in which 18F-FDG uptake occurs outside the tomograph and the animal is subsequently anesthetized and scanned, one group of animals served as a fully quantitative reference group. This group received an intravenous 18F-FDG injection and fully dynamic list-mode data were obtained, along with a complete input function. This same dataset was also analyzed as though the animals were outside the tomograph for the first 50−55 min of uptake, and the last 30 min of the dynamic scan (from 60−90 min) were isolated and analyzed for the SUV using input from several points on the arterial blood curve. These data were then compared with the fully quantitative metabolic rates obtained from the same studies. Identical experiments and the same quantitative strategies (SUV calculated from several different arterial blood samples and full kinetic analysis) were performed on another group of animals after intraperitoneal 18F-FDG administration. A third group of animals received intraperitoneal 18F-FDG outside the tomograph and a full arterial blood curve was obtained. These animals were anesthetized after 60 min of uptake and, again, the data were quantified using several points from the arterial curve as input. These studies were designed to investigate the applicability of intraperitoneal routes of radiotracer administration and also to investigate whether the SUV would be proportional to the metabolic rate of glucose (MRGlu) after intraperitoneal or intravenous 18F-FDG injections.
Ten 7- to 8-wk-old male Sprague–Dawley rats (mean ± SEM, 298 ± 11 g body weight) with preimplanted carotid artery catheters (polyurethane tubing, 0.64-mm inner diameter, 1.02-mm outer diameter, 10-cm length) were purchased from Taconic Farms. The catheters were implanted into the right carotid artery and subcutaneously tunneled to the back of the animals between the shoulder blades. All animals were examined once and fasted for at least 2 h before the start of the study. Animals were divided into 3 groups (Table 1): the first group was anesthetized and received intravenous injections of 18F-FDG during a dynamic acquisition (group 1, n = 4). The second group (group 2, n = 6) was identical to the first group, except that these animals received an intraperitoneal injection of 18F-FDG. The third group of animals received intraperitoneal 18F-FDG and were awake for a 60-min uptake period, followed by ketamine/xylazine anesthesia and a 30-min static acquisition (group 3, n = 4). In all 3 groups, full arterial blood curves were obtained from the tracer injection until the end of the scan. Data from the dynamic studies (groups 1 and 2) were quantified in 3 separate ways: (i) using the full blood curve and dynamic data to calculate the MRGlu; (ii) using an image-derived input function obtained from an ROI over the left ventricle of the heart, which was also in the field of view (Fig. 1); and (iii) using blood sampled from single time points to calculate 4 different SUVs using several points from the input function curve. These values were directly compared with fully quantitative MRGlu values using a correlation analysis. Data from the awake studies (group 3) were quantified with the SUV, using the same time points as groups 1 and 2.
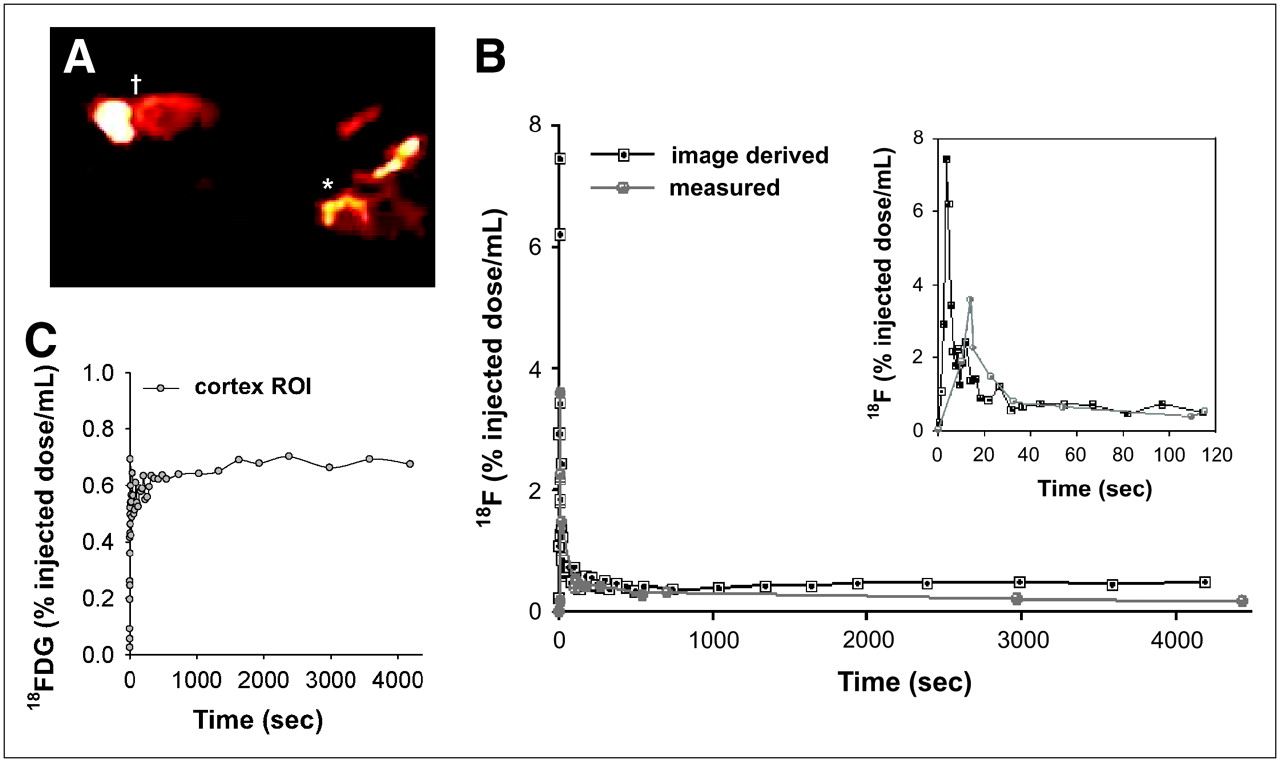
Strategy for comparing image-derived or measured 18F-FDG input function on estimates of MRGlu. (A) Radioactivity distribution of 18F-FDG is shown in sagittal slice from animal with a carotid artery catheter. Both the brain (†) and the heart (*) are in the field of view. The time–activity curve of 18F measured from an ROI over heart is presented with that sampled from carotid artery (B), and time–activity curve of cortical brain 18F-FDG uptake is given in C. Inset in B depicts expanded view of early time points illustrating the temporal resolution of scanner vs. manual measurements. This difference can be attributed to difficulty in rapidly sampling the blood in initial seconds after bolus injection.
Characteristics and Quantitation Methods Applied to Each Experimental Group
Small-Animal PET Studies
Animals were anesthetized with an intraperitoneal injection of ketamine/xyzlazine (100 mg/kg ketamine with 10% xylazine; Fort Dodge). For group 1 animals, a bolus injection of 18.5–37.0 MBq (500–1,000 μCi) 18F-FDG through a tail vein catheter (volume, 0.4−0.5 mL) was followed by a saline flush. Group 2 animals received an injection of 18.5–37.0 MBq 18F-FDG in 0.4−0.5 mL saline into the intraperitoneal cavity. Group 3 animals received an injection of 18.5–37.0 MBq 18F-FDG in 0.4–0.5 mL saline outside the tomograph. These animals were tethered to a Ratturn apparatus (Bioanalytical Systems, Inc.), which prevented the carotid line from tangling while the animals moved freely in the chamber. For group 1 and 2 animals, the acquisition began at the same time as the 18F-FDG injection. The emission scan was binned into 44 frames: 10 frames of 1 s each followed by 2 frames of 5 s, 4 frames of 10 s, 6 frames of 20 s, 2 frames of 60 s, 5 frames of 120 s, and 15 frames of 300 s, for a total scanning time of 5,400 s. Group 3 animals were anesthetized 60 min after the intraperitoneal injection and scanned using a static protocol consisting of 1 frame of 30 min. From all 3 groups of animals, timed arterial samples of approximately 50 μL were collected before injection, continuously for the first 2 min after 18F-FDG injection and then as close to 2, 3, 5, 8, 12, 20, 30, 45, 60, and 90 min as possible. Blood samples were immediately centrifuged and plasma was analyzed for 18F concentrations using a γ-well counter (Packard Instruments); selected samples (the first sample and again at 10, 45, and 90 min) were analyzed for glucose concentration using a routine diagnostic assay (Sigma Chemical Corp.). The mean of the last 3 glucose measurements was used to calculate the MRGlu.
Data Acquisition and Reconstruction
Emission data were collected using a first-generation microPET R4 (CTI/Siemens), housed in a temperature-controlled suite. The R4 tomograph has a transaxial resolution of 2.0-mm full width at half maximum in a 12-cm animal port, with an image field of view of 11.5 cm. Animals were placed in a prone position using a nylon stereotactic head-holding device manufactured by Kopf Instruments. All animals were placed in the center of the field of view. All microPET frames included subtraction of random coincidences collected in a delayed time window. 3-Dimensional (3D) sinograms were converted into 2-dimensional (2D) sinograms before image reconstruction. This was done with the process of Fourier rebinning. After Fourier rebinning, images were reconstructed by 2D filtered backprojection (FBP) using a ramp filter with cutoff at one-half the Nyquist criteria (maximum sampling frequency). Data were corrected for photon scatter using the method of tailfitting of the projections (10). At the time of these studies, the measured attenuation correction method available for this system used a 68Ge point source and contributed a degree of noise to the transmission scans (11). Therefore, attenuation correction was not applied. In general, attenuation-correction factors are constant over time and should not change the shape to the time–activity curves. Sinograms were first reconstructed using the manufacturer's FBP software. The volumetric resolution using this method is ∼5.0 μL at the center of the field of view on the basis of the 10-ns timing window and is less than ∼14 μL within a 1.0-cm radius. A complete performance evaluation of the scanner has been done by Knoess et al. (12). Scatter-corrected sinograms were also reconstructed using an iterative maximum-likelihood expectation maximization (MLEM) algorithm. The image pixel size in FBP-reconstructed images was 0.85 mm transaxially with a 1.21-mm slice thickness, and MLEM-reconstructed images had a pixel size of 0.4 × 0.4 × 1.21 mm.
Sinograms were summed for MLEM reconstruction, and ROIs were drawn on these summed, MLEM-reconstructed images. These ROIs were then transferred to dynamic FBP-reconstructed images for estimation of the time course of regional 18F-FDG uptake. Data from each animal were coregistered to a template scan developed according to methods described in Schiffer et al. (13). Briefly, each image was coregistered to the template scan using a mutual information (MI) algorithm with Powell's convergence optimization method implemented with the Pixelwise Modeling (PMOD) software package (www.pmod.com). An ROI template was developed in PMOD based on a digital atlas of the rat brain (14), which was subsequently applied to all microPET data. The ROI template included 10 regions based on a functional atlas of the rat brain (15); see Table 2. The mean volume of all ROIs was 0.86 cm3 and the shapes were elliptic or round. Because the SPM rat atlas template is in Paxinos and Watson (1986) stereotactic space, the center of all ROIs corresponded to the location of the region in the 3D coordinate plane (given in parentheses earlier). The center coordinates and volume of each ROI are given in Table 2.
ROI Location and Volume in Paxinos and Watson (15) Stereotactic Rat Brain Space
Image Processing and Analysis
To compare blood-pool input functions obtained using an ROI over the heart-to-blood activity concentrations measured directly, 3 or 4 transaxial slices encompassing the heart were manually selected, and the first 5 frames of radioactivity distributions were summed (first 5 s). An ROI was drawn over the heart in these frames with the best approximation over the left ventricle (Fig. 1). MRGlu values were calculated using the Patlak graphical method (16), in which: Eq. 1where CTissue represents the concentration of 18F in tissue and Cplasma represents the concentration of 18F in arterial plasma at time t. The measured activity in tissue is divided by plasma activity and plotted at a “normalized time” (integral of input curve from injection divided by instantaneous plasma activity). For systems with irreversible compartments such as 18F-FDG in the brain, this plot will result in a straight line after sufficient equilibration time. The slope and the intercept must be interpreted according to the underlying compartment model. For 18F-FDG, the slope is equivalent to the influx constant Ki:
 Eq. 2and represents the influx, whereas the intercept V equals:
 Eq. 3where V0 is the distribution volume of the reversible compartment C1, and VB is the fractional blood volume (2% for a rat).
For 18F-FDG, the MRGlu can be obtained from the regression slope using the lumped constant (LC) of 0.58 for a rat (17) and plasma glucose level (PG) according to the following: Eq. 4
Eq. 4
MRGlu was calculated from this Patlak graphical method from the time course of radioactivity of 18F-FDG in the brain and plasma. The same data underwent 2 separate SUV analyses. In the first analysis, the SUV was determined from body weight, glucose, and the concentration of 18F in plasma obtained at 4 separate time points. These samples were collected at the peak of 18F concentration in the blood (10.2 s for intravenous administration and 15 min for intraperitoneal administration), and at 45, 60, or 90 min after injection: Eq. 5
Eq. 5
In this equation, nCi/mL indicates nanocuries per milliliter of brain tissue, Cp represents the concentration of plasma radioactivity in a given sample (nCi/mL), and glu is the measured glucose level at the time of the sample collection. The second SUV analysis substituted Cp for the injected dose of radioactivity: Eq. 6where all parameters are the same as in Equation 5 except that, in this case, ID indicates the injected dose of radioactivity in microcuries. These 2 approaches were used because of the inherent variability in intraperitoneal injections, under the hypothesis that for intraperitoneal injections, plasma samples rather than the injected dose provide a more accurate index of 18F-FDG uptake in the brain.
Thus, the Patlak model was used with image-derived input functions (an ROI drawn over the left ventricle of the heart), compared with arterial plasma samples from the same animals and the same scanning session. These data, in turn, were compared with an SUV calculated using arterial and image-derived plasma data from several discrete time points. Each of these approaches was performed on animals that received an intravenous or an intraperitoneal injection of 18F-FDG.
The accuracy of using a single plasma sample at different time points for determination of the SUV was evaluated in animals that received intraperitoneal or intravenous 18F-FDG. As previously suggested (1), the optimal sampling time for SUV determination was selected on the basis of correlation analyses. This was done as follows: The Pearson linear correlation coefficients between the SUV calculated with a single plasma sample and the MRGlu were calculated across all subjects for selected sampling time points. These time points were at the peak plasma concentration (which differs between intraperitoneal or intravenous injections) and later at 45, 60, and 90 min after injection. The single plasma time point giving the highest correlation coefficient was assumed to yield the SUV most representative of MRGlu. Identical calculations were performed with both intraperitoneally or intravenously injected animals, and the optimal time point was selected for each route of administration.
RESULTS
Plasma glucose levels ranged from 4.01 to 14.75 mmol/L in both groups and did not significantly differ between animals given intraperitoneal or intravenous 18F-FDG. Over the time course of the scan (90 min), glucose levels rose but were not significantly different at the 90-min time point relative to the initial sample (7.5 ± 3.0 vs. 11.1 ± 4.9 mmol/L [mean ± SD] from the initial and final glucose samples, respectively). When all animals were pooled with data from the last 2 frames of the emission scan, there was a significant negative correlation between glucose levels obtained during the scan (mean of 45- and 90-min points) and whole-brain 18F-FDG uptake (R2 = 0.752, y = −0.0015x + 12.6; P < 0.001). Thus, brain 18F-FDG uptake was inversely proportional to plasma glucose levels.
Figure 1 depicts the strategy used here for comparing measured input function versus image-derived input function. The latter used an ROI over the left ventricle of the heart (Fig. 1A). With this approach, the peak concentrations of 18F-FDG occurred at 2.5 s in the image-derived input function (Fig. 1C). From the same animal, the measured peak concentration of 18F in plasma occurred 10 s after the start of injection. This was consistent with all 4 animals given intravenous 18F-FDG (Fig. 2), where there was a significant delay in the measured versus the image-derived peak. Although the image-derived concentration curve appears to more accurately catch the initial activity after a bolus of 18F-FDG, there is poor agreement at the tail of the distribution, or at later time points. In fact, at later time points, the 2 curves oppose each other; where there is continuously decreasing activity in the measured blood curve, activity in the image-derived curve increases (Fig. 1). It is at these later time points that the Patlak method relies on the slope of the input function and tissue concentration of 18F-FDG in a given ROI. This may be one explanation for the low and sometimes negative values for MRGlu obtained from image-derived time–activity curves.
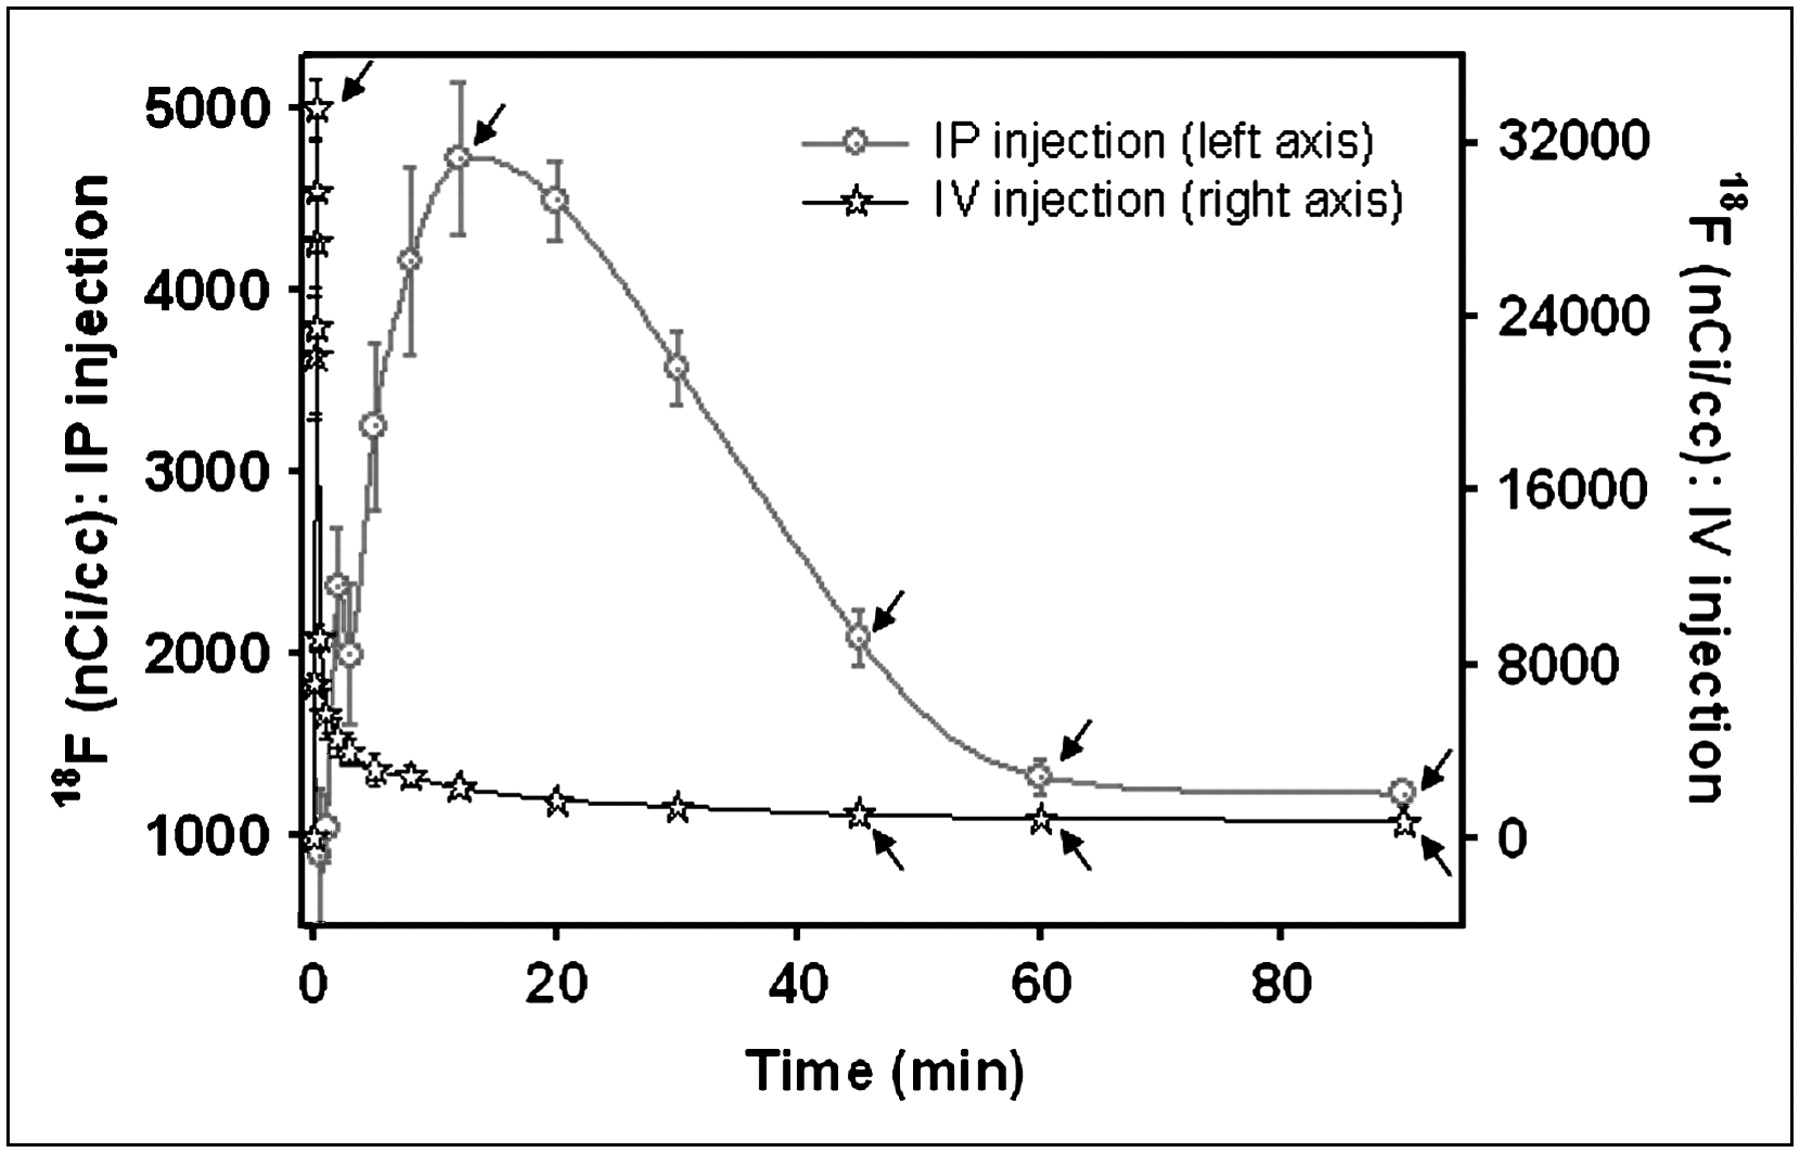
Time–activity curve of measured 18F in plasma after intraperitoneal (IP) or intravenous (IV) injection of 18F-FDG. Each point represents mean ± SE for 4 animals injected intravenously and 6 animals injected intraperitoneally. Arrows indicate time points chosen for the input function in calculation of SUV.
The measured arterial input function (normalized by the injected dose of activity) is depicted in Figure 2. The peak concentration of measured 18F after intravenous administration was 10 s. With intraperitoneal 18F-FDG, peak plasma concentrations occurred 15 min after injection. Twelve brain regions were examined (location and volumes are given in Table 2) to assess (a) the differences in intraperitoneal versus intravenous MRGlu and (b) the optimal time point for obtaining a single blood sample after each route of administration. In this case, optimal is defined as the plasma time point (concentration in plasma or Cp) that yielded results that most closely matched the MRGlu obtained using the Patlak quantitative method. For animals given intraperitoneal 18F-FDG (Table 3), average cortical values for MRGlu determined using the Patlak method correlated highly with those of animals given intravenous 18F-FDG (values are given in Table 4; R2 = 0.3472, P = 0.044). In Figures 3 and 4, the correlation between Patlak-derived MRGlu and SUVs are given for each individual animal after an intraperitoneal (Fig. 3) or intravenous (Fig. 4) injection. Figures 3A and 4A depict the SUV calculated using plasma 18F concentrations at the peak of the blood curve, which was 10.2 s in intravenously injected animals and 15 min in animals given intraperitoneal 18F-FDG. These times are indicated by arrows in Figure 2. Figures 3B and 4B depict the correlation between Patlak-derived MRGlu and SUV, where the SUV was calculated from a plasma point taken 45 min after injection for intraperitoneal (Fig. 3) or intravenous (Fig. 4) 18F-FDG. For both routes of administration, the correlation was significant at P < 0.01. For intraperitoneally injected animals, the correlation between MRGlu and SUV is strongest when calculated from a blood sample taken 60 min after injection (Figure 3C). For intravenously injected animals, the strongest relationship between MRGlu and SUV occurred with plasma taken 45 min after injection (Figure 4B). At later time points, the correlation coefficient decreases, presumably as the single plasma point used for the SUV calculation becomes less representative of the actual input. If the injected dose is used instead of plasma points (Eq. 5), the correlation coefficient relating SUV to MRGlu is 0.61 for intravenous 18F-FDG injections (significant at P < 0.01) and 0.43 for intraperitoneal administration (P < 0.05).

MRGlu and 18F-FDG uptake after intraperitoneal (IP) 18F-FDG. Plots of 18F-FDG uptake at several time points vs. glucose metabolism measured by fully quantitative Patlak plots are shown. Each symbol represents data from a different animal (indicated in legend). Whereas SUVs at later time points are significantly correlated with MRGlu, SUVs calculated from earlier time points or from injected dose are not, thus suggesting that behavioral neuroimaging experiments that use intraperitoneal routes of administration should obtain at least 1 blood point at least 60 min after injection.
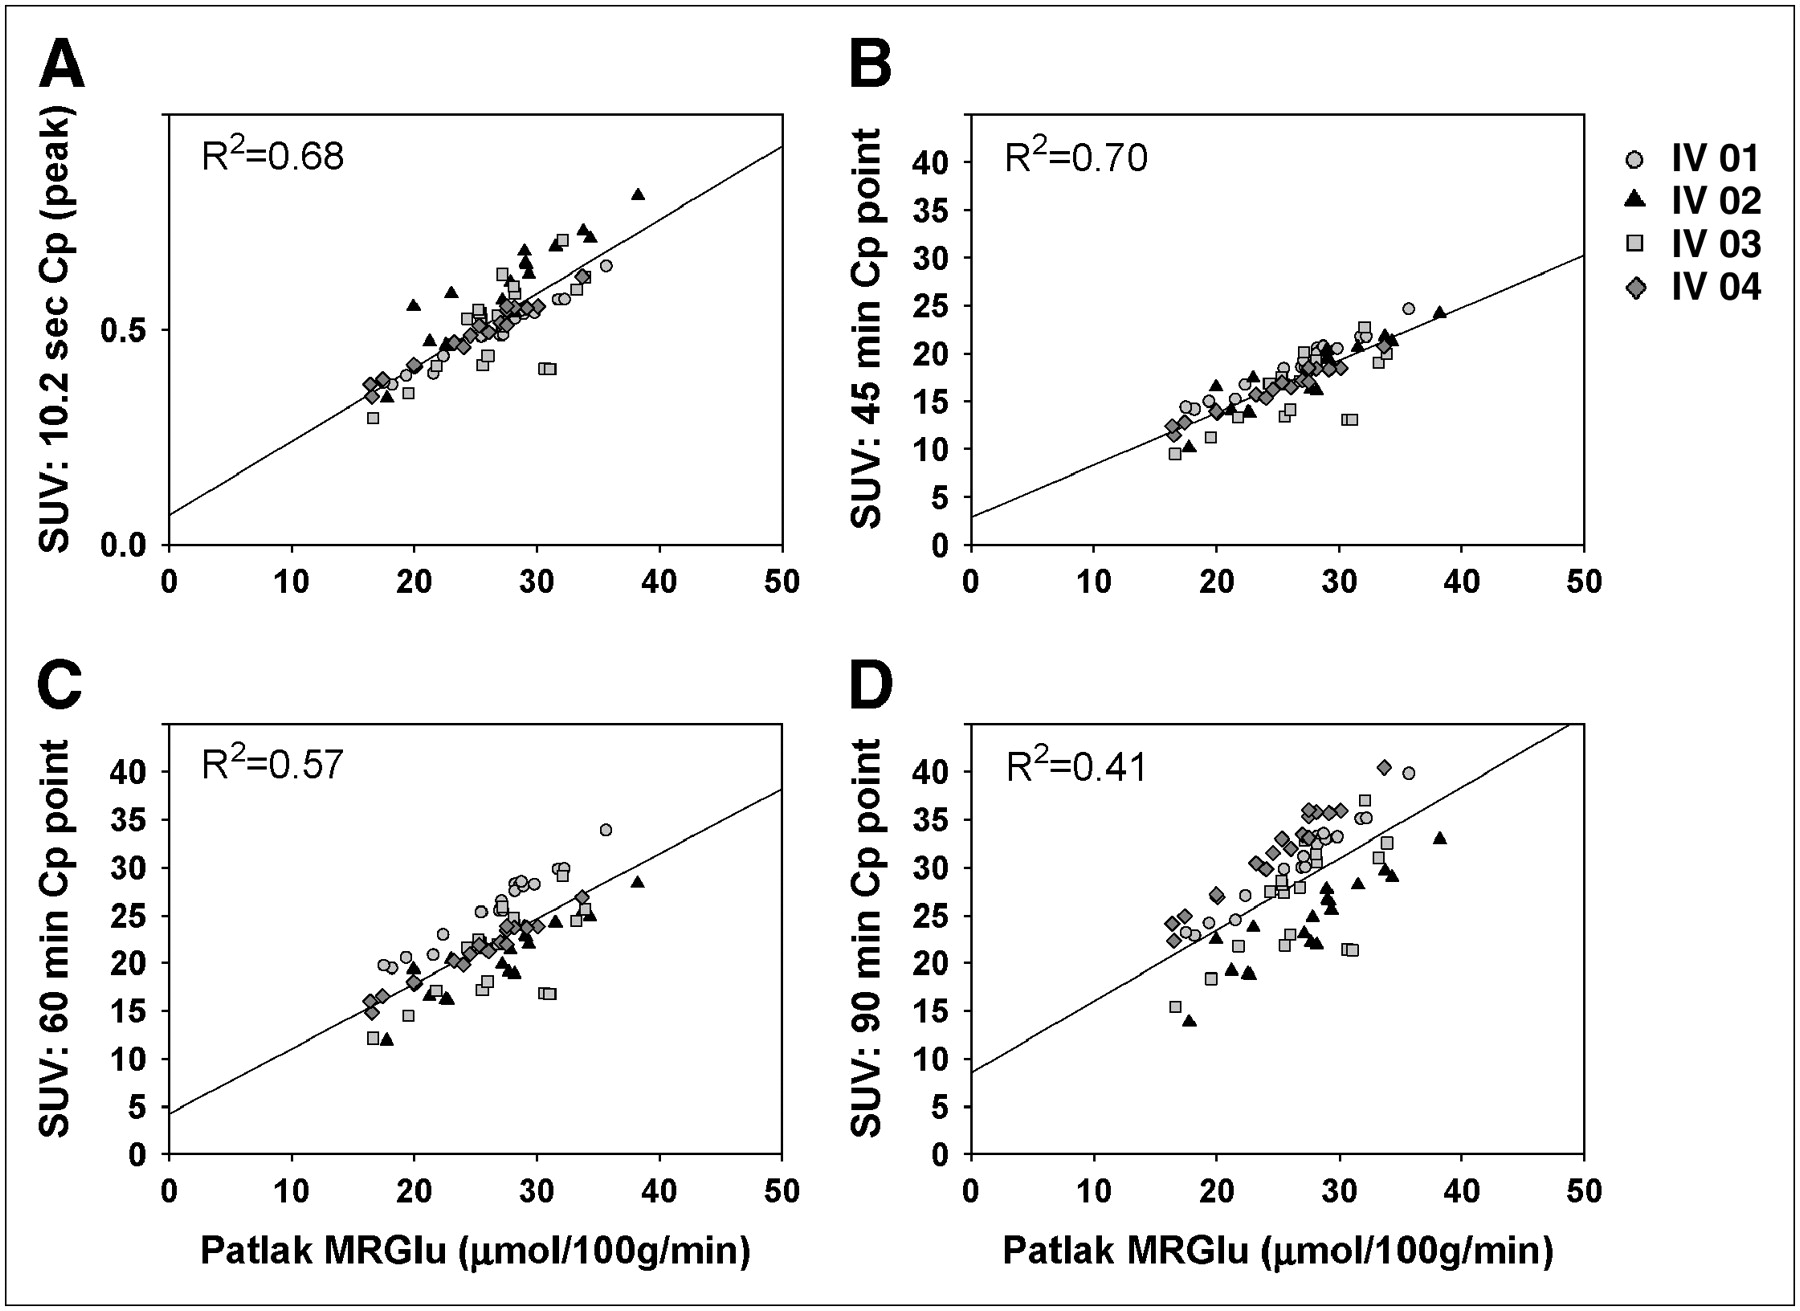
MRGlu and 18F-FDG uptake after intravenous (IV) 18F-FDG. Plots of 18F-FDG uptake at several time points vs. rate of glucose metabolism measured by fully quantitative Patlak plots are shown. Each symbol represents data from a different animal (indicated in legend). Here, the most significant correlations are obtained from earlier time points, with the optimal time after injection being 45 min. Unlike intraperitoneal injections, here there was also a highly significant correlation between glucose metabolic rate and SUV calculated using the injected dose of 18F-FDG (R2 = 0.61, P < 0.01).
Intraperitoneal 18F-FDG: Regional Comparison of Rate of Glucose Use with 18F-FDG Uptake Using a Single Time Point as Input for SUV
Intravenous 18F-FDG: Regional Comparison of Rate of Glucose Use with 18F-FDG Uptake Using a Single Time Point as Input for SUV
Table 5 gives the SUVs calculated using the 4 different time points in animals that were awake for uptake and received an intraperitoneal injection of 18F-FDG. At each time point, these values were significantly higher than the same regional SUV calculations obtained from anesthetized animals (P < 0.001 at all time points, Student t test).
Intraperitoneal 18F-FDG in Awake Animals: Regional SUVs Using a Single Time Point as Input
These studies also show that the heart is not a useful input region because of spillover from the surrounding myocardium; a single plasma point from the input function taken at 60 min after injection for intraperitoneal injections or at 45 min after injection for intravenous injections provides a measure of relative glucose metabolism that is highly correlated with measures of MRGlu that were obtained from a fully quantitative input function.
DISCUSSION
The premise of behavioral neuroimaging with 18F-FDG in rodents relies on the fact that the animals are outside the tomograph during radiotracer uptake and are anesthetized only for a short duration at the end of the uptake period, eliminating the possibility of capturing an image-derived input function or using a β-sensitive probe (18) or arteriovenous shunt (19) to measure the intravascular radioactivity online. This is possible because the 2-deoxy derivative of glucose (2-deoxyglucose) is transported and phosphorylated by hexokinase to the 6-phosphate but is not metabolized further. Glucose-6-phosphatase does not recognize 18F-glucose-6-phosphate because of the missing hydroxyl group and so the labeled molecule is trapped and can be imaged late after the injection. Thus, whereas human subjects can be performing tasks in the tomograph in a fully conscious state, small-animal imaging studies require that the animal perform a given task outside the tomograph and then be anesthetized and scanned.
Behavioral neuroimaging is also predicated on the ability to simplify quantitative image analysis to a single static uptake parameter (20,21). One criticism of the SUV is that it is subject to too many sources of variability that have not been well controlled or even considered in reported experiments. Here, we have attempted to find those parameters that lead to the most quantitative approach for behavioral imaging, without the requirement of a chronically placed cannula, full arterial curve, or intravenous radiotracer injection.
The present study was undertaken to investigate the feasibility of intraperitoneal 18F-FDG injections for behavioral neuroimaging studies and to establish the optimal parameters for quantitation of these data. Intraperitoneal radiotracer injections are experimentally more feasible for behavioral imaging experiments, as they do not require a chronically placed catheter. However, there are few studies of possibilities for quantitating intraperitoneal injections of 18F-FDG, and before this route of administration can be routinely used it is important to optimize experimental protocols relative to more established routes of administration. For example, if a single blood point is used for the SUV input function, the optimal sampling time for intravenous 18F-FDG is 45 min, whereas the optimal sampling time from an animal given intraperitoneal 18F-FDG would be 60–90 min. These studies have also shown that, under these conditions, a single blood point can be used as input for the SUV and yield similar values as MRGlu calculated using the Patlak method (Tables 3 and 4).
The rate of uptake was different between intravenously and intraperitoneally injected animals. Intravenously injected animals took up the 18F-FDG in <10 min, but it took 30 min for the intraperitoneally injected animals to attain the same level of brain uptake. At the time of peak plasma 18F concentrations, there appears to be a 10-fold difference in the calculated SUV for intravenous versus intraperitoneal routes of administration, whereas at later sampling times these values do not differ (Tables 3 and 4). In addition, values for animals injected in the awake state are much higher than those for anesthetized animals (Table 5), consistent with previously reported results (22). Most likely this difference is due to the lower values for plasma radiotracer concentrations at the peak after an intraperitoneal injection (0.09%–0.16% of the injected dose at the 15-min peak) versus after an intravenous injection (6%–8% of the injected dose at the 10-s peak). Thus, after an intraperitoneal injection, peak plasma concentrations never reach the vicinity of peak concentrations after an intravenous injection. This makes sense, considering the fact that the former must filter through the peritoneal cavity before reaching the bloodstream, whereas the latter is injected into the bloodstream directly. Finally, the observed difference in the rate of uptake allows the investigator to choose the route of injection according to the time profile of the stimulus. For example, in pharmacologic studies where drug-induced changes occur in a slow time sequence, it might be advantageous to use the intraperitoneal route of administration over intravenous administration. Alternatively, for stimulation experiments that are immediate cause-and-effect situations, one might prefer to use the intravenous route of administration so that stimulation can be maintained for a shorter time period. Nevertheless, the present studies and others (23) show that at later time points, which are relevant to behavioral imaging protocols, the 2 routes of administration provide virtually identical quantitative values (Tables 3 and 4).
One difference between the 2 routes of administration is the correlation between SUV calculated with the injected dose (SUVID) and MRGlu. When given intravenously, the correlation between SUVID and glucose metabolism is near unity and the relationship between the 2 is highly significant. However, although intraperitoneal 18F-FDG yields only a slight correlation between SUVID and the calculated metabolic rate, both routes give significant correlations when the SUV is calculated from plasma concentrations. We propose that the SUVs are different because of the variability inherent in intraperitoneal injections. Intravenous injections introduce the radioactivity into the bloodstream directly, from which it is delivered to the brain and other organs. Intraperitoneal injections deliver the radioactivity to the peritoneal cavity, from which it must enter the bloodstream by passive diffusion through the peritoneal wall into capillaries and vessels. The amount of activity that reaches the brain and other organs becomes dependent on the rate and the amount of radioactivity transported from the peritoneal cavity to the bloodstream. The reason for this most likely lies in the variability inherent in intraperitoneal injections — some animals are injected with a mCi, only a fraction of which enters the bloodstream while other animals have much higher penetration from the peritoneum. Thus, using only the injected dose to calculate uptake values can lead to spurious results, especially if the volume of tracer is different (e.g., soon after delivery yields a high radioactivity concentration in a low volume, whereas animals injected with the same delivery later in the experiment may receive an identical dose in a much larger volume). Thus, it is advised to always inject the tracer in the same volume and to maintain this volume between 0.5 and 0.8 mL for intraperitoneal routes of administration. Higher tracer concentrations in smaller volumes may lead to accumulation in organs surrounding the peritoneal cavity, diminishing the amount of tracer available to the bloodstream and altering the kinetics of the tracer.
Because the SUV measures total activity in an ROI at a single time point and the Patlak method incorporates the time course of this activity in the brain and in the blood, variability due to cardiac output or other cardiac parameters may affect the ability to use the SUV from a single time point. The Patlak slope uses the integral under the arterial input function (i.e., the sum of all of the available 18F-FDG to the ROI, or the “available dose”) for normalization. The SUV approximates this integral from either the injected dose or a single plasma point, divided by the body weight of the animal. Changes in cardiac output would be accounted for by the dynamic Patlak model but would be obscured by the SUV model. The 2 approaches do not yield identical values, even at the “optimal” blood sampling time point demonstrated here (60 min in Fig. 3 or 45 min in Fig. 4). Agreement between SUV and Patlak has been shown to be higher in peripheral tumors if the integral of plasma input is used for calculation of the SUV (24). Using the integral of plasma input would account for variability in cardiac parameters and perhaps tighten the correlation between calculated SUV- and Patlak-modeled data in the brain as well.
In anesthetized animals, the average whole-brain MRGlu calculated in the present study using the Patlak method and a full arterial curve was 29.7 ± 0.95 μmol/100 min/mL for intravenous 18F-FDG and 27.3 ± 1.78 μmol/100 min/mL for intraperitoneally injected animals (Tables 3 and 4). This is in good agreement with the results from earlier quantitative rodent PET studies (22,25), albeit lower than values obtained using autoradiographic methods (26). In animals that were not anesthetized for uptake, calculated SUVs were significantly higher than the SUV calculated in the anesthetized animals (Table 3 vs. Table 5). Two reasons for this are that the ketamine/xylazine cocktail directly interacts with plasma glucose (27) or that, globally, anesthesia decreases the rate of brain glucose metabolism (22).
In general, the image-derived time–activity curves yielded higher peak maxima than the well counter blood sample data (Fig. 1), suggesting an underestimation of the peaks even when rapid blood sampling techniques were used. The external blood sampling and the measured input curve derived from the list-mode image automatically differ because of the sampling and the calibration, as has been shown previously (5,27–29). In particular, Wu et al. (30) compared the input function derived from an ROI in the left ventricle of small primates with the input function derived from blood sampling and well counting. These authors found that a factor-analysis–derived input function combined with a blood sample from a late time point provided accurate measurements of the rate of glucose metabolism derived from either a compartmental or Patlak graphical analysis. However without the factor analysis, for which the entire time course of activity is needed, the spillover activity due to the overlap of the blood pool and myocardium cannot be ignored. Our thrust is behavioral neuroimaging, where animals receive the 18F-FDG tracer injection away from the tomograph while performing a behavioral task, so factor analysis or other dynamic extraction methods are not practical. Because the static images are acquired at a late time point after injection, and because data show that the cardiac blood pool is contaminated by myocardial spillover at these time points, an image-derived input function is not practical either. Other sources for image-derived input functions could potentially include the carotid artery, which is not biased by extremely active surrounding muscle. However, resolution limits the use of this region as well.
We opted for the Patlak analysis because this method gives a quantitative value that, for the most part, relies on time–activity data obtained during the last few time frames of a PET experiment—that is, the ratio of tissue to plasma 18F concentrations yields a curve that eventually approaches a straight line, the slope of which is proportional to the rate of glucose metabolism. The time points at which the Patlak plot became linear were those time points used for the SUV analysis. Whereas a nonlinear least-squares kinetic analysis of the complete tissue uptake data allows determination of the individual rate constants, we used a quantitative method that isolated the time points of interest for a behavioral imaging experiment. We maintain that the initial time frames can either be spent inside the tomograph (anesthetized) or outside the tomograph, awake and behaving. Therefore, of the available quantitative methods, we chose the one that most closely reproduced the awake and behaving experimental condition. This encompassed the last 30 min of the scan, which was divided into 6 time points (6 frames of 5 min each).
One limitation of the Patlak method and of the SUV analysis proposed is that both assume no dephosphorylation of 18F-FDG-6-phosphate by the enzyme hexose phosphatase (k4 = 0). This assumption is based on 2 pieces of evidence, both highly debated: (a) low values for brain hexose phosphatase activity in the rat (26,31)—although see (32)—and (b) autoradiographs made 17 and 24 h after an intravenous injection, which indicated half-lives for regional 2-deoxyglucose phosphate loss of 6–10 h (26). However, the negligible k4 assumption was called into question by a report from Hawkins and Miller, who reported half-lives for tissue deoxyglucose phosphate loss of between 70 and 100 min (33). The controversy surrounding the influence of k4 on measurements of the MRGlu (34) has been largely resolved with the general consensus that, if it is a concern, it can be readily incorporated into quantitative models (35). Our own previous experiments found values for k4 in the rat of 0.008 min−1 during a 60-min scan (13). Because the fractional rate of dephosphorylation becomes increasingly important as time proceeds, shorter scanning durations (e.g., 10 instead of 30 min) should be considered for behavioral imaging experiments.
Because glucose competitively inhibits 18F-FDG transport across the blood–brain barrier and its phosphorylation by hexokinase, plasma glucose levels can influence estimations of MRGlu and even 18F-FDG uptake. Our findings are consistent with this, showing that as plasma glucose levels decrease, brain 18F-FDG uptake increases. This observation supports the importance of including plasma or whole-blood glucose levels in any estimations of standardized 18F-FDG uptake. In an animal study examining the effects of hyperglycemia, Wahl et al. (36) reported that as plasma glucose is increased the 18F-FDG uptake in the brain is decreased. It has also been shown that certain types of anesthesia, such as ketamine/xylazine, have effects on plasma glucose levels (37).
CONCLUSION
Minimal blood sampling is a requirement for rodent imaging, and maintaining chronically implanted catheters can be problematic, especially in application to these types of behavioral experiments. The SUV as a quantitative outcome measure provides the advantage of requiring only a single blood point; however, it is based on the underlying assumption that tissue radioactivity is a good measure of the rate of glucose use. This may be the case only if appropriate variables are taken into account and if certain experimental parameters are controlled. Common examples applied to SUV calculations include failure to standardize measurement times after injection, failure to correct for body weight, and failure to correct for plasma glucose levels. Therefore, we recommend that the time from injection to measurement must be held constant to eliminate, or at least minimize, the time dependency of the SUV. This time should be 60 min for an intraperitoneal injection or 45 min for an intravenous injection. Appropriate corrections for body weight and plasma glucose levels should be applied, and a single 18F blood point should be used in favor of the injected dose for SUV input. Where structures are small and the anatomic geometry is complex, as in the rodent brain, absolute determinations of tracer uptake—be it 18F-FDG or a specific neuroreceptor ligand—should be viewed with caution.
Acknowledgments
This research was supported by National Institutes of Health grants DA15082, DA16025, and DA15041 and performed under Brookhaven Science Associates contract DE-AC02-98CH10886 with the U.S. Department of Energy. We greatly appreciate the efforts of Dianne Lee, David Alexoff, Colleen Shea, Lisa Muench, Youwen Xu, and Drs. Mike Schueller, Paul Vaska, Richard Ferrieri, and David Schlyer and the technical assistance from James Anselmini, Steve Howell, and Barry Laffler in the Brookhaven National Laboratory Chemistry Department.
References
- Received for publication August 26, 2006.
- Accepted for publication November 9, 2006.


Jump to section
Related Articles
Cited By...
- Anti-A{beta} immunotherapy-mediated amyloid clearance attenuates microglial activation without inducing exhaustion at residual plaques
- Early brain neuroinflammatory and metabolic changes identified by dual tracer microPET imaging in mice with acute liver injury
- Remote Neuroinflammation in Newly Diagnosed Glioblastoma Correlates with Unfavorable Clinical Outcome
- In Vivo Evaluation of Brain [18F]F-FDG Uptake Pattern Under Different Anaesthesia Protocols
- SV2A PET Imaging Is a Noninvasive Marker for the Detection of Spinal Damage in Experimental Models of Spinal Cord Injury
- 27-Hydroxycholesterol impairs neuronal glucose uptake through an IRAP/GLUT4 system dysregulation
- Impact of Image-Derived Input Function and Fit Time Intervals on Patlak Quantification of Myocardial Glucose Uptake in Mice
- Evaluation of Mouse Tail-Vein Injections Both Qualitatively and Quantitatively on Small-Animal PET Tail Scans
- Effects of Administration Route, Dietary Condition, and Blood Glucose Level on Kinetics and Uptake of 18F-FDG in Mice
- Effort-Based Decision Making in the rat: An [18F]Fluorodeoxyglucose Micro Positron Emission Tomography Study