


Abstract
For the quantification of dynamic 18F-FDG PET studies, the arterial plasma time–activity concentration curve (APTAC) needs to be available. This can be obtained using serial sampling of arterial blood or an image-derived input function (IDIF). Arterial sampling is invasive and often not feasible in practice; IDIFs are biased because of partial-volume effects and cannot be used when no large arterial blood pool is in the field of view. We propose a mathematic function, consisting of an initial linear rising activity concentration followed by a triexponential decay, to describe the APTAC. This function was fitted to 80 oncologic patients and verified for 40 different oncologic patients by area-under-the-curve (AUC) comparison, Patlak glucose metabolic rate (MRglc) estimation, and therapy response monitoring (ΔMRglc). The proposed function was compared with the gold standard (serial arterial sampling) and the IDIF. Methods: To determine the free parameters of the function, plasma time–activity curves based on arterial samples in 80 patients were fitted after normalization for administered activity (AA) and initial distribution volume (iDV) of 18F-FDG. The medians of these free parameters were used for the model. In 40 other patients (20 baseline and 20 follow-up dynamic 18F-FDG PET scans), this model was validated. The population-based curve, individually calibrated by AA and iDV (APTACAA/iDV), by 1 late arterial sample (APTAC1sample), and by the individual IDIF (APTACIDIF), was compared with the gold standard of serial arterial sampling (APTACsampled) using the AUC. Additionally, these 3 methods of APTAC determination were evaluated with Patlak MRglc estimation and with ΔMRglc for therapy effects using serial sampling as the gold standard. Results: Excellent individual fits to the function were derived with significantly different decay constants (P < 0.001). Correlations between AUC from APTACAA/iDV, APTAC1sample, and APTACIDIF with the gold standard (APTACsampled) were 0.880, 0.994, and 0.856, respectively. For MRglc, these correlations were 0.963, 0.994, and 0.966, respectively. In response monitoring, these correlations were 0.947, 0.982, and 0.949, respectively. Additional scaling by 1 late arterial sample showed a significant improvement (P < 0.001). Conclusion: The fitted input function calibrated for AA and iDV performed similarly to IDIF. Performance improved significantly using 1 late arterial sample. The proposed model can be used when an IDIF is not available or when serial arterial sampling is not feasible.
- 18F-FDG
- positron emission tomography
- chemotherapy
- therapy monitoring
- input function
- theoretical models
- pharmacokinetics
- body fluid compartments
- least-squares analysis
- tissue distribution
Pharmacokinetic analysis of 18F-FDG by dynamic PET requires both the arterial plasma time–activity concentration curve (APTAC, or Cp(t) [input function]) and the tissue time–activity curve measured by PET (TTAC, or CT(t)) to be available to create a Patlak plot (1)  vs.
vs.  from which the glucose metabolic rate (MRglc) in the tissue of interest can be derived. Special interest in this type of quantitative analysis has risen for oncologic patients for prognostic stratification and response monitoring of disease.
The gold standard to obtain the APTAC is by measuring decay-corrected activity concentrations in plasma obtained by serial arterial sampling (2). This is an invasive and potentially harmful procedure for the patient and exposes the personnel to radiation. Complications attributed to radial artery cannulation include temporary occlusion (19.7%) and hematoma formation (14.4%), local infection (0.72%), sepsis (0.13%), permanent occlusion (0.09%), and pseudoaneurysm (0.09%) (3), some of which require medical intervention. Therefore, different methods have been developed to reduce these drawbacks. The major 4 alternatives to serial arterial sampling are (arterialized) venous blood sampling (4,5), image-derived input function (IDIF) estimation (6–12), population-based input function (13–17) modeling, and whole-blood input function extraction using sophisticated mathematic image segmentation methods (i.e., cluster analysis (18) and independent component analysis (19–21)).
A drawback of venous sampling is the time-dependent ratio of 18F-FDG in venous to arterial blood (a ratio of 0.61–0.88 at 5–50 min after injection) (4,5). Therefore, shunting of arterial blood to the venous system (the heated-hand procedure) is used to improve these ratios to 0.92–1.05 (4). This arterialized venous sampling technique still requires cannulation of an extra vein and exposes personnel to radiation.
IDIFs require a large blood pool (aorta, left ventricle) within the field of view of the PET image. IDIFs show systematic error, because activity concentration is measured in whole blood, and activity concentration is known to be lower in whole blood than in plasma (ratio, ∼0.925–0.95) (6–8). Moreover, partial-volume effects cause inaccuracy by spillover of activity from or to the surrounding tissues (e.g., myocardium) (6,9). Finally, additional noise is introduced because of the limited number of counts in the short early time frames. Because underestimation due to spill-out of the IDIF activity concentration leads to overestimation of MRglc and overestimation due to spill-in of surrounding IDIF activity concentration (in later time frames) leads to underestimation of MRglc (6,9), correction is necessary (10–12).
A population-based APTAC is based on the averaging of normalized sampled blood data of multiple patients. Several corrections were introduced, based on administered activity (AA), body weight, and blood transit time (13) or AA and body surface area (14,15). The latter provided a reliable estimation of MRglc but yielded less accurate parameter values in pharmacokinetic analysis. Another method is the fitting of the sampled data to an equation, assuming the 18F-FDG distribution in the vascular system as a compartment model on its own (16,17,22).
Here, we describe an APTAC model that is based on the fitting of a large series of arterially sampled oncologic patients to a mathematic equation (16,17,22). The model APTAC was calibrated to individual patients of a separate patient population by either an estimation of the distribution volume of 18F-FDG (14,15) or 1 late arterial blood sample and compared with the gold standard of arterial sampling and the IDIF. The performance of both models was assessed by comparison of the APTACs themselves and by their influence on Patlak MRglc and therapy response (ΔMRglc) evaluation.
MATERIALS AND METHODS
Patient Population, Arterial Sampling Procedure
Data of 120 dynamic 18F-FDG PET scans with serial arterial sampling data were reanalyzed. Scans were randomly distributed over 2 groups (Table 1): a parameter-identification group (n = 80) and a parameter-validation group (n = 40). For the latter group, both a pretreatment and a follow-up scan, after 2–3 courses of chemotherapy, were included. The details of 18F-FDG PET and arterial plasma data acquisition are described elsewhere (9), with the only difference being that they were reconstructed using ordered-subsets expectation maximization with 4 iterations and 16 subsets with a gaussian filter of 5 mm in all directions. In short, normoglycemic patients who had fasted were injected with 18F-FDG by an automated standardized infusion protocol. Directly thereafter, 17 arterial blood samples were taken at set time points from which plasma was obtained by centrifugation to provide a sampled arterial plasma time–activity concentration curve (APTACsampled). Simultaneously, dynamic PET, consisting of 16 time frames of variable length, was performed to provide both the tissue (TTAC) and the image-derived blood time–activity concentration curves (APTACIDIF).
Comparison Between Parameter-Identification and Parameter-Validation Groups, with Statistical Significance of Group Difference
Parameter-Identification Study (n = 80)
Normalization of the APTACsampled
The initial plasma concentration of 18F-FDG (Cp*(0) [MBq·L−1]) was used to normalize the APTACsampled. It was defined as the expected 18F-FDG concentration directly after tracer injection, assuming instant homogenization, and is dependent on the AA (MBq) and the (apparent) initial distribution volume (iDV, [L]) (14,15). To avoid confusion, an “*” is added, because the sampled activity concentration at t = 0 is 0 MBq·L−1.
In the period between 5 and 30 min after injection, the plasma and extravascular extracellular 18F-FDG pool of the whole body were assumed to be in equilibrium (23). Before this period, the tracer is being distributed over the body, and in the period thereafter, the tracer is mainly being metabolized and excreted. Within this interval, we sampled 4 times (7.5, 12.5, 17.5, and 25 min after injection) (9) to obtain Cp*(0); semilogarithmic recordings of these 4 points were linearly extrapolated back to t = 0 (y-intercept) (15,23).
Estimation of iDV by Body Weight and Height
By definition, the iDV represents the (virtual) volume of the plasma and extravascular extracellular 18F-FDG pool. The iDV can be estimated by (14,15): Eq. 1where H is patient height (m) and W is patient body weight (kg). Iteratively h, w, and c were derived for which the coefficient of variation of c (
 ) is smallest in the parameter-identification data.
Fitting of Normalized APTACsampled
The normalized APTACsampled can be approximated using the 3-compartment model for the blood pool as proposed by Feng et al. (16), simplified by Eberl et al. (17), as the following: Eq. 2where τ is the time to peak activity concentration. The normalized sampled plasma curves were fitted by linear curve fitting (t < τ) and by nonlinear least squares (t≥τ) to obtain the 8 free parameters in every patient of the parameter-identification study. Because chemotherapy might influence 18F-FDG distribution and clearance, the parameter values were compared between scans made in patients who did and did not receive chemotherapy.
Parameter-Validation Study (n = 40)
IDIF and Tumor Time–Activity Curves
The APTACIDIF was determined in manually placed volumes of interest (VOIs) over the ascending aorta (thoracic images) or descending aorta (abdominal images) known to correlate best with the gold standard (9) on summed images of the period 30–90 s after injection. The TTAC was obtained semiautomatically by placing volumes of interest in the summed images of the period 20–50 min after injection over the largest lesion, fully present in the field of view, using a threshold of 50% of its maximum voxel value. All images were analyzed using the Inveon Research Workplace (version 2.2; Siemens).
Comparison of Calibrated Plasma Time–Activity Curves and Glucose Metabolic Rates
Median values of APTAC parameters derived from the parameter-identification study were used for the population-based APTAC, which was calibrated to each individual patient, using 2 methods: by either multiplication by AA (MBq) divided by iDV (L) (estimated using Eq. 1, further mentioned as APTACAA/iDV) or multiplication by the plasma activity concentration of 1 late arterial sample (APTAC1sample).
The performance of the 3 curves (APTACAA/iDV, APTAC1sample, and APTACIDIF) was compared with that of the gold standard (APTACsampled) by their area under the curve (AUC), determined by trapezoid integration.
MRglc was determined using all 4 plasma input curves by Patlak graphical analysis (1). In the Patlak approximation, the lumped constant, accounting for the difference in glucose and 18F-FDG affinity, was set to 1 and the tumor blood fraction was set to 0. Therefore, the slope of the Patlak plot was Ki and the intercept was . MRglc can then be determined by multiplying the linear regression (5–50 min after injection) by the plasma glucose concentration.
Statistical Analysis
All variables were assessed for normality (Shapiro–Wilk, skewness, and kurtosis) and are either displayed as mean (±SD) or median (interquartile range). Comparison between 2 independent groups was performed by the t test, the Mann–Whitney U test, or the χ2 test. λ1–λ3 were compared using Friedman ANOVA. Correlations between the AUC, MRglc, and ΔMRglc of the different curves compared with the gold standard were assessed by Pearson r or Spearman ρ and linear regression and are displayed as Bland–Altman plots. Confidence intervals for correlation coefficients were compared after Fisher z transformation (24). Analysis was performed by SPSS 16.0.2 (SPSS Inc.). Two-sided significance was set at the 0.050 level.
RESULTS
Parameter-Identification Study
A median iDV of 12.7 L (corresponding to 0.1683 L/kg body weight) was calculated. Iterative determination of the function to estimate the iDV led to h = 1.257, w = 0.582, and c = 0.533 L·m−1.257·kg−0.582 (minimum CVc, 0.171; adjusted R2, 0.3181).
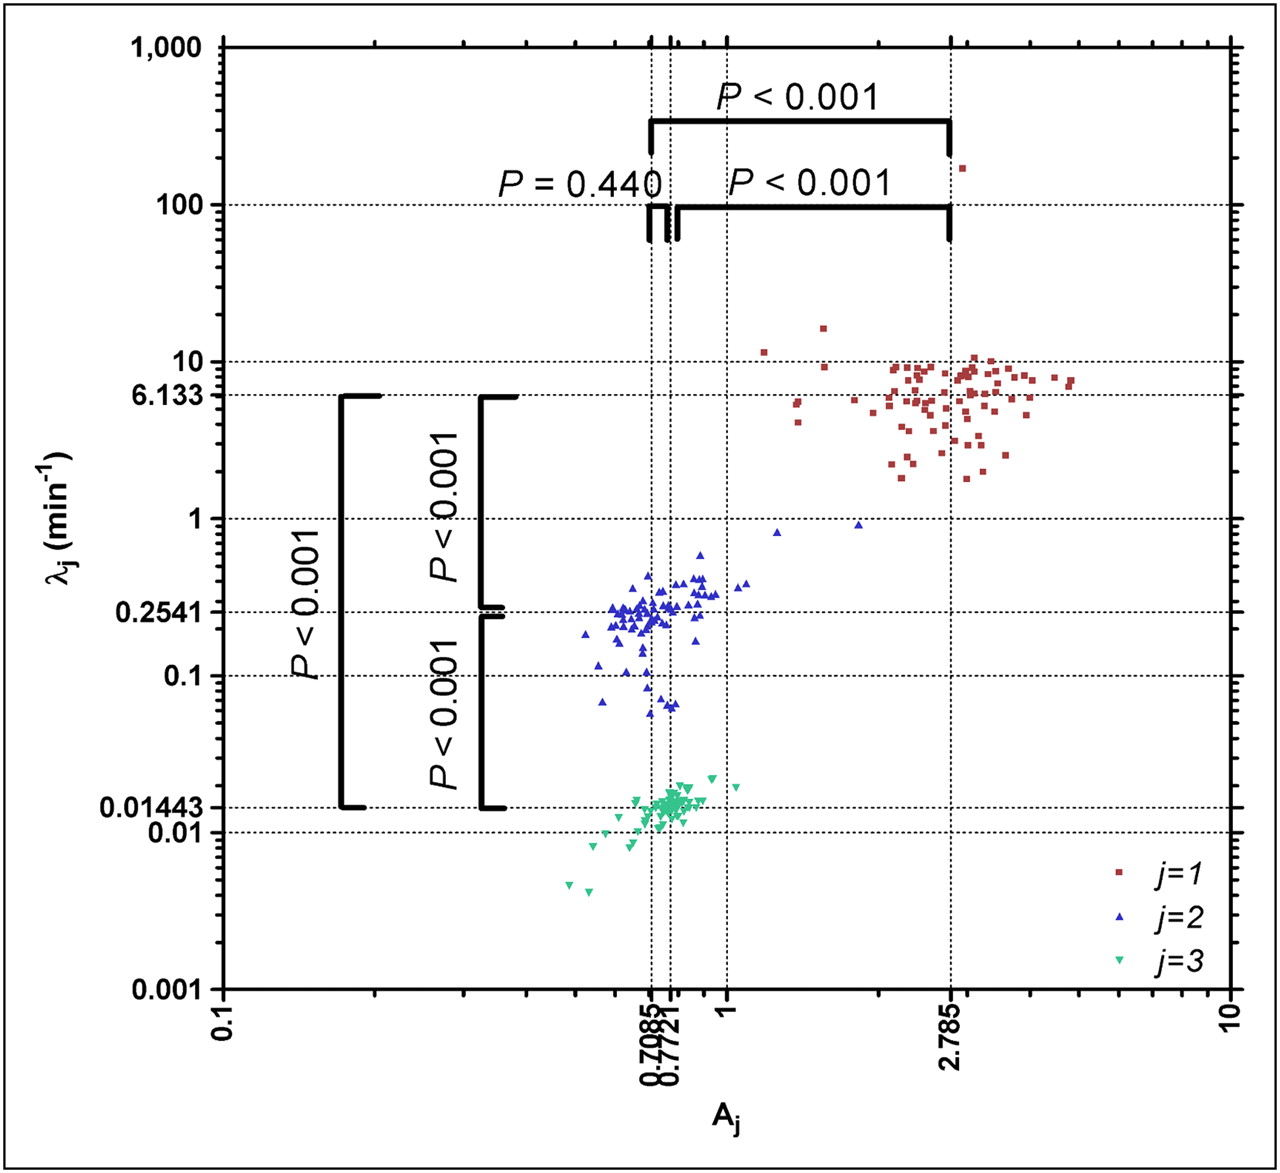
Fitting of the 80 APTACsampled by Equation 2 led to a minimum adjusted R2 of 0.8533; 80% of fits had an adjusted R2 greater than 0.9500. Resulting parameters for the normalized APTACsampled are provided in Table 2. No significant difference in 18F-FDG clearance could be detected (P > 0.326) between patients who did and did not receive chemotherapy. The 3 decay constants (λ1–λ3) were significantly different (P < 0.001; Fig. 1).

Scatter plot of log10 (Aj) vs. log10 (λj), showing clustering of 3 decay constants.
Results of Fitting of Normalized Plasma Data of Parameter-Identification Group and Subgroup Analysis Between Pretherapy Scans and Posttherapy Scans
Parameter-Validation Study
The correlation between the AUC of the APTACAA/iDV and the APTACsampled was 0.880. This correlation improved to 0.994 (P < 0.001) using 1 arterial sample for calibration. The mean AUC of APTACAA/iDV was similar to (462 ± 119 MBq·L−1·min), and that of APTAC1sample slightly lower than (468 ± 107 MBq·L−1·min), the gold standard (APTACsampled, 475 ± 108 MBq·L−1·min, P = 0.156 and P < 0.001, respectively). The APTACIDIF showed much lower AUCs than APTACsampled (392 ± 99 MBq·L−1·min, P < 0.001), with a correlation coefficient between these parameters of 0.856.
Comparison between MRglc is shown in Figure 2 (left panels). Adding 1 arterial sample (25 min after injection) improved the correlation between MRglc, determined by APTACAA/iDV and APTACsampled, from ρ = 0.963 to ρ = 0.994 (P < 0.001). MRglc determined by IDIF was significantly higher than the gold standard; the correlation was similar to that of APTACAA/iDV (ρ = 0.966).
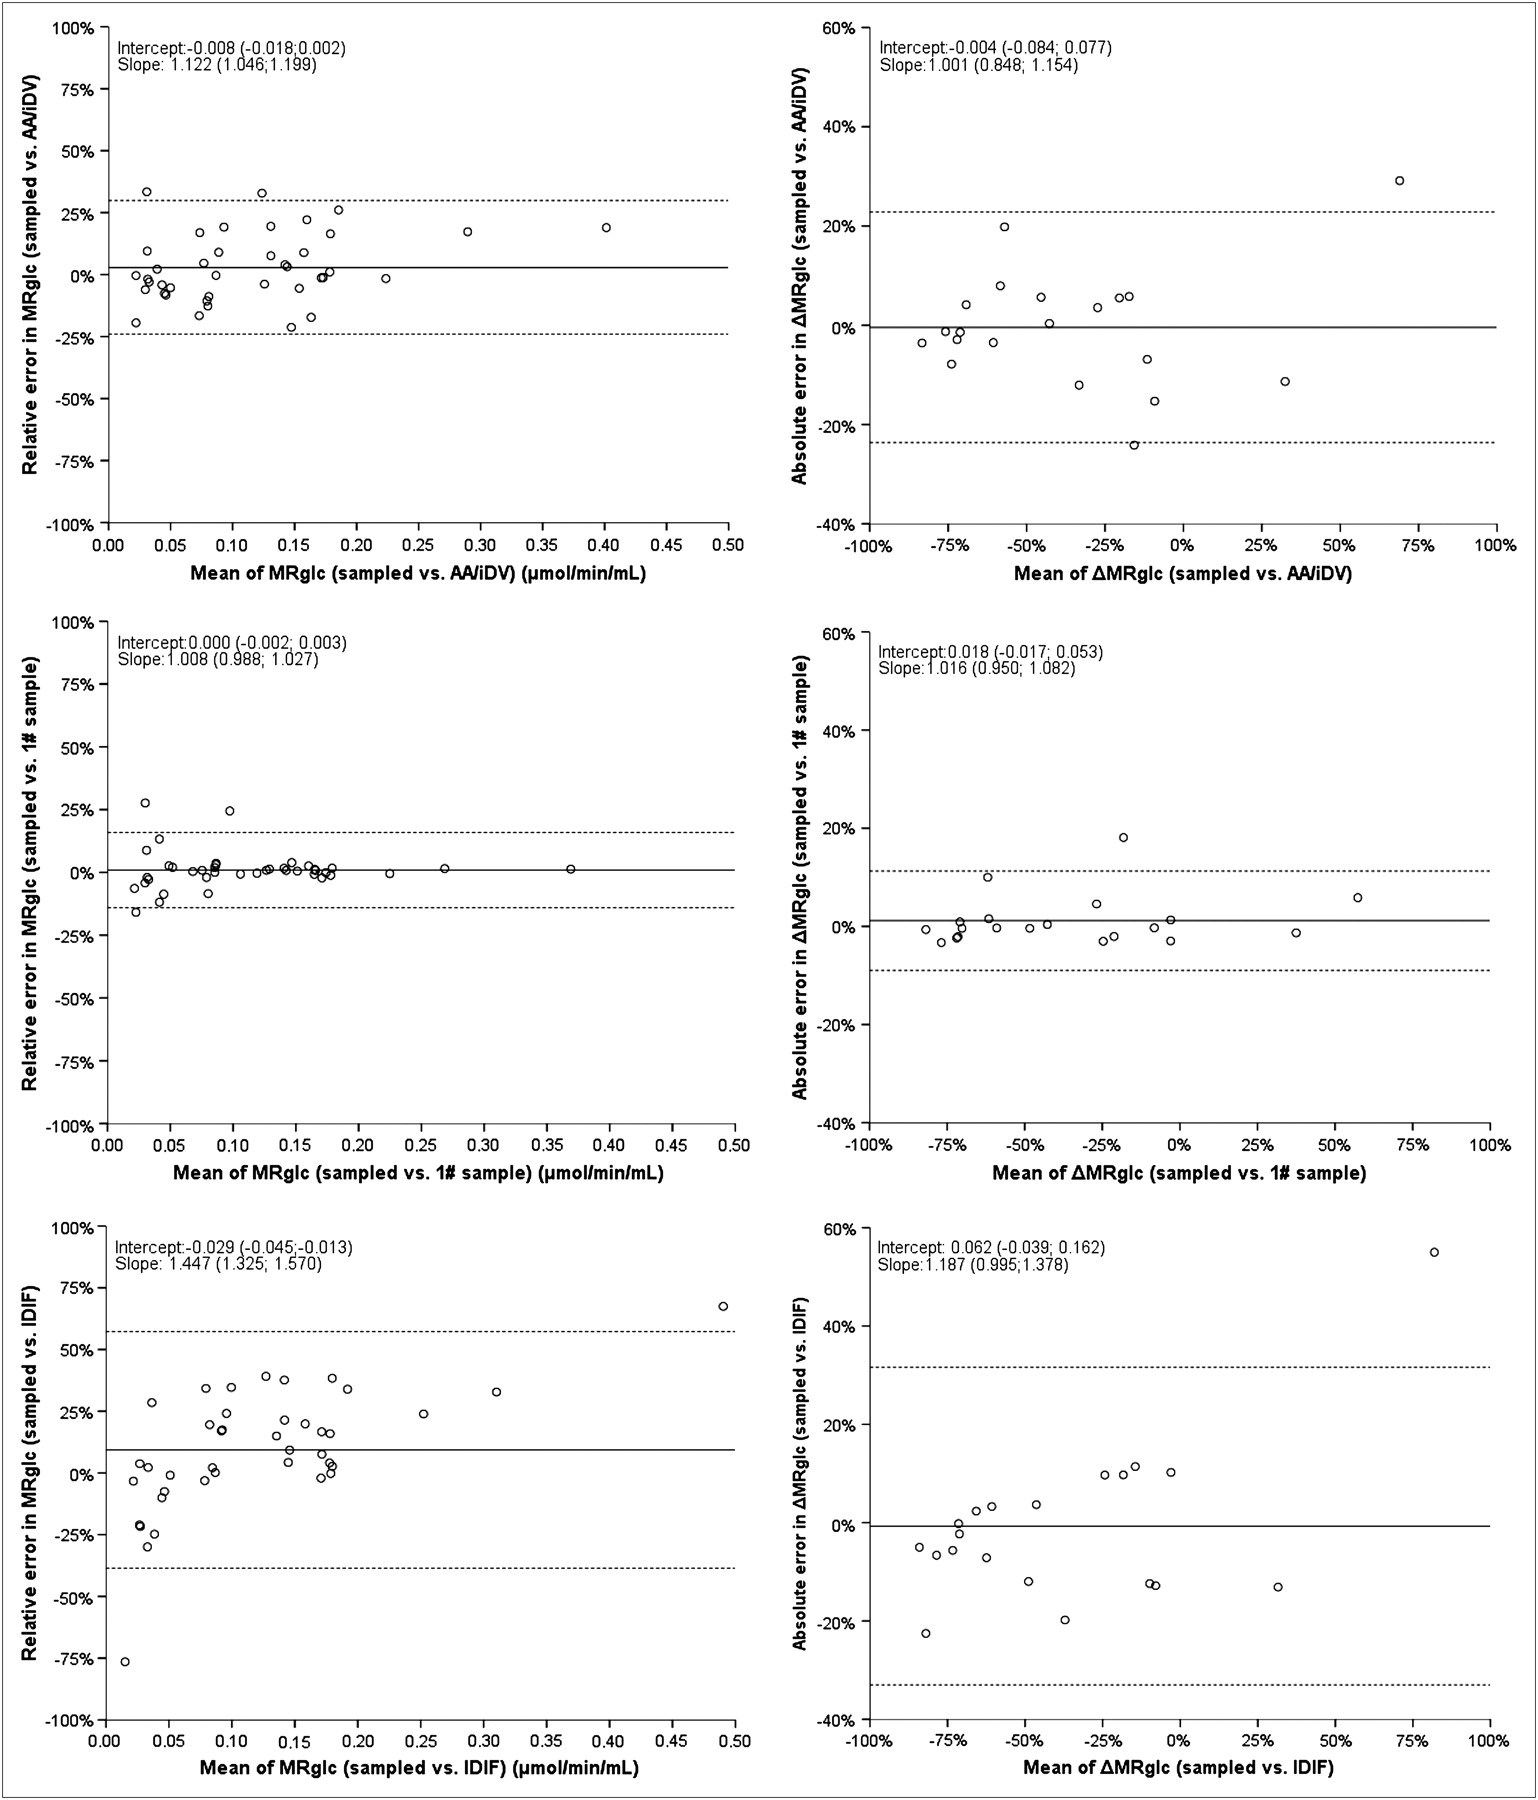
Bland–Altman plots of comparison between any of 3 evaluated APTACs and gold standard. In Bland–Altman plots, mean difference is displayed by solid line and 95% confidence interval by dotted lines. Unstandardized regression coefficients are displayed with corresponding 95% confidence interval. 1# sample was calibrated by 1 arterial sample at 25 min after injection; AA/iDV was calibrated by AA and iDV.
Comparison between therapy effects (ΔMRglc) is shown in Figure 2 (right panels). Adding 1 arterial sample (25 min after injection) improved the correlation between ΔMRglc determined by APTACAA/iDV and APTACsampled from ρ = 0.947 to ρ = 0.982 (P = 0.012). ΔMRglc determined by APTACIDIF had a correlation to the gold standard similar to that determined by APTACAA/iDV (ρ = 0.949).
Any arterial sample taken at 7.5 min after injection showed similar high correlations when comparing MRglc (ρ ≥ 0.9916) or ΔMRglc (ρ ≥ 0.9759) measured by APTACsampled and APTAC1sample.
DISCUSSION
This study describes the performance of a population-based APTAC based on fitting patient data to a mathematic equation on Patlak determination of MRglc and on chemotherapy response evaluation. Its accuracy is comparable to that of an IDIF, explaining 93% of variance in MRglc (90% in response evaluation by ΔMRglc), but the addition of 1 late arterial sample improves this to 99% (96% in response evaluation by ΔMRglc). Where the IDIF is fully individual, the proposed method is a population average, calibrated to individual patient parameters without the need for serial arterial sampling. The method can be used when scanning body regions where blood pools are unavailable, such as the extremities. The model can be further improved by including 1 arterial sample. It can be expected that a late arterialized venous sample might adequately replace the arterial sample, because more than approximately 30 min after 18F-FDG injection, activity concentrations of arterial and arterialized venous blood are highly similar (4,5). This sample might also be used to obtain an accurate measurement of the plasma glucose level, as long as radiation safety regulations do not prohibit this analysis in the clinical chemistry laboratory. As shown, MRglc was significantly overestimated using an IDIF, compared with the gold standard. Both the partial-volume effect and the fact that whole-blood activity concentrations are lower than in plasma cause underestimation of the (integral of the) APTAC. From the Patlak equation it can be derived that an underestimation of the APTAC and its integral cause overestimation of the MRglc. The quality of the IDIF can be improved by correction for the partial-volume and spillover effects (25). Moreover, the activity in whole blood can be corrected to the activity concentration in plasma using hematocrit (19) or modeled erythrocyte uptake (26). In addition, the noise in the short early time frames contributes to the inaccuracy of the activity concentration. Recently, 8 methods for the estimation of the carotid IDIF in human brain studies were compared with the reference input function (arterially sampled) with respect to cerebral MRglc and individual rate constants in a study consisting of phantoms and healthy volunteers. The authors concluded that blood-sample–free methods provided less reliable results than those obtained using the methods that require blood samples, even when limited to a single sample (27). Therefore, calibration of our IDIFs by 1 late venous sample would probably have improved the accuracy of these IDIFs. The advantage of a more patient-specific rather than a generic input function is especially important for pharmacokinetic analysis, because the exact shape of the APTAC in the artery feeding the tumor is vital and is usually different from a remote artery (because of delay and dispersion by the intraindividual variation in the impulse-response characteristics of the vascular system).
One method of calibration of the population-based curve was by the approach of Sadato et al. (23) (AA/iDV). They reported a mean iDV scaled to body weight (iDVBW) of 0.1627 L·kg−1, similar to this study (median iDVBW of 0.1683 L·kg−1). Around 50%−60% of the body weight of an average adult is water, of which 25%−45% (0.18 L·kg−1) is extracellular fluid (the volume of water in which 18F-FDG dissolves), stressing both the concordance and plausibility of this result (28). We used the function of Shiozaki et al. (15) to fit the iDV. They reported an iDV[mL] that equaled 39.0·H[cm]0.80·W[kg]0.35. This result appears different from the present study (iDV[L] = 0.533·H[m]1.257·W[kg]0.582), but they were only slightly off our optimum (CVc = 0.18 vs. CVc = 0.17). A dissimilar distribution of body habitus in their (Asian) population might be the cause for this difference.
As shown in Figure 2, the difference between MRglc calculated by APTAC1sample and APTACsampled was small; therefore, the net influx constant determined by Patlak analysis was accurate. For determining the individual rate constants, however, the inaccuracy will probably be much higher. For Patlak analysis, only the integral of the APTAC and the late (>5 min) activity concentrations of the arterial plasma are relevant, but for the accurate estimation of the individual rate constants of glucose pharmacokinetics, the exact shape of the APTAC is vital, because of both the function (including a convolution operation) and the method for parameter estimation (nonlinear least squares). The delay and dispersion between the APTAC in the artery feeding the tissue of interest and a remote artery are of major importance for the accurate determination of the fast rate constants (K1 and k2) and blood fraction (Vb). Moreover, the use of a generic input function for pharmacokinetic analysis should be considered because of the large intraindividual variation of the slow clearance rate constants of 18F-FDG (λ3 [and to a lesser extent in λ2] in Fig. 1 and Table 2). The assumption of a single clearance profile for all patients might therefore lead to the inaccurate estimation of the slower rate constants (k3 and, if it exists, k4) of individual patients.
The proposed model, therefore, should be evaluated further for estimating microparameters before implementation. This further evaluation, however, was out of the scope of this study.
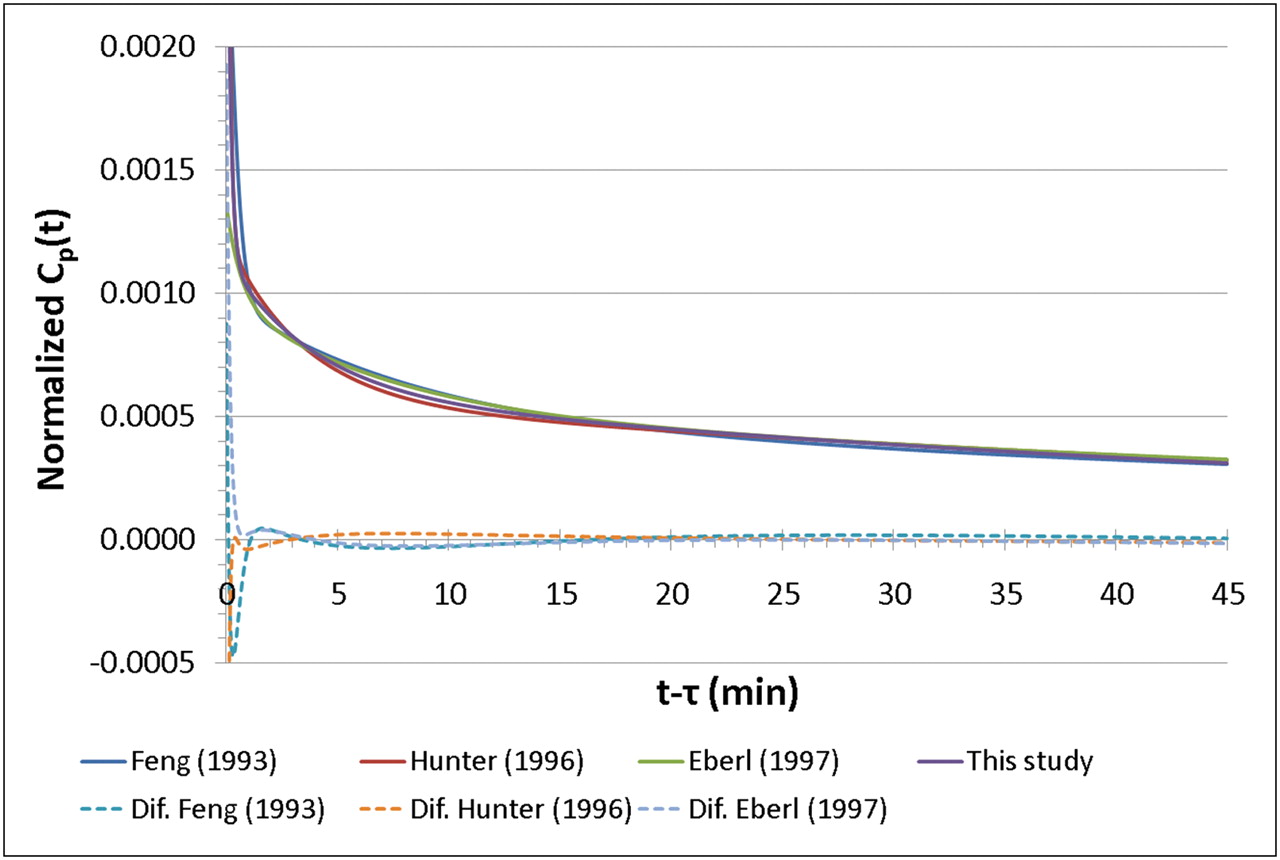
None of the previously published articles on population-based input curves used an IDIF for comparison, and most studies consisted of a small series of nononcologic patients, but reproducibility was high (Table 3). The studies that used triexponential clearance of 18F-FDG as a function for the APTAC (16,17,22) found a decay similar to that found in this study (Fig. 3). The results shown in Figure 1 suggest a high (linear) correlation between A3 and λ3. This correlation suggests that the model might be simplified by omitting 1 parameter; we did not verify the possibility of simplifying the model in this study.
Literature Review of Publications on Population-Based APTACs and IDIFs
CONCLUSION
The current model of the APTAC of 18F-FDG, calibrated by 1 late arterial sample, shows high accuracy for Patlak MRglc calculation and treatment response monitoring. The model allows dynamic scanning of areas without large vessels in the field of view, such as the extremities; is less invasive; and causes less radiation exposure to personnel than does arterial sampling. Even without a calibrating sample available, this model has the same accuracy as an IDIF, without its inherent disadvantages.
Footnotes
-
COPYRIGHT © 2009 by the Society of Nuclear Medicine, Inc.
References
- Received for publication April 18, 2009.
- Accepted for publication August 28, 2009.


Jump to section
Related Articles
Cited By...
- Simultaneous quantification of oxygen and glucose consumption during visual stimulation in the human cortex
- An energy costly architecture of neuromodulators for human brain evolution and cognition
- Total-Body 18F-FDG PET/CT in Autoimmune Inflammatory Arthritis at Ultra-Low Dose: Initial Observations
- Kinetic Modeling of 18F-(2S,4R)4-Fluoroglutamine in Mouse Models of Breast Cancer to Estimate Glutamine Pool Size as an Indicator of Tumor Glutamine Metabolism
- Spectral Clustering Predicts Tumor Tissue Heterogeneity Using Dynamic 18F-FDG PET: A Complement to the Standard Compartmental Modeling Approach
- Quantitative Positron Emission Tomography Imaging for Response Assessment of [18F]Fluorodeoxyglucose-Avid Lymphomas: Should We Report Standard Uptake Value Confidence Limits?
- 18F-Alfatide II and 18F-FDG Dual-Tracer Dynamic PET for Parametric, Early Prediction of Tumor Response to Therapy
- Is Liver SUV Stable over Time in 18F-FDG PET Imaging?