


Abstract
A single dynamic PET acquisition using multiple tracers administered closely in time could provide valuable complementary information about a tumor’s status under quasiconstant conditions. This study aimed to investigate the utility of dual-tracer dynamic PET imaging with 18F-alfatide II (18F-AlF-NOTA-E[PEG4-c(RGDfk)]2) and 18F-FDG for parametric monitoring of tumor responses to therapy. Methods: We administered doxorubicin to one group of athymic nude mice with U87MG tumors and paclitaxel protein-bound particles to another group of mice with MDA-MB-435 tumors. To monitor therapeutic responses, we performed dual-tracer dynamic imaging, in sessions that lasted 90 min, starting with injection via the tail vein catheters with 18F-alfatide II, followed 40 min later by 18F-FDG. To achieve signal separation of the 2 tracers, we fit a 3-compartment reversible model to the time–activity curve of 18F-alfatide II for the 40 min before 18F-FDG injection and then extrapolated to 90 min. The 18F-FDG tumor time–activity curve was isolated from the 90-min dual-tracer tumor time–activity curve by subtracting the fitted 18F-alfatide II tumor time–activity curve. With separated tumor time–activity curves, the 18F-alfatide II binding potential (Bp = k3/k4) and volume of distribution (VD) and 18F-FDG influx rate ((K1 × k3)/(k2 + k3)) based on the Patlak method were calculated to validate the signal recovery in a comparison with 60-min single-tracer imaging and to monitor therapeutic response. Results: The transport and binding rate parameters K1–k3 of 18F-alfatide II, calculated from the first 40 min of the dual-tracer dynamic scan, as well as Bp and VD correlated well with the parameters from the 60-min single-tracer scan (R2 > 0.95). Compared with the results of single-tracer PET imaging, 18F-FDG tumor uptake and influx were recovered well from dual-tracer imaging. On doxorubicin treatment, whereas no significant changes in static tracer uptake values of 18F-alfatide II or 18F-FDG were observed, both 18F-alfatide II Bp and 18F-FDG influx from kinetic analysis in tumors showed significant decreases. For therapy of MDA-MB-435 tumors with paclitaxel protein-bound particles, a significant decrease was observed only with 18F-alfatide II Bp value from kinetic analysis but not 18F-FDG influx. Conclusion: The parameters fitted with compartmental modeling from the dual-tracer dynamic imaging are consistent with those from single-tracer imaging, substantiating the feasibility of this methodology. Even though no significant differences in tumor size were found until 5 d after doxorubicin treatment started, at day 3 there were already substantial differences in 18F-alfatide II Bp and 18F-FDG influx rate. Dual-tracer imaging can measure 18F-alfatide II Bp value and 18F-FDG influx simultaneously to evaluate tumor angiogenesis and metabolism. Such changes are known to precede anatomic changes, and thus parametric imaging may offer the promise of early prediction of therapy response.
PET is arguably the most sensitive and specific technique for imaging molecular pathways in vivo in humans. Moreover, the availability of tracers sensitive to different physiologic and pharmacologic variables enables PET to characterize multiple aspects of oncologic pathology, including metabolism, angiogenesis, cellular proliferation, blood flow, and hypoxia (1,2). Given the complexity and heterogeneity of malignant lesions, such complementary information can facilitate comprehensive evaluation of tumors and improve early detection, staging, and monitoring of therapeutic responses (3–7).
For example, Tseng et al. (5) concurrently measured blood flow with 15O-water and glucose metabolism with 18F-FDG in locally advanced breast cancer and reported that a low ratio of glucose metabolism to blood flow predicted a favorable therapeutic response. In our previous studies, we used 18F-FPPRGD2 (2-fluoropropionyl–labeled PEGylated dimeric RGD [Arg-Gly-Asp] peptide [PEG3-E{c(RGDyk)}2]), a peptide that quantifies integrin αvβ3 expression, and 18F-FDG to evaluate tumor angiogenesis and metabolism modulations in response to the VEGFRTK (vascular endothelial growth factor receptor tyrosine kinase) inhibitor ZD4190 (7), to Abraxane (Celgene Corp.) (6), and to the vascular disruptive fusion protein VEGF121/rGel (8). Longitudinal imaging results indicated that even though much higher tumor uptake was found in 18F-FDG imaging, therapeutic effect was more clearly reflected by 18F-FPPRGD2 imaging. However, the multiple-step synthetic procedure required to prepare 18F-FPPRGD2 with relatively low yield may limit its widespread use (9). Consequently, a novel dimeric RGD peptide tracer has been prepared with the reaction of 18F-aluminum fluoride complex to preattached chelator on RGD peptides (10). Without the need of high-performance liquid chromatography purification, the ease of preparation and high imaging qualities make 18F-AlF-NOTA-PRGD2 (alfatide I) a promising alternative to 18F-FPPRGD2 for PET imaging of αvβ3 integrin expression (10–12).
By taking advantage of the distinct kinetics of different tracers, nearly simultaneous multitracer imaging can be achieved by closely staggering tracer injections during a single scan (13–17). Many studies using simulated data have demonstrated the feasibility of signal separation with dual-tracer dynamic PET imaging (13–17). PET imaging with different tracers that partially overlap in time has advantages, relative to PET imaging with widely separated administration of the tracers, by reducing the cost and time of the imaging and by providing complementary information under quasiconstant physiologic conditions (14,18). Dynamic parameters for each tracer may provide more sensitive quantification in tumor therapy monitoring than static tumor uptake values (19). In addition, the radiation dose is reduced in multitracer single-scan imaging, because only 1 CT scan is needed for attenuation correction or coregistration of images for the tracers.
Dynamic PET imaging using 18F-FDG, followed by irreversible compartmental modeling, has been intensively studied (5). Our previous studies showed that the kinetics of RGD-based peptide tracer satisfies the reversible 3-compartment model (19). In this study, we conducted dynamic imaging with the dual tracers 18F-AlF-NOTA-E[PEG4-c(RGDfk)]2 (denoted as 18F-alfatide II) (20) and 18F-FDG in xenograft tumor models to monitor tumor therapy response to either doxorubicin or Abraxane. 18F-alfatide II and 18F-FDG tumor time–activity curves were separated using compartmental modeling. To validate the signal recovery, the dynamic parameters calculated from dual-tracer time–activity curves were compared with those from single-tracer imaging. Then the tumor response to drug treatment was assessed on the basis of tumor uptake, 18F-alfatide II binding potential (Bp), and 18F-FDG influx rate (5,6).
MATERIALS AND METHODS
Preparation of Imaging Tracers
The PEG4-E[c(RGDfK)2] was synthesized by C S Bio. The NOTA-NHS ester was obtained from CheMatech. The coupling of NOTA-NHS ester to the amine of RGD peptide was performed using dimethylformamide as the solvent and N,N-diisopropylethylamine as the base. The purity of NOTA-PEG4-E[c(RGDfK)2] was greater than 97% by analytic high-performance liquid chromatography (Rt = 14.2 min) running a linear gradient starting from 5% A (0.1% TFA [trifluoroacetic acid] in acetonitrile) and 95% B (0.1% TFA in water) for 5 min and increasing to 65% A at 35 min with a flow rate of 1 mL/min. The reaction yield was 69%. Liquid chromatography mass spectrometry: [MH]+ = 1,850.7869 (m/z), calc: 1,849.9322 (C82H127N23O26).
The 18F-fluoride in O-18 water was obtained from the National Institutes of Health cyclotron facility. The radiolabeling of NOTA-PEG4-E[c(RGDfK)2] with 18F-aluminum fluoride was performed according to a previously published procedure with some modifications (21). The total synthesis time was about 30 min, with a radiochemical yield of 40%–60% and radiochemical purity greater than 95%. The specific activity was about 14.8–37 GBq/μmol at the end of synthesis based on the amount of peptide used and the amount of radioactivity trapped on the C-18 column. The final product was named 18F-alfatide II (18F-AlF-NOTA-E[PEG4-c(RGDfk)]2). 18F-FDG was purchased from the Nuclear Pharmacy of Cardinal Health and was diluted, as appropriate, with sterile saline.
Tumor Model and Treatment Protocol
All animal studies were conducted in accordance with the principles and procedures outlined in the Guide for the Care and Use of Laboratory Animals (22) and were approved by the Institutional Animal Care and Use Committee of the Clinical Center, National Institutes of Health. The U87MG cells expressing high levesl of αvβ3 integrin (23) and the MDA-MB-435 cells with medium levels of αvβ3 integrin expression were purchased from the American Type Culture Collection and cultured in minimum essential medium and Leibovitz L-15 medium supplemented with 10% fetal bovine serum in a humidified atmosphere of 5% CO2 at 37°C, respectively. The tumor models were established by inoculating the right shoulder of 5- to 6-wk-old female athymic nude mice (Harlan Laboratories) subcutaneously with 1 × 10⁷ U87MG cells or 6 × 10⁶ MDA-MB-435 cells in 100 μL of phosphate-buffered saline. The mice underwent PET scans when the tumor volume reached 200–400 mm3 (∼3–4 wk after inoculation). For the therapy-monitoring study, U87MG tumor–bearing mice in the treated group were given 2 doses of doxorubicin (5 mg/kg/dose) 2 d apart via tail vein injection, whereas the MDA-MB-435 tumor–bearing mice were given 2 doses of Abraxane (30 mg/kg/dose) every other day via tail vein injection. All the mice in the control group were injected with the same volume of saline. The detailed therapy and imaging regimen are shown in Table 1. Tumor growth was monitored by measuring tumor size with a caliper every 2 d after the tumors became palpable. The tumor volume was calculated with the formula a × (b2)/2, where a and b were the tumor length and width, respectively, in millimeters.
Schematics of Imaging and Therapy Regimen
Dynamic PET Imaging
All the PET scans were conducted with an Inveon small-animal PET scanner (Siemens Preclinical Solution). Mice were anesthetized with mixtures of O2 (1 mL/min) and 1.5% isoflurane and kept warm with a heating pad thermostat during the imaging. All data acquisitions were initiated immediately before the tracer injections. The duration of a scan was 60 min for single-tracer imaging and 90 min for 18F-alfatide II/18F-FDG dual-tracer imaging. A catheter was placed in the tail vein before each scan for tracer administration. For dual-tracer imaging, about 3.7 MBq of 18F-alfatide II was injected through the catheter immediately after the scan was started. Forty minutes later, about 3.7 MBq of 18F-FDG was injected without stopping the scanning. For therapy response monitoring, mice in both control and treated groups underwent dual-tracer dynamic imaging on days 0 and 3. The acquired list-mode data were reconstructed with 3-dimensional ordered-subset expectation maximization, followed by the maximum a posteriori probability algorithm (11). The reconstruction frames were 1 × 5, 1 × 25, 9 × 30, 5 × 60, 5 × 120, and 10 × 240 s for single-tracer dynamic imaging and 1 × 5, 1 × 25, 9 × 30, 10 × 60, 4 × 300, 1 × 240, 12 × 30, 10 × 60, and 7 × 300 s for dual-tracer dynamic imaging.
Region-of-Interest Quantification and Time–Activity Curves
The ROIs were drawn over the tumor region with Inveon Research Workplace 3.0 software (Siemens Preclinical Solution), using a procedure reported in our previous study (11). For dual-tracer dynamic imaging, the time–activity curves were generated on the basis of mean pixel intensity of the whole ROI in each frame before the signal separation. A calibration constant was used to convert the mean pixel intensity to MBq/mL for separated time–activity curves. Because the tissue density was assumed to be 1 g/mL, the activity in the ROI was normalized by injected dose and expressed as percentage injected dose per gram (%ID/g) to describe the tissue uptake of the radiotracers. The injected dose for the second tracer, 18F-FDG, was decay-corrected to the starting time of the scanning to reflect the real tumor uptake. The tumor uptake of 18F-alfatide II in static image quantification was calculated from the last frame before 18F-FDG injection. 18F-FDG uptake was calculated at the 50-min time point on the restored 18F-FDG time–activity curves.
The arterial input function was drawn on the abdominal aorta (24) on the second frame of PET dynamic image serials. The first frame was left empty purposely to ensure the peak concentration could be captured.
Dual-Tracer Input Function and Tumor Time–Activity Curve Separation
The 18F-alfatide II input function was fitted with a triexponential model (25) for the first 40 min of data. The mathematic expression for the model is shown in Equation 1 Eq. 1 where Cp represents the tracer concentration in plasma. A1, A2, and A3 are coefficients of the model, and
  ,
,  , and
, and  are the Eigen values of the model.
  is the injection delay time.
For tumor time–activity curve separation, a 3-compartment reversible model was used to fit the initial 40 min of 18F-alfatide II data. The dynamic rate constants K1–k4 were determined by fitting the following function for tumor time–activity curve. Eq. 2
Eq. 2 Eq. 3
Eq. 3 Eq. 4
Eq. 4
Here Ct is the tracer concentration in tumor ROI, and Vb is the fractional blood volume.
Similarly, K1–k4 were then imported back into the Equations 2–4 to extrapolate the 18F-alfatide II time–activity curve to 90 min. Subsequently, the 18F-FDG tumor time–activity curve was restored by subtracting the fitted 90-min 18F-alfatide II time–activity curve from the overlapping time–activity curve in the dual-tracer imaging.
The fitting method for the input function and the tumor time–activity curves, alike, was unweighted least-squares nonlinear regression. The correlation coefficient R2, defined as the ratio of regression sum of squares and the total sum of squares, was calculated to evaluate the goodness of fit (26).
Kinetic Data Analysis
The combination (k3/k4) and volume of distribution (VD = (K1/k2) × (1 + k3/k4)) were calculated, in addition to K1–k4, for 18F-alfatide II. Bp is associated with the binding affinity, and VD reflects the tissue-to-plasma concentration ratio. The Patlak method was performed to calculate the influx rate constant for 18F-FDG, a well-known irreversible tracer. The influx rate is related to the metabolic rate of glucose (27).
Logan graphical analysis (19) was used in the therapeutic monitoring study to calculate a voxelwise parametric map of 18F-alfatide II Bp values with data from the dynamic whole-body images obtained during the first 40 min of the study (i.e., before injection of 18F-FDG).
Statistics
Linear regression was used to compare the results from single-tracer and dual-tracer imaging and evaluated by ANOVA F test to validate the significance of regression, with a P value of less than 0.05 indicating significant linearity. For therapeutic monitoring, quantitative data were expressed as mean ± SD. Means were compared using the Student t test. A P value of less than 0.05 was considered statistically significant.
RESULTS
Time–Activity Curves and Dual-Tracer Time–Activity Curve Separation
After dynamic acquisition and imaging reconstruction, ROIs were drawn over the abdominal aorta and tumor region to generate the corresponding dual-tracer time–activity curves (Supplemental Fig. 1; supplemental materials are available at http://jnm.snmjournals.org). To evaluate the robustness of the nonlinear regression, a regression coefficient of each animal was calculated and listed in Table 2. R2 ranged from 0.92 to 1.0, indicating a good fit for all.
Nonlinear Regression Coefficient of Input Function and Tumor Time–Activity Curve for Each Mouse
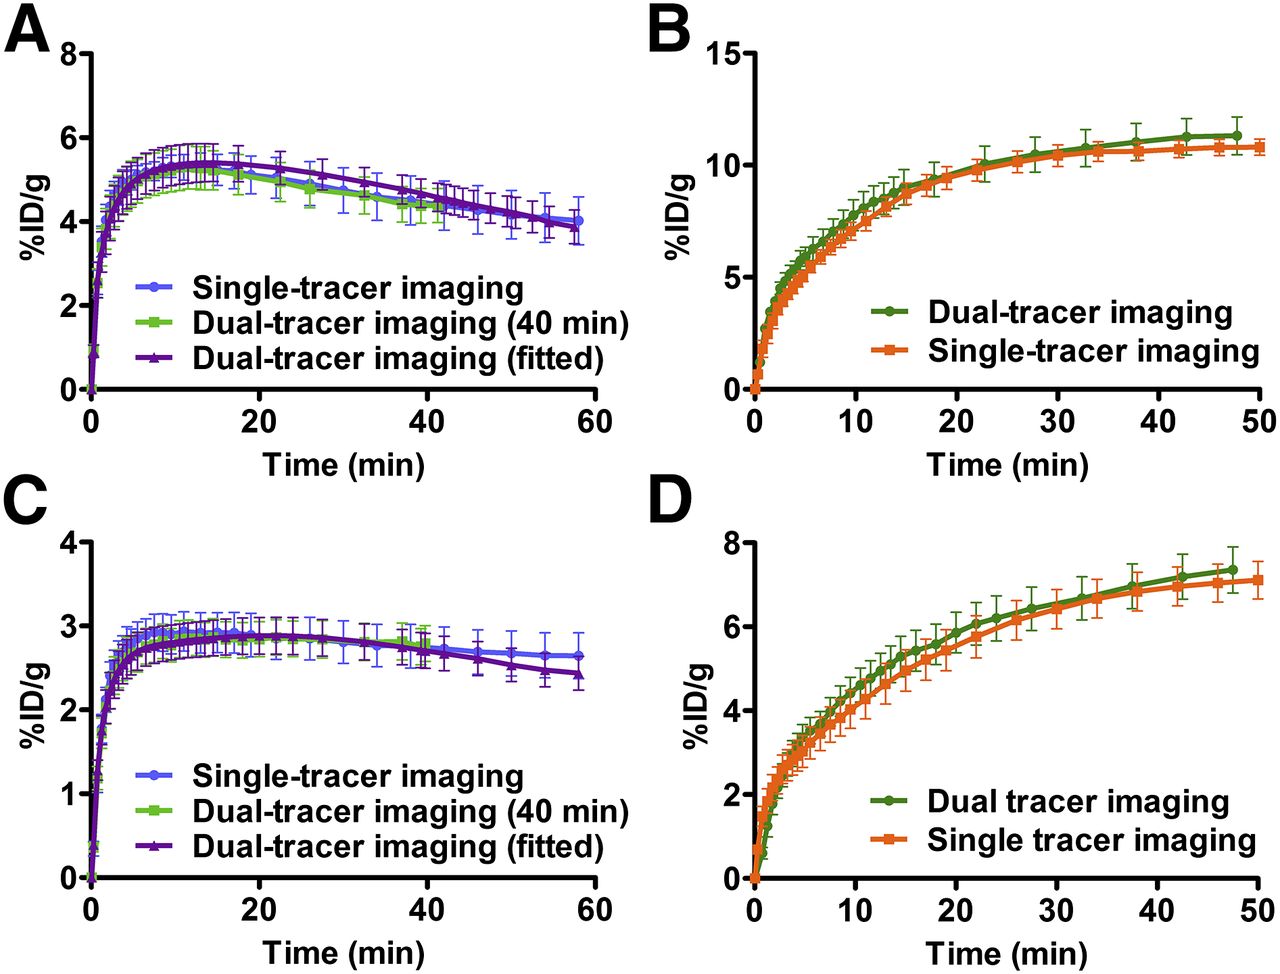
Average U87MG tumor uptake time–activity curves were calculated and are shown in Figure 1A for 18F-alfatide II and Figure 1B for 18F-FDG. In the dual-tracer imaging study, the tumor uptake of 18F-alfatide II was 4.65 ± 1.02 %ID/g at 40 min, and the uptake of 18F-FDG was 11.31 ± 1.61 %ID/g at 50 min. In the single-tracer imaging study, the tumor uptake of 18F-alfatide II was 4.38 ± 1.43 %ID/g at 40 min, and the uptake of 18F-FDG was 10.81 ± 0.81 %ID/g at 50 min. There is no significant difference between the values calculated from the single-tracer imaging and dual-tracer imaging. Similarly, the average MDA-MB-435 tumor uptake time–activity curves from the dual-tracer imaging fitted well with those from the single-tracer imaging (Figs. 1C and 1D). The MDA-MB-435 tumor uptake values of 18F-FDG and 18F-alfatide II from the dual-tracer imaging were 7.19 ± 1.31 and 2.79 ± 0.47 %ID/g, respectively, and showed no significant difference with those from the single-tracer imaging (6.96 ± 1.13 and 2.73 ± 0.64 %ID/g, respectively).

(A and B) Averaged U87MG tumor uptake time–activity curves for 18F-alfatide II (A) and for 18F-FDG (B) recovered time–activity curves in dual- and single-tracer imaging. (C and D) Averaged MDA-MB-435 tumor uptake time–activity curves for 18F-alfatide II (C) and for 18F-FDG (D) recovered time–activity curves in dual- and single-tracer imaging. Tumor uptake was normalized by injection dose and expressed as %ID/g (mean ± SEM).
Kinetic Parameters Evaluation
18F-alfatide II kinetic parameters, such as K1, k2, and k3, calculated from the 40- and 60-min dynamic scans showed excellent linear correlation (R2 > 0.98), whereas k4 showed modest (but still statistically significant, P < 0.05) correlation (R2 = 0.76) (Supplemental Fig. 2). Excellent linear correlations were also found for VD (R2 = 0.95) and Bp (R2 = 0.98), indicating that VD and Bp derived from the 40-min scan were consistent with the ones derived from the 60-min scan (Figs. 2A and 2B).

(A and B) Correlation between dynamic parameters VD and Bp calculated from 60- and 40-min 18F-alfatide II time–activity curves. (C and D) Correlation of 18F-FDG tumor influx rate (C) and tumor uptake (D) between single- and dual-tracer imaging. Linear regression equation, Pearson correlation coefficient R2, and P value of linear regression F test are shown.
Kinetic parameter comparisons for 18F-FDG between single- and dual-tracer imaging are shown in Figures 2C and 2D. The correlation coefficients, R2, for tumor influx and uptake between single-tracer and dual-tracer imaging were 0.70 and 0.79, respectively. A significant linear correlation was also observed between these parameters (P < 0.05), confirming the feasibility of the signal separation and parameter calculations.
Evaluation of Tumor Response to Doxorubicin and Abraxane
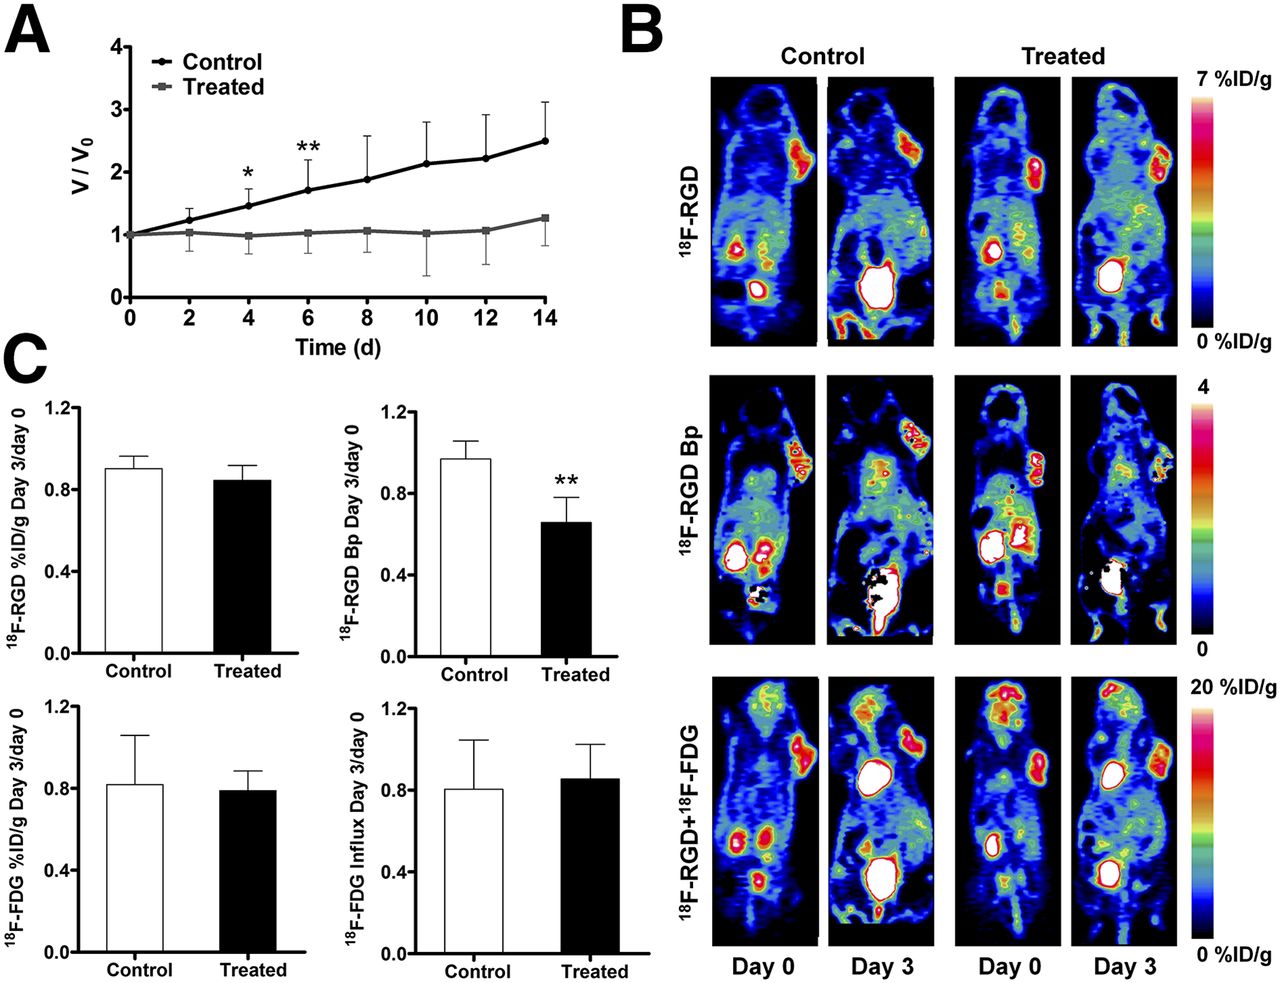
After being treated with 2 doses of doxorubicin, the U87MG tumors showed a partial response, reflected by significant growth inhibition at day 5 after the treatment started (P < 0.05, Fig. 3A). Tumors in representative static images at 40- and 90-min time points clearly had heterogeneous tracer distribution within the tumor region in both control and treated groups. The parametric maps of 18F-alfatide II Bp values were also calculated and are shown in Figure 3B.

(A) Relative tumor growth curves of U87MG xenografts. Doxorubicin treatment was performed on days 0 and 2. Imaging was conducted on days 0 and 3. (B) Representative static PET coronal images for 18F-alfatide II at 40 min (top), parametric maps of 18F-alfatide II Bp (middle), and overlapped 18F-alfatide II and 18F-FDG (bottom). (C) Day-3 to day-0 ratios of static tumor uptake and dynamic parameters from 18F-alfatide II/18F-FDG dual-tracer dynamic PET imaging. 18F-alfatide II tumor uptake was quantified at 40 min after injection, and 18F-FDG tumor uptake was recovered from time–activity curve at 50 min after injection of 18F-FDG. Paired Student t test was used to evaluate differences. *P < 0.05. **P < 0.01.
Through specific binding to integrin αvβ3, 18F-alfatide II was used to evaluate tumor angiogenesis. In untreated tumors, tumor uptake at 40 min after injection showed a slight increase, with a day-3 to day-0 ratio of 1.18 ± 0.36. On treatment, the tumor uptake of 18F-alfatide II decreased, with a day-3 to day-0 ratio of 0.86 ± 0.15. However, the static tumor uptake ratio showed no significant difference between the control and treated groups at 40 min after injection (P > 0.05). The Bp value increased substantially from day 0 to day 3 in the control group, but decreased dramatically in the treated group. Consequently, the day-3 to day-0 Bp ratio of the control group (1.64 ± 0.02) was significantly higher than that of the treated group (0.53 ± 0.14, P < 0.01) (Fig. 3C).
The tumor uptake of 18F-FDG on day 3 decreased slightly over day 0 in both the control and the treated groups (Fig. 3C) and to a greater extent in the treated group. Specifically, the day-3 to day-0 ratio of 18F-FDG tumor uptake was 0.95 ± 0.17 for the control group and 0.80 ± 0.16 for the treated group. However, the difference was not statistically significant (P > 0.05). The 18F-FDG influx rate decreased in both the control and the treated groups at day 3 (Fig. 3C). The day-3 to day-0 ratio of influx rate was 0.79 ± 0.03 for the control group, which was significantly different from that for the treated group (0.54 ± 0.14, P < 0.05).
Treatment with Abraxane also induced a partial response on MDA-MB-435 tumors, reflected by significant growth inhibition at day 4 after the treatment started (P < 0.05, Fig. 4A). As shown in Figure 4B, both treated and control tumors showed positive uptake of 18F-alfatide II and 18F-FDG. Similar to doxorubicin-treated U87MG tumors, the static tumor uptake ratio of both 18F-alfatide II and 18F-FDG showed no significant difference between the control and treated groups (P > 0.05) (Fig. 4C). The day-3 to day-0 ratio of 18F-FDG influx rate was 0.85 ± 0.17 for the control group, which was not significantly different from that for the treated group (0.80 ± 0.24, P > 0.05). The day-3 to day-0 Bp ratio of the treated group (0.66 ± 0.12) is significantly lower than that of the control group (0.97 ± 0.09, P < 0.01) (Fig. 4C).

(A) Relative tumor growth curves of MDA-MB-435 xenografts. Abraxane treatment was performed on days 0 and 2. Imaging was conducted on days 0 and 3. (B) Representative static PET coronal images for 18F-alfatide II at 40 min (top), parametric maps of 18F-alfatide II Bp (middle), and overlapped 18F-alfatide II and 18F-FDG (bottom). (C) Day-3 to day-0 ratios of static tumor uptake and dynamic parameters from 18F-alfatide II/18F-FDG dual-tracer dynamic PET imaging. 18F-alfatide II tumor uptake was quantified at 40 min after injection, and 18F-FDG tumor uptake was recovered from time–activity curve at 50 min after injection of 18F-FDG. Paired Student t test was used to evaluate differences. *P < 0.05. **P < 0.01.
DISCUSSION
PET imaging using multiple tracers is expected to provide more complementary information than a single PET study using a single tracer and thus might improve tumor diagnosis and therapeutic monitoring. Multiple, separate single-tracer studies to achieve this would be more costly and require longer total scan times, and—because of the delay between scans—wouldn’t provide information under quasiconsistent physiologic conditions.
The fixed-energy γ ray of positron emitters from the positron-electron annihilation, however, presents significant challenges for imaging multiple tracers simultaneously with 1 PET scan. Since the 1980s, several methods have been developed to separate the superimposed PET signals of multiple-tracer scans (16,28). For example, Koeppe et al. (16) performed computer simulations and human PET studies using pairs of 11C-labeled tracers in a single scan to image different neurotransmitter–neuroreceptor systems and demonstrated the feasibility of parameter estimation with compartmental modeling. Rust et al. (17) demonstrated the influence of injection timing, injection order, and relative dose on signal separation based on simulated time–activity curves after staggered injection of 62Cu-pyruvaldehyde-bis[N4-methylthiosemicarbazone] (PTSM) and 62Cu-diacetyl-bis[N4-methylthiosemicarbazone] (ATSM). Short half-life (t1/2) isotopes, such as 11C (t1/2 = 20.4 min), 13N (t1/2 = 9.97 min), and 62Cu (t1/2 = 9.7 min), were mainly used in these studies to reduce the staggering time between tracer injection and the signal overlap. However, the accuracy of dynamic parameters estimation could be affected because of the limited detectable counts.
With a t1/2 of 109.8 min, 18F is the most widely used positron-emitting radioisotope for PET imaging. Most recently, Kadrmas et al. (29) simulated single-scan dual-tracer 3′-deoxy-3′-18F-fluorothymidine/18F-FDG PET imaging, characterizing the performance of recovered static and dynamic imaging measures for each tracer from dual-tracer datasets. In the current study, we conducted 18F-alfatide II and 18F-FDG dual-tracer dynamic imaging in 1 scan with a 40-min injection separation. After validating the data acquisition and analysis, we successfully applied this strategy to evaluate the tumor response to drug treatment.
The performance of signal separation with overlapping data in dual-tracer imaging is affected mainly by tracer injection order, the dose of each tracer, and the injection delay. In our previous RGD kinetics analysis studies, RGD tracers showed fast circulation clearance and urinary excretion (6,7,9). In addition, RGD disposition was not affected by factors such as mouse blood glucose concentration. Therefore, we administered 18F-alfatide II first for the dual-tracer imaging, and 18F-FDG was injected later. In general, a higher dose of the second tracer is needed for dual-tracer imaging, because it makes the signal of the second tracer stronger and less affected by the first one, benefitting parameter estimation. A 1:3 ratio between the first tracer and the second tracer has been suggested in a 62Cu-PTSM and 62Cu-ATSM dual-tracer simulation study (17). In this study, approximately equivalent doses of 18F-alfatide II and 18F-FDG were used, because the tumor uptake of 18F-FDG is much higher than that of 18F-alfatide II (2- to 4-fold). In our previous study of 18F-labeled dimeric RGD peptides, tumor uptake reached equilibrium at 30 min after injection (19); thus, we chose 40 min for the injection time separation in the current study.
We validated signal recovery of the 18F-FDG from the overlapped dual-tracer imaging data by performing 18F-FDG single-tracer imaging on the same mice on the day before the dual-tracer imaging. The reproducibility of 18F-FDG has been confirmed in mouse tumor xenografts with 6-h intervals (30). We also compared the imaging results from different days, and excellent reproducibility was found (Supplemental Fig. 3). Consequently, to simplify the situation, we ignored the change of tumor 18F-FDG uptake at a time interval of 24 h. The tumor uptake and influx rate of 18F-FDG both showed good correlations between the single-tracer imaging and dual-tracer imaging, and the kinetic parameters calculated from the recovered 18F-FDG signal appeared to be able to reflect the real 18F-FDG accumulation.
It has been reported that doxorubicin could cause reduced tumor metabolism and angiogenesis (31–34). On the basis of the static image quantification, no significant differences in tumor uptake of 18F-alfatide II and 18F-FDG were found after doxorubicin treatment, most possibly due to the relatively large intergroup variance and altered tumor microenvironment contributing to nonspecific tumor uptake (19). Besides its definition as k3/k4, Bp value is also known as the ratio of Bmax and Kd, in which Bmax refers to the total number of receptors and Kd represents the affinity of any single receptor (35). After doxorubicin treatment, the reduced integrin αvβ3 receptor density (Bmax) resulted in a significant decrease of the Bp value (P < 0.01). The 18F-FDG influx rate showed decreased value on treatment in both control and treated groups but was more pronounced in the treated group (P < 0.05). The variance of the 18F-alfatide II Bp value was more significant than that of 18F-FDG influx rate, indicating more changes in tumor angiogenesis than metabolism on doxorubicin treatment. Similar findings were also confirmed in the Abraxane treatment. These results also suggest that dynamic analysis with compartmental modeling is more sensitive than the static measurement, substantiating the benefit of kinetic analysis presented in our previous study (19).
We have previously used the left ventricle ROI to generate the input function, because there was little myocardial uptake of RGD (19). However, this is not appropriate for 18F-FDG because of the inherent high myocardial uptake. Consequently, the abdominal aorta was chosen to outline the input function for the dual-tracer imaging. Arterial blood sampling wasn’t performed in this study because of the technical challenge. A population-based input function (36) or 1 blood sample (25) at the end of dynamic imaging may be a good choice in our future studies.
To the best of our knowledge, this is the first experimental dual-tracer dataset to observe angiogenesis and glucose metabolism simultaneously. On the basis of our previous kinetics analysis of RGD peptides, an appropriate injection time separation was chosen, and the signal of the second tracer was reliably recovered using compartmental modeling. Dual-tracer single-scan PET imaging may become a useful method to provide more complete tumor information simultaneously.
CONCLUSION
In this study, we performed dual-tracer dynamic imaging using staggered injections of 18F-alfatide II and 18F-FDG for simultaneous observation of angiogenesis and metabolism, which serve as sensitive, early markers of tumor responses to therapy. The signal from each tracer was successfully separated with compartmental modeling. The tumor uptake values and dynamic parameters from recovered signals were validated with single-tracer imaging. The dual-tracer imaging was applied to monitor the tumor response to chemotherapeutics. We found that dual-tracer single-scan imaging can be used to reflect tumor response, and quantitative kinetic parameters calculated from dynamic data are more sensitive than static imaging.
DISCLOSURE
The costs of publication of this article were defrayed in part by the payment of page charges. Therefore, and solely to indicate this fact, this article is hereby marked “advertisement” in accordance with 18 USC section 1734. This work was supported in part by National Key Basic Research Program (973 Project; 2013CB733802) and by the Intramural Research Program of the National Institute of Biomedical Imaging and Bioengineering (NIBIB), National Institutes of Health (NIH). No other potential conflict of interest relevant to this article was reported.
Footnotes
↵* Contributed equally to this work.
Published online Nov. 14, 2013.
- © 2014 by the Society of Nuclear Medicine and Molecular Imaging, Inc.
REFERENCES
- Received for publication February 25, 2013.
- Accepted for publication September 10, 2013.


Jump to section
Related Articles
Cited By...
- 18F-Alfatide II PET/CT for Identification of Breast Cancer: A Preliminary Clinical Study
- Comparing the Diagnostic Potential of 68Ga-Alfatide II and 18F-FDG in Differentiating Between Non-Small Cell Lung Cancer and Tuberculosis
- Preclinical Kinetic Analysis of the Caspase-3/7 PET Tracer 18F-C-SNAT: Quantifying the Changes in Blood Flow and Tumor Retention After Chemotherapy