
Main menu

  • Home
  • Content
    • Current
    • Ahead of print
    • Past Issues
    • JNM Supplement
    • SNMMI Annual Meeting Abstracts
    • Continuing Education
    • JNM Podcasts
  • Subscriptions
    • Subscribers
    • Institutional and Non-member
    • Rates
    • Journal Claims
    • Corporate & Special Sales
  • Authors
    • Submit to JNM
    • Information for Authors
    • Assignment of Copyright
    • AQARA requirements
  • Info
    • Reviewers
    • Permissions
    • Advertisers
  • About
    • About Us
    • Editorial Board
    • Contact Information
  • More
    • Alerts
    • Feedback
    • Help
    • SNMMI Journals
  • SNMMI
    • JNM
    • JNMT
    • SNMMI Journals
    • SNMMI

User menu

  • Subscribe
  • My alerts
  • Log in
  • My Cart

Search

  • Advanced search
Journal of Nuclear Medicine
  • SNMMI
    • JNM
    • JNMT
    • SNMMI Journals
    • SNMMI
  • Subscribe
  • My alerts
  • Log in
  • My Cart
Journal of Nuclear Medicine

Advanced Search

  • Home
  • Content
    • Current
    • Ahead of print
    • Past Issues
    • JNM Supplement
    • SNMMI Annual Meeting Abstracts
    • Continuing Education
    • JNM Podcasts
  • Subscriptions
    • Subscribers
    • Institutional and Non-member
    • Rates
    • Journal Claims
    • Corporate & Special Sales
  • Authors
    • Submit to JNM
    • Information for Authors
    • Assignment of Copyright
    • AQARA requirements
  • Info
    • Reviewers
    • Permissions
    • Advertisers
  • About
    • About Us
    • Editorial Board
    • Contact Information
  • More
    • Alerts
    • Feedback
    • Help
    • SNMMI Journals
  • View or Listen to JNM Podcast
  • Visit JNM on Facebook
  • Join JNM on LinkedIn
  • Follow JNM on Twitter
  • Subscribe to our RSS feeds
OtherBasic Science Investigations

Absolute Quantification of Myocardial Blood Flow with H215O and 3-Dimensional PET: An Experimental Validation

Klaus P. Schäfers, Terence J. Spinks, Paolo G. Camici, Peter M. Bloomfield, Christopher G. Rhodes, Marilyn P. Law, Christopher S.R. Baker and Ornella Rimoldi
Journal of Nuclear Medicine August 2002, 43 (8) 1031-1040;
Klaus P. Schäfers
  • Find this author on Google Scholar
  • Find this author on PubMed
  • Search for this author on this site
Terence J. Spinks
  • Find this author on Google Scholar
  • Find this author on PubMed
  • Search for this author on this site
Paolo G. Camici
  • Find this author on Google Scholar
  • Find this author on PubMed
  • Search for this author on this site
Peter M. Bloomfield
  • Find this author on Google Scholar
  • Find this author on PubMed
  • Search for this author on this site
Christopher G. Rhodes
  • Find this author on Google Scholar
  • Find this author on PubMed
  • Search for this author on this site
Marilyn P. Law
  • Find this author on Google Scholar
  • Find this author on PubMed
  • Search for this author on this site
Christopher S.R. Baker
  • Find this author on Google Scholar
  • Find this author on PubMed
  • Search for this author on this site
Ornella Rimoldi
  • Find this author on Google Scholar
  • Find this author on PubMed
  • Search for this author on this site
  • Article
  • Figures & Data
  • Info & Metrics
  • PDF
Loading

Article Figures & Data

Figures

  • Tables
  • FIGURE 1.
    • Download figure
    • Open in new tab
    • Download powerpoint
    FIGURE 1.

    Cluster probability images of transaxial planes and corresponding time-activity curves. (A) Venous cluster (right ventricular cavity). (B) Arterial cluster (left ventricular cavity. (C) Myocardial tissue cluster.
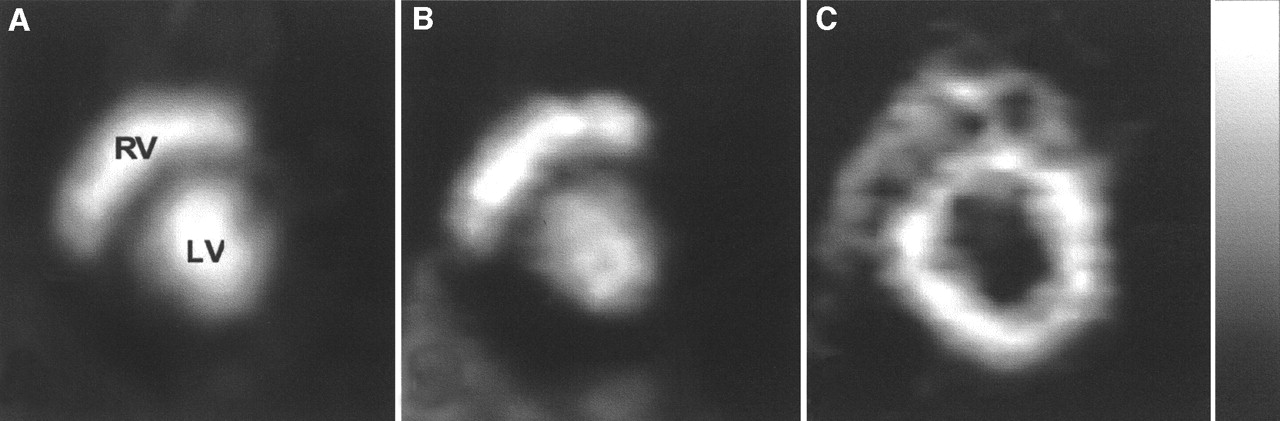
  • FIGURE 2.
    • Download figure
    • Open in new tab
    • Download powerpoint
    FIGURE 2.

    Short-axis images obtained from representative study show blood pool (A) measured with C15O, which labels erythrocytes through formation of carboxyhemoglobin, and distribution of H215O separated in blood (B) and myocardial tissue (C) component. B and C are calculated by means of factor analysis. RV = right ventricle; LV = left ventricle.
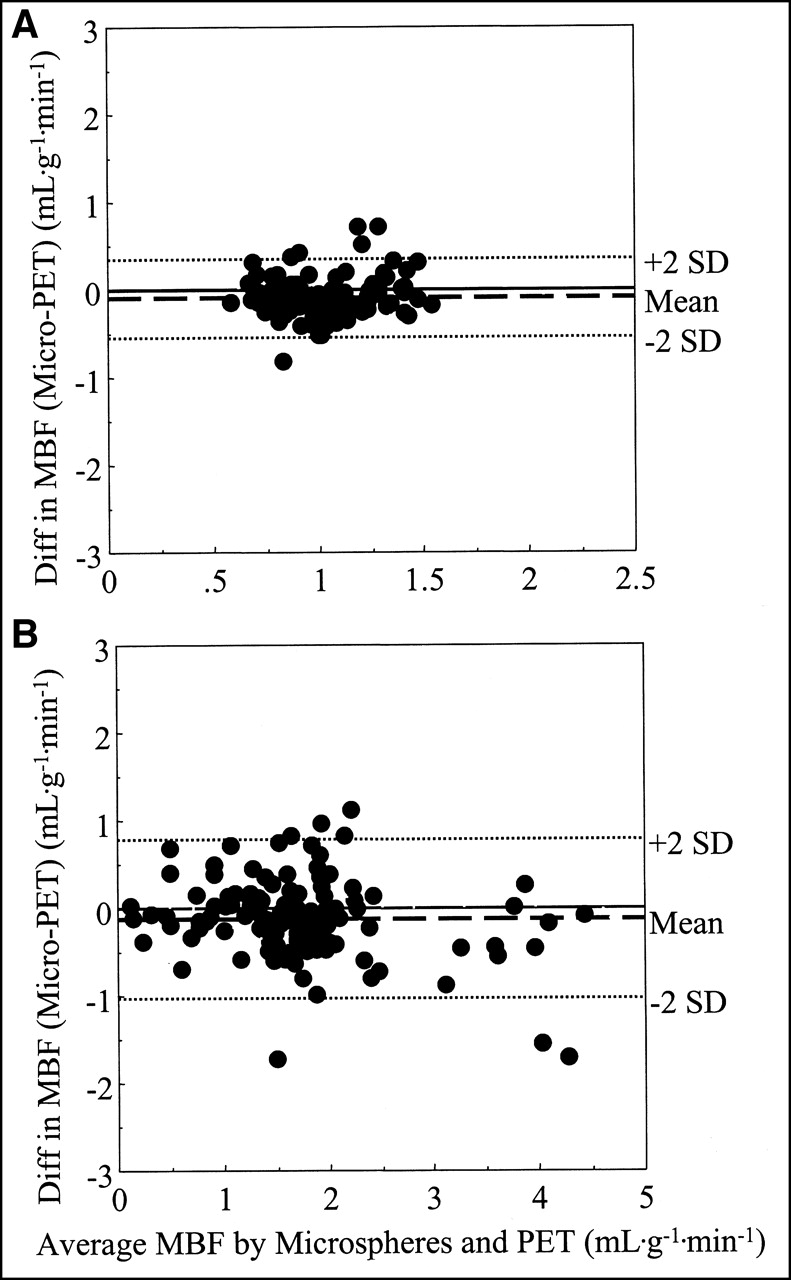
  • FIGURE 3.
    • Download figure
    • Open in new tab
    • Download powerpoint
    FIGURE 3.

    Regression analysis (A) and Bland-Altman plot (B) of variation of MBF obtained from microspheres and PET in all ROIs. Dashed lines = 95% confidence limits for slope; Diff = difference.
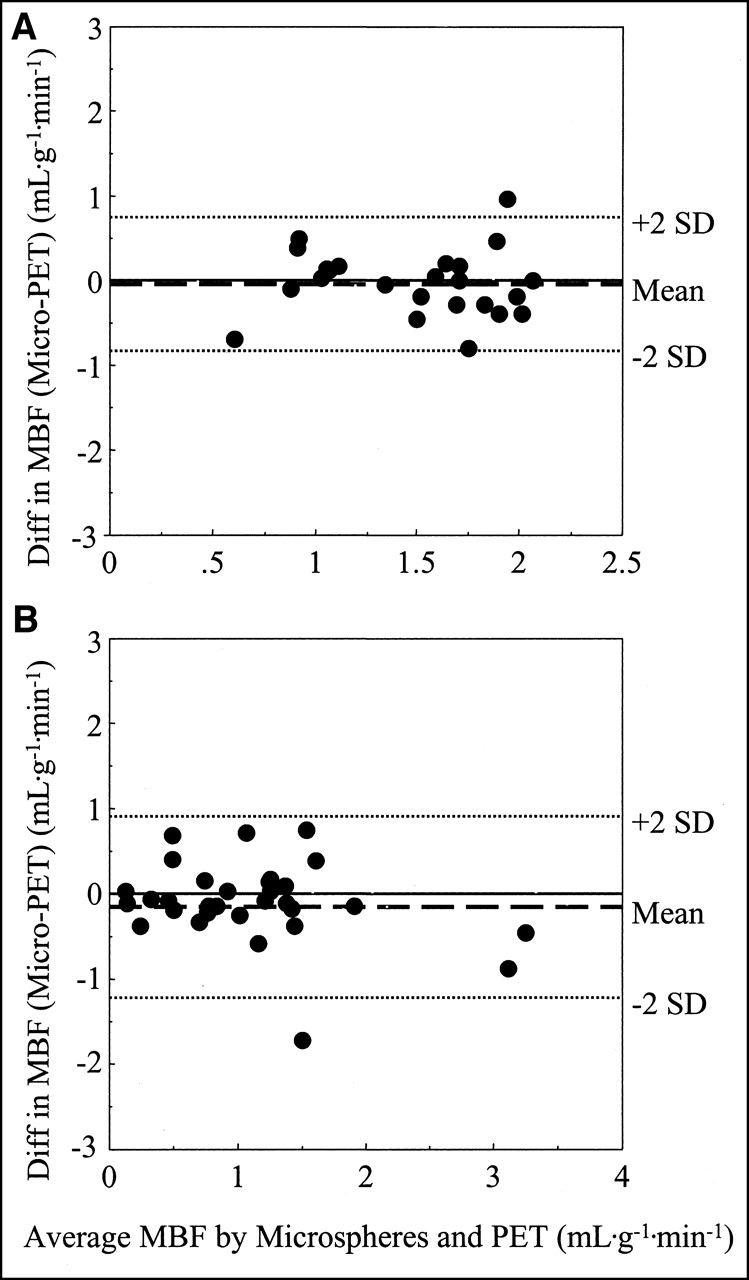
  • FIGURE 4.
    • Download figure
    • Open in new tab
    • Download powerpoint
    FIGURE 4.

    Bland-Altman plots show agreement of MBF obtained from microspheres and PET under resting conditions (A) and during hyperemia induced with dipyridamole (B). Diff = difference.

  • FIGURE 5.
    • Download figure
    • Open in new tab
    • Download powerpoint
    FIGURE 5.

    Bland-Altman plots show agreement of MBF obtained from microspheres and PET during hyperemia induced with dipyridamole. Data are presented for group in which left circumflex coronary artery was occluded (A) and for group in which left anterior descending coronary artery was occluded (B). Diff = difference.
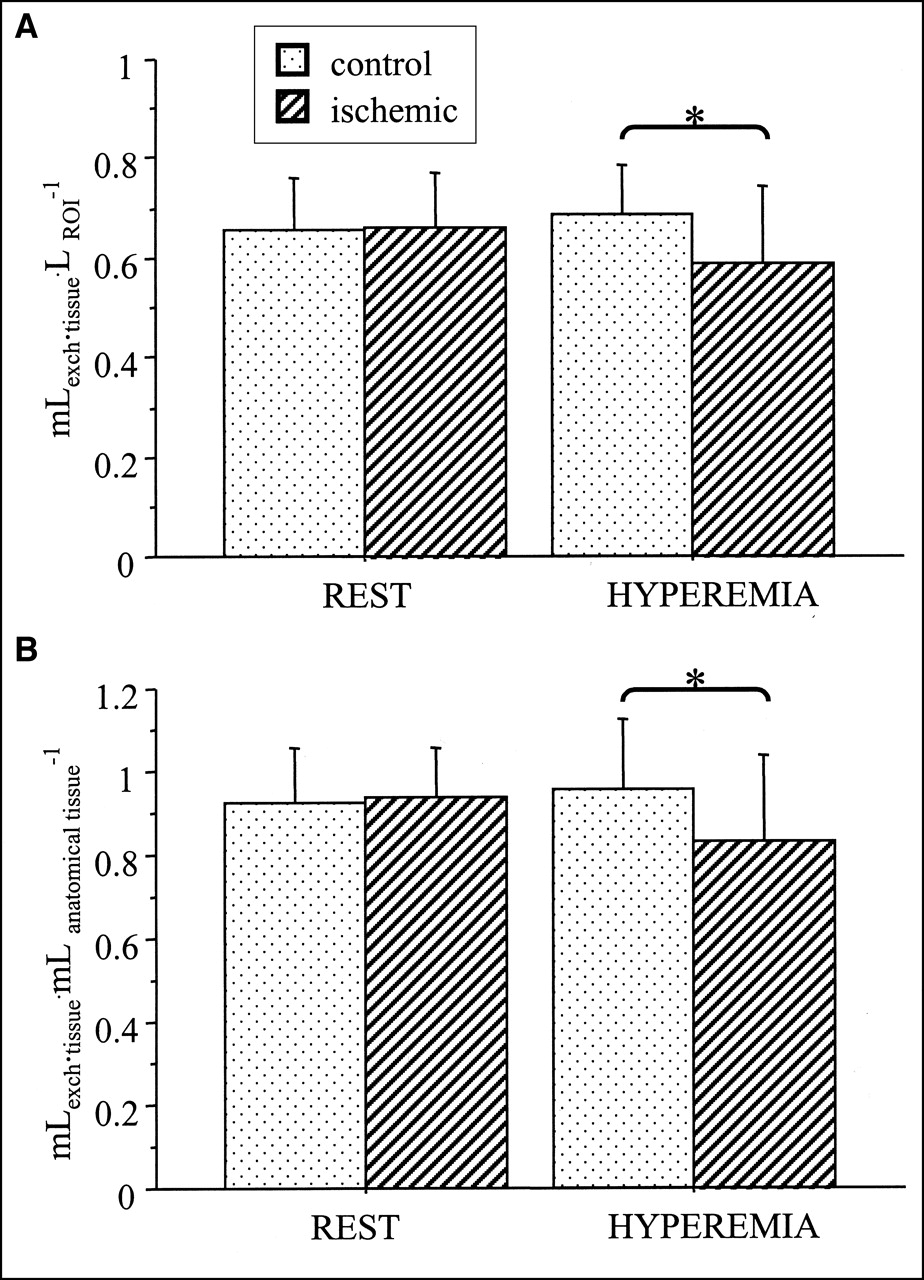
  • FIGURE 6.
    • Download figure
    • Open in new tab
    • Download powerpoint
    FIGURE 6.

    Histogram shows comparison of PTF (A) and PTI (B) in normally perfused (control) and ischemic myocardium. Values of PTF and PTI are reduced during dipyridamole-induced stress (hyperemia) *P < 0.05.

Tables

  • Figures
    • View popup
    TABLE 1

    Hemodynamic Parameters at Baseline After Inflation of Hydraulic Occluder (Ischemia) and During Dipyridamole Infusion

    Systolic pressure (mm Hg)Diastolic pressure (mm Hg)Heart rate (beats/min)End-diastolic LV pressure (mm Hg)LV dP/dt maximum (mm Hg/s)% Segment shorteningMean coronary blood flow (mL/min)
    Baseline113 ± 1874 ± 1594 ± 209 ± 31,599 ± 31918.16 ± 3.833 ± 13
    Ischemia111 ± 1274 ± 12106 ± 179 ± 41,373 ± 2958.15 ± 2.9*16 ± 10*
    Ischemia + dipyridamole72 ± 8*†38 ± 6*†110 ± 138 ± 41,208 ± 3099.1 ± 3.2*27 ± 12
    • ↵* Significantly different from baseline (P < 0.05).

    • ↵† Ischemia significantly different from ischemia + dipyridamole.

    • View popup
    TABLE 2

    Comparison of Variance of Difference of MBF Measurement Between Microspheres and PET in Different Regions of Left Ventricle

    BasalMidventricularApex
    Rest
     Anterior0.0050.0380.126 b*
     Lateral0.0120.0310.113 b*
     Septal0.0080.0100.032
     Posterior0.124 a, s, i†0.137 s†
     Inferior0.0070.0340.032
    Hyperemia
     Anterior0.1160.362 l†0.254
     Lateral0.0630.0330.173 m*
     Septal0.1210.0890.096
     Posterior0.1350.579 l, s†
     Inferior0.0790.172 l†0.200
    • ↵* Apical regions significantly different from basal (b) or midventricular (m) regions (P < 0.05).

    • ↵† Significant contrast difference vs. other regions in short-axis partition: a = anterior, l = lateral, s = septal, i = inferior (P < 0.05).

PreviousNext
Back to top

In this issue

Journal of Nuclear Medicine: 43 (8)
Journal of Nuclear Medicine
Vol. 43, Issue 8
August 1, 2002
  • Table of Contents
  • Index by author
Print
Download PDF
Article Alerts
Sign In to Email Alerts with your Email Address
Email Article

Thank you for your interest in spreading the word on Journal of Nuclear Medicine.

NOTE: We only request your email address so that the person you are recommending the page to knows that you wanted them to see it, and that it is not junk mail. We do not capture any email address.

Enter multiple addresses on separate lines or separate them with commas.
Absolute Quantification of Myocardial Blood Flow with H215O and 3-Dimensional PET: An Experimental Validation
(Your Name) has sent you a message from Journal of Nuclear Medicine
(Your Name) thought you would like to see the Journal of Nuclear Medicine web site.
Citation Tools
Absolute Quantification of Myocardial Blood Flow with H215O and 3-Dimensional PET: An Experimental Validation
Klaus P. Schäfers, Terence J. Spinks, Paolo G. Camici, Peter M. Bloomfield, Christopher G. Rhodes, Marilyn P. Law, Christopher S.R. Baker, Ornella Rimoldi
Journal of Nuclear Medicine Aug 2002, 43 (8) 1031-1040;

Citation Manager Formats

  • BibTeX
  • Bookends
  • EasyBib
  • EndNote (tagged)
  • EndNote 8 (xml)
  • Medlars
  • Mendeley
  • Papers
  • RefWorks Tagged
  • Ref Manager
  • RIS
  • Zotero
Share
Absolute Quantification of Myocardial Blood Flow with H215O and 3-Dimensional PET: An Experimental Validation
Klaus P. Schäfers, Terence J. Spinks, Paolo G. Camici, Peter M. Bloomfield, Christopher G. Rhodes, Marilyn P. Law, Christopher S.R. Baker, Ornella Rimoldi
Journal of Nuclear Medicine Aug 2002, 43 (8) 1031-1040;
Twitter logo Facebook logo LinkedIn logo Mendeley logo
  • Tweet Widget
  • Facebook Like
  • Google Plus One
Bookmark this article

Jump to section

  • Article
    • Abstract
    • MATERIALS AND METHODS
    • RESULTS
    • DISCUSSION
    • CONCLUSION
    • Acknowledgments
    • Footnotes
    • REFERENCES
  • Figures & Data
  • Info & Metrics
  • PDF

Related Articles

  • No related articles found.
  • PubMed
  • Google Scholar

Cited By...

  • Relationship Between Regional Myocardial Oxygenation and Perfusion in Patients With Coronary Artery Disease: Insights From Cardiovascular Magnetic Resonance and Positron Emission Tomography
  • To BOLDly Go Where Positron Emission Tomography Has Been Before
  • Myocardial Perfusion in Nonischemic Dilated Cardiomyopathy With and Without Atrial Fibrillation
  • Use of H215O-PET and DCE-MRI to Measure Tumor Blood Flow
  • Quantification of Cerebral Blood Flow and Oxygen Metabolism with 3-Dimensional PET and 15O: Validation by Comparison with 2-Dimensional PET
  • Absolute Quantification of Myocardial Blood Flow with 13N-Ammonia and 3-Dimensional PET
  • Diagnostic and clinical perspectives of fusion imaging in cardiology: is the total greater than the sum of its parts?
  • Reproducibility of Measurements of Regional Myocardial Blood Flow in a Model of Coronary Artery Disease: Comparison of H215O and 13NH3 PET Techniques
  • Quantification of Subendocardial and Subepicardial Blood Flow Using 15O-Labeled Water and PET: Experimental Validation
  • Resting Myocardial Blood Flow Is Impaired in Hibernating Myocardium: A Magnetic Resonance Study of Quantitative Perfusion Assessment
  • PET/CT: Challenge for Nuclear Cardiology
  • Parametric Imaging of Myocardial Blood Flow with 15O-Water and PET Using the Basis Function Method
  • The quantification of absolute myocardial perfusion in humans by contrast echocardiography: Algorithm and validation
  • 18F-FDG PET for Detecting Myocardial Viability: Validation of 3D Data Acquisition
  • Myocardial Blood Flow Measurement by PET: Technical Aspects and Clinical Applications
  • Quantitative Comparison of Analytic and Iterative Reconstruction Methods in 2- and 3-Dimensional Dynamic Cardiac 18F-FDG PET
  • Improvement of Algorithm for Quantification of Regional Myocardial Blood Flow Using 15O-Water with PET
  • CT Attenuation Correction for Myocardial Perfusion Quantification Using a PET/CT Hybrid Scanner
  • Bicycle Exercise Stress in PET for Assessment of Coronary Flow Reserve: Repeatability and Comparison with Adenosine Stress
  • Myocardial Perfusion in 3 Dimensions
  • Google Scholar

More in this TOC Section

  • Synthesis and Biologic Evaluation of Novel 18F-Labeled Probes Targeting Prostate-Specific Membrane Antigen for PET of Prostate Cancer
  • Tumor-Specific Binding of Radiolabeled PEGylated GIRLRG Peptide: A Novel Agent for Targeting Cancers
  • PET/MRI of Hypoxic Atherosclerosis Using 64Cu-ATSM in a Rabbit Model
Show more Basic Science Investigations

Similar Articles

SNMMI

© 2025 SNMMI

Powered by HighWire