


Abstract
The aim of this study was to compare 2-dimensional (2D) and 3-dimensional (3D) dynamic PET for the absolute quantification of myocardial blood flow (MBF) with 13N-ammonia (13N-NH3). Methods: 2D and 3D MBF measurements were collected from 21 patients undergoing cardiac evaluation at rest (n = 14) and during standard adenosine stress (n = 7). A lutetium yttrium oxyorthosilicate–based PET/CT system with retractable septa, enabling the sequential acquisition of 2D and 3D images within the same patient and study, was used. All 2D studies were performed by injecting 700–900 MBq of 13N-NH3. For 14 patients, 3D studies were performed with the same injected 13N-NH3 dose as that used in 2D studies. For the remaining 7 patients, 3D images were acquired with a lower dose of 13N-NH3, that is, 500 MBq. 2D images reconstructed by use of filtered backprojection (FBP) provided the reference standard for MBF measurements. 3D images were reconstructed by use of Fourier rebinning (FORE) with FBP (FORE–FBP), FORE with ordered-subsets expectation maximization (FORE–OSEM), and a reprojection algorithm (RP). Results: Global MBF measurements derived from 3D PET with FORE–FBP (r = 0.97), FORE–OSEM (r = 0.97), and RP (r = 0.97) were well correlated with those derived from 2D FBP (all Ps < 0.0001). The mean ± SD differences in global MBF measurements between 3D FORE–FBP and 2D FBP and between 3D FORE–OSEM and 2D FBP were 0.01 ± 0.14 and 0.01 ± 0.15 mL/min/g, respectively. The mean ± SD difference in global MBF measurements between 3D RP and 2D FBP was 0.00 ± 0.16 mL/min/g. The best correlation between 2D PET and 3D PET performed with the lower injected activity was found for the 3D FORE–FBP reconstruction algorithm (r = 0.95, P < 0.001). Conclusion: For this scanner type, quantitative measurements of MBF with 3D PET and 13N-NH3 were in excellent agreement with those obtained with the 2D technique, even when a lower activity was injected.
The assessment of quantitative regional myocardial blood flow (MBF) and coronary flow reserve with 13N-ammonia (13N-NH3) has been well established for 2-dimensional (2D) PET (1–4). Recently, there has been growing interest in the use of PET and PET/CT scanners that operate only in the 3-dimensional (3D) mode (5). The main advantage of the 3D mode (with septa retracted) of data acquisition is that its sensitivity is higher than that of the conventional 2D mode (septa extended) (6,7). The increased counting rate in the 3D acquisition mode, however, comes at the cost of increased scatter, number of random events, and dead time compared with those observed in the 2D mode (8). Although the use of 3D PET has demonstrated significant advantages over the use of 2D PET for brain imaging (9–11), the relative benefits of 3D PET for whole-body oncology (12) and cardiac applications are less clear. Previous experimental animal and clinical comparisons of 2D and 3D PET performance for myocardial perfusion imaging with 13N-NH3, 15O-H2O, and 82Rb showed either a disadvantage for 3D PET (13) or images of comparable quality (14–16). More recently, Roelants et al. (16) demonstrated, in studies of dogs, that dynamic measurements of absolute regional MBF with 13N-NH3 and 3D PET provided results similar to those obtained with the 2D technique.
The aim of this study was to compare 2D and 3D PET acquisition modes with analytic and iterative reconstruction algorithms for the absolute quantification of MBF with 13N-NH3.
MATERIALS AND METHODS
Study Population
Twenty-one patients (15 men; mean ± SD age, 63 ± 8 y; age range, 48–77 y) admitted for the assessment of myocardial perfusion with dynamic 13N-NH3 PET were included in this investigation. Seven patients were referred because of suspected coronary artery disease. Nine patients had known coronary artery disease and a history of previous coronary artery bypass grafting (n = 6) or percutaneous coronary revascularization (n = 3). Five patients with a normal coronary angiogram were evaluated for microvascular disease. The mean ± SD weight of the patients was 74 ± 11 kg (weight range, 57–98 kg). All patients were carefully instructed to refrain from caffeine intake during the 24 h before the study. The study protocol was approved by the local ethics committee, and all subjects gave written informed consent.
PET Scanner
The same PET/CT system was used for all data acquisitions in both 2D and 3D modes. Image data were obtained with an integrated PET/CT system (Discovery ST RX; GE Healthcare) (17). This device combines the Light Speed 16-slice CT scanner and a newly designed multiring lutetium yttrium oxyorthosilicate (LYSO) block detector system. The LYSO crystals are arranged in 24 detector rings. The crystals have dimensions of 4.2 mm transaxially, 6.3 mm axially, and 30 mm radially. The crystals are arranged in detection units (blocks) consisting of 9 × 6 crystals and coupled to a single 4-anode square photomultiplier. The 24 rings of the PET system allow 47 images (in 24 direct and 23 cross planes) to be obtained at a spacing of 3.27 mm and covering an axial field of view (FOV) of 15.7 cm. The PET system can acquire data in both 2D and 3D modes. In both 2D and 3D configurations, the energy window of the system is set to 425–650 keV, and the coincidence time window is set to 6.5 ns. The septa, which define the image planes in the 2D scanning mode, can be automatically retracted from the scanner FOV to allow scanning in the 3D acquisition mode. LYSO has a scintillation decay time of 42 ns. This fast decay time leads to a reduction in dead time and enables improved timing resolution and a narrower coincidence time window, in turn reducing the number of random events. The reduction in the random coincidence rate is manifested in a high peak noise–equivalent counting rate. Detailed National Electrical Manufacturers Association NU 2-2001 performance measurements of sensitivity, spatial resolution, image quality, scatter fraction, and counting rate capability for this PET/CT system were previously reported by Kemp et al. (17).
Acquisition Protocol
MBF measurements were acquired in the 2D and 3D modes at rest (n = 14) and during standard adenosine stress (n = 7) (18). 3D data acquisition was performed with the interplane septa removed from the FOV. The protocol started with the acquisition of 2D emission data. For 2D PET, we administered an intravenous bolus injection of 700–900 MBq of 13N-NH3, immediately followed by a 20-min dynamic emission scan with the following sequence of frames: 9 × 10 s, 6 × 15 s, 3 × 20 s, 2 × 30 s, and 1 × 900 s. After 50 min to allow for the decay of 13N-NH3, MBF measurements were obtained with the 3D acquisition mode but with otherwise unchanged parameters. For 14 patients, 3D studies were performed with the same injected 13N-NH3 dose as that used in 2D studies. For the remaining 7 patients, 3D images were acquired with a lower dose of 13N-NH3, that is, 500 MBq. This dose was arbitrarily chosen with the intentions to decrease the radiation dose to the patient and to reduce dead time and scatter for the 3D acquisition but to maintain a signal-to-noise ratio that would allow quantitative MBF analysis. 3D data could not be acquired during stress on the same day for 4 patients because they were unable to tolerate repeated administrations of adenosine. A single low-dose CT scan was acquired for attenuation correction of all emission data as previously reported (19).
Blood pressure and heart rate were recorded every minute. The electrocardiogram was monitored continuously throughout the procedure, and a 12-lead electrocardiogram was recorded at baseline and every minute during adenosine administration and during 3 min of recovery.
Image Reconstruction
The data were corrected for random coincidences, geometry, normalization, dead-time losses, scatter, and attenuation. The 2D emission data were reconstructed by use of filtered backprojection (FBP) with a Hanning filter (cutoff, 4.8 mm). This method is the current established and validated clinical reconstruction protocol used for cardiac PET studies at University Hospital Zurich. The 3D data were converted into sets of contiguous transaxial 2D sinograms by use of Fourier rebinning (FORE) as previously reported (20). 3D images were reconstructed by use of 3 different techniques included in the scanner software: FORE with FBP (FORE–FBP), FORE with ordered-subsets expectation maximization (OSEM) (number of subsets, 32; number of iterations, 4; loop filter, 2.34 mm full width at half maximum; postprocessing filter, 2.57 mm full width at half maximum) (FORE–OSEM), and a reprojection algorithm (RP) (Hanning filter; cutoff, 4.8 mm). The image matrix size was 128 × 128, and the FOV was 30 cm.
Data Analysis
All images were transferred to a workstation (SUN Microsystems) and analyzed with the PMOD software package (PMOD Technologies Ltd.) as previously reported (21–23). Regions of interest (ROIs) were drawn semiautomatically by use of a centerline within the myocardium in the short-axis projection. The junctions of the right and left ventricles were marked to indicate the septum. In accordance with the recommendations of the American Heart Association (24), the left ventricle myocardial wall was subdivided into a total of 16 segments. ROIs were drawn in each segment and in the left (for input function) and right (for septal spillover correction) ventricular blood pools on the 900-s frames. The MBF was estimated by model fitting of the myocardial time–activity curves (25). Corrections for partial volume and spillover were performed with a method developed (3) and validated (26) by Hutchins et al. In brief, an ROI is chosen to contain only myocardial tissue and blood; thus, the relationship between the measured PET counts in a region (CPET) and the true counts in the myocardium (Cm) and arterial blood (Ca) is modeled as follows: CPET(t) = FaCa(t) + (1 − Fa)Cm(t), where t is time. Fa is the fractional contribution of the blood pool to the measured PET counts in a region and is dependent on the placement of the region, the resolution of the camera, and the movement of the myocardium. Because the contribution of the myocardium to total regional counts decreases with an increasing blood-pool fraction, Cm is multiplied by (1 − Fa). Fa is estimated together with the other kinetic tissue parameters by least-squares fitting. MBF is given in mL/min/g of tissue. Information on scatter fractions was extracted from the Digital Imaging and Communications in Medicine image headers.
Statistical Analysis
Results are expressed as the mean, median, and SD. 2D images reconstructed with FBP provided the reference standard for MBF measurements. Linear regression analysis, the limits of agreement according to Bland and Altman (BA limits of agreement), and the SEE were determined to compare MBF measurements between 2D PET and 3D PET (27). Heterogeneity was expressed as the coefficient of variation (COV). Comparisons of MBF measurements were evaluated for statistical significance with a t test for paired samples. A P value of <0.05 (after the application of Bonferroni correction for multiple comparisons) was considered statistically significant.
RESULTS
There were no significant differences between the heart rate and the systolic blood pressure during 2D and 3D MBF measurements at rest (71 vs. 69 beats per minute and 118 vs. 117 mm Hg) and during peak pharmacologic stress (75 vs. 75 beats per minute and 122 vs. 118 mm Hg).
Means and COVs for global and regional MBF measurements are shown in Table 1. Global MBF measurements ranged from 0.47 to 2.29 mL/min/g. Global MBF measurements derived from 3D PET with FORE–FBP (r = 0.97), FORE–OSEM (r = 0.97), and RP (r = 0.97) were well correlated with those derived from 2D FBP (all Ps < 0.0001) and showed excellent agreement (Fig. 1). The mean ± SD differences in global MBF measurements between 3D FORE–FBP and 2D FBP and between 3D FORE–OSEM and 2D FBP were 0.01 ± 0.14 mL/min/g (BA limits of agreement of −0.38 and 0.34 mL/min/g) and 0.01 ± 0.15 mL/min/g (BA limits of agreement of −0.67 and 0.41 mL/min/g), respectively. The mean ± SD difference in global MBF measurements between 3D RP and 2D FBP was 0.00 ± 0.16 mL/min/g (BA limits of agreement of −0.64 and 0.46 mL/min/g). For the subgroup of 7 patients in whom the low-dose protocol was used, global MBF measurements derived from 3D PET with FORE–FBP (r = 0.95), FORE–OSEM (r = 0.93), and RP (r = 0.92) were also well correlated with those derived from 2D FBP (all Ps < 0.001). Accordingly, no significant differences were found in mean ± SD global MBF measurements between 3D FORE–FBP and 2D FBP (1.67 ± 0.49 vs. 1.70 ± 0.43 mL/min/g), between 3D FORE–OSEM and 2D FBP (1.65 ± 0.45 vs. 1.70 ± 0.43 mL/min/g), and between 3D RP and 2D FBP (1.64 ± 0.51 vs. 1.70 ± 0.43 mL/min/g) for patients in the low-dose group (all Ps were not significant). Similarly, an excellent correlation was confirmed for regional absolute MBF measurements in infarcted segments between 3D FORE–FBP and 2D FBP (r = 0.97), between 3D FORE–OSEM and 2D FBP (r = 0.99), and between 3D RP and 2D FBP (r = 0.89) (all Ps < 0.0001).

Bland–Altman plots and linear regression analysis for global MBF measurements obtained by PET with 13N-NH3: 2D FBP vs. 3D FORE–FBP (A), 2D FBP vs. 3D FORE–OSEM (B), and 2D FBP vs. 3D RP (C). Dotted lines in linear regression analysis are lines of identity.
Global and Regional MBF Measurements and COVs at Rest and During Stress
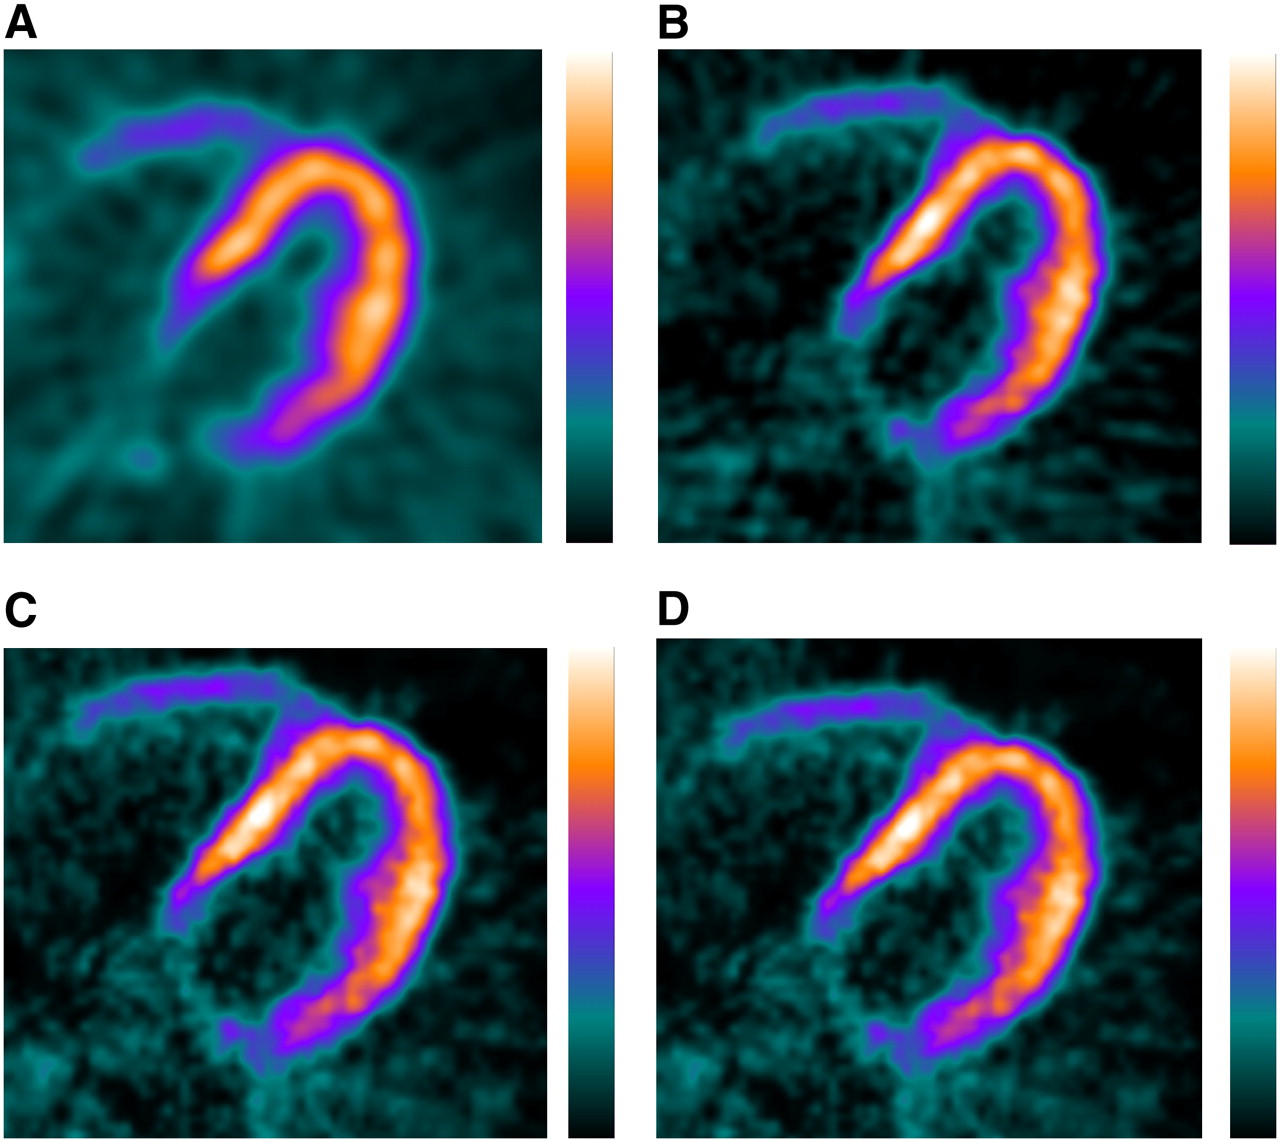
Visual inspection of the 2D static PET images revealed fixed perfusion defects in 9 patients and mixed (fixed and reversible defects) in 3 patients. 3D PET with any of the 3 reconstruction algorithms provided findings identical to those obtained by 2D PET, as determined by visual analysis. Representative transaxial images from the 2D and 3D 13N-NH3 scans (900-s frames) are shown in Figure 2.

Static transaxial images obtained for representative patient (weight, 74 kg; height, 178 cm) with 2D FBP after injection of 900 MBq of 13N-NH3 (A) and images obtained with low-dose protocol (500 MBq of 13N-NH) and 3D FORE–FBP (B), 3D FORE–OSEM (C), and 3D RP (D).
The median values for the maximum scatter fractions in the scans were 19% for the 2D acquisition and 49% for the 3D acquisition. The scatter fractions in the scans obtained with normal and reduced doses of injected 13N-NH3 were comparable.
DISCUSSION
Our findings showed that quantitative global and regional MBF measurements obtained by 3D PET and 13N-NH3 with a high-performance LYSO-based PET/CT system provided results highly comparable to those obtained with the 2D technique. Absolute MBF measurements obtained by 3D PET showed excellent correlation and agreement with those obtained by 2D PET over a wide flow range, indicating that 3D myocardial 13N-NH3 PET perfusion imaging (depending on scanner characteristics) may be a valuable alternative to imaging with the conventional 2D mode. MBF measurements derived from 3D PET performed with a low dose of 13N-NH3 were also well correlated with those derived from 2D PET. As a consequence, 13N-NH3 PET in the 3D mode may be performed with a lower injected activity, potentially allowing reductions in the radiation dose to the patient and tracer costs. To the best of our knowledge, a 3D PET acquisition technique for the absolute quantification of MBF with 13N-NH3 has not yet been reported.
Our findings are in line with those of other preliminary reports. Roelants et al. (16) recently demonstrated, in studies of dogs, that 3D PET with either 13N-NH3 or 15O-H2O provided results similar to those obtained with the 2D technique for the absolute quantification of MBF, despite the fact that a lower activity (approximately 30% lower) was injected for the 3D acquisition. Similarly, Schäfers et al. (14) found that 3D PET with15O-H2O water and microspheres as the gold standard provided accurate absolute regional MBF measurements in pigs. However, because they used a 3D-only PET scanner (ECAT EXACT 3D; Siemens), their data did not allow a direct comparison between 2D and 3D acquisition modes. Knesaurek et al. (15) demonstrated, in studies of humans, that the 2D and 3D modes provided images of comparable quality in myocardial perfusion studies carried out with 82Rb and a PET system with a high counting rate (Advance PET scanner; GE Healthcare). In contrast, in another study comparing 2D and 3D 82Rb cardiac PET images obtained with a different dedicated PET system (ECAT EXACT; Siemens), 2D images were reported to be superior (13).
3D images are more susceptible to degradation by randoms and scatter, and this degradation may be particularly problematic in regions that have high uptake and that are immediately adjacent to the heart, such as the liver. In fact, in the present study, COVs were generally highest in the inferior myocardial segments. However, the observed degrees of heterogeneity of myocardial perfusion within the various left ventricular regions, particularly for the inferior segments, were similar between the 2D and 3D acquisition modes, indicating that 3D PET provided accurate results for both global and regional MBF measurements.
Blood-pool activity concentrations of up to 300 kBq/mL were measured during the bolus passage. In 3D acquisitions, such activity concentrations result in increased scatter, as demonstrated in the National Electrical Manufacturers Association NU 2-2001 performance evaluation of the system (17), as well as in increased dead time. However, the fact that quantitative blood flows in 3D acquisitions were comparable to those in 2D acquisitions indicated that the correction procedures built into the system are able to cope with such situations arising in 3D cardiac scans with 13N-NH3.
Major limitations of quantitative cardiac PET perfusion studies are the relatively poor statistics for the reconstructed images. 2D FBP algorithms are traditionally used for image reconstruction in cardiac PET studies. Iterative reconstruction methods, such as OSEM, are a promising alternative to FBP. Several authors have reported that OSEM produces image quality similar to or better than that produced by the standard 2D FBP algorithm (15,28). However, limited data are available so far on the clinical use of iterative reconstruction algorithms for quantitative cardiac PET studies (29,30). Our results showed that 3D PET with an iterative reconstruction method (FORE–OSEM) was as accurate as 2D PET with an FBP reconstruction algorithm for the absolute quantification of MBF. This finding is in accordance with a recent report by Lubberink et al. (30), who investigated the effects of both 2D and 3D PET acquisition protocols and analytic and iterative reconstruction techniques on quantitative cardiac 18F-FDG PET studies in 8 patients. Images were reconstructed with FBP or attenuation-weighted OSEM, combined with FORE for 3D acquisitions. They found no significant differences in 18F-FDG uptake in cardiac studies reconstructed with OSEM and FBP and acquired in the 2D and 3D modes, suggesting that 3D acquisition with FORE–attenuation-weighted OSEM reconstruction is the preferred choice for 18F-FDG cardiac PET studies.
Our results may have implications for future PET/CT protocols. First, we demonstrated that, when a high-performance PET/CT system with a high counting rate was used, dynamic 3D cardiac imaging with 13N-NH3 provided accurate absolute global and regional MBF measurements, compared with those obtained by standard 2D PET, even when a lower activity (approximately 30% lower) was injected. These parameters may allow reductions in the radiation dose to the patient and potentially shorten the time delay between consecutive studies, as the activity reaches the background more rapidly. Second, iterative reconstruction algorithms that use FORE–OSEM for 3D images may be a valuable alternative to the standard 2D FBP algorithm for reconstruction in 13N-NH3 cardiac PET studies. It should be acknowledged, however, that these results are dependent on the specific parameters of the scanner, acquisition protocols, and reconstruction methods used.
CONCLUSION
For the scanner type used in the present study, quantitative measurements of MBF obtained with 3D PET and 13N-NH3 were in excellent agreement with those obtained with the 2D technique, even when a lower activity was injected.
Acknowledgments
We are grateful to the Zurich PET Center radiographers for their excellent technical assistance. This work was supported by grant PP00A-68835 from the Swiss National Science Foundation and by grant 31-68386 from the National Centres of Competence in Research (NCCR CO-ME) of the Swiss National Science Foundation. Nuclear Medicine at University Hospital Zurich receives research support from GE Healthcare.
Footnotes
-
COPYRIGHT © 2007 by the Society of Nuclear Medicine, Inc.
References
- 1.↵
- 2.
- 3.↵
- 4.↵
- 5.↵
- 6.↵
- 7.↵
- 8.↵
- 9.↵
- 10.
- 11.↵
- 12.↵
- 13.↵
- 14.↵
Schäfers KP, Spinks TJ, Camici PG, et al. Absolute quantification of myocardial blood flow with
 and 3-dimensional PET: an experimental validation. J Nucl Med. 2002;43:1031–1040.
 - 15.↵
- 16.↵
- 17.↵
- 18.↵
- 19.↵
- 20.↵
- 21.↵
- 22.
- 23.↵
- 24.↵
- 25.↵
- 26.↵
- 27.↵
- 28.↵
- 29.↵
- 30.↵


- Received for publication June 10, 2007.
- Accepted for publication August 20, 2007.


Jump to section
Related Articles
Cited By...
- Relationship Between Ktrans and K1 with Simultaneous Versus Separate MR/PET in Rabbits with VX2 Tumors
- Evaluation of a Mitochondrial Voltage Sensor, (18F-Fluoropentyl)Triphenylphosphonium Cation, in a Rat Myocardial Infarction Model
- Impaired Myocardial Flow Reserve on Rubidium-82 Positron Emission Tomography Imaging Predicts Adverse Outcomes in Patients Assessed for Myocardial Ischemia
- Challenges in the Translation of Cardiovascular Cell Therapy
- Cardiac Positron Emission Tomography