


Abstract
18F-FDG PET is an important diagnostic tool for detecting myocardial viability in patients with coronary artery disease. In combination with perfusion scanning, 18F-FDG PET allows differentiation between reversibly and irreversibly damaged myocardium and selection of patients likely to benefit from revascularization. Viability PET is usually performed in two-dimensional (2D) mode. Taking into account the rising number of three-dimensional (3D)–only scanners, a validation of 3D acquisition is required. Methods: Twenty-one patients with coronary artery disease referred for 18F-FDG PET underwent an imaging protocol of nongated 2D (2D-NG) and gated 2D (2D-G) acquisitions for 15 min each, followed by 3D gated acquisitions for 10 min (3D-10) and 5 min (3D-5), using an ECAT Exact HR+ scanner. Results were analyzed using a 20-segment polar map in terms of activity concentration (Bq/mL), viability (50% uptake threshold), regional activity distribution, visual assessment of viability based on a 3-point rating scale, and left ventricular ejection fraction. Results: Activity concentration measured in each segment with 2D-G, 3D-10, and 3D-5 showed a good linear correlation with 2D-NG. Quantitative viability assessment with 3D-5 gave a sensitivity of 84% and a specificity of 98%, compared with 2D-NG. No differences in regional activity distribution and visual viability assessment were found between the various protocols. Left ventricular ejection fractions obtained with 3D-10 and 3D-5 showed a good linear correlation with those measured with 2D-G. Conclusion: An ECG-gated 3D imaging protocol gave results comparable to those of 2D acquisition with regard to absolute and regional myocardial activity distribution, left ventricular function, and visual viability assessment. Sensitivity for viability assessment with a 50% uptake threshold was significantly less with 3D, but specificity was maintained. This protocol delivers a clinical performance nearly equivalent to that of 2D acquisition.
PET with 18F-FDG is an important diagnostic tool for detecting myocardial viability (1), particularly in patients with chronic coronary artery disease and left ventricular (LV) dysfunction (2,3). 18F-FDG PET in combination with a perfusion study allows determination of the amount of viable myocardium with potentially reversible dysfunction as well as the extent of scarring with irreversible dysfunction and thereby helps determine which patients may benefit from an invasive revascularization (4–6). With the use of electrocardiography-gated acquisition, 18F-FDG PET provides further information about global LV function, wall thickening, and regional wall motion (7,8).
Myocardial viability PET using 18F-FDG is routinely performed in two-dimensional (2D) technique. Because of the trend toward three-dimensional (3D)–only scanners, validation of 3D measurements is necessary. Compared with 2D mode, 3D acquisition offers a higher sensitivity to true coincidence events but is also more sensitive to random and scattered coincidences and events from outside the field of view (9). Depending on scanner performance, the injected activity has to be carefully adjusted to optimize the noise equivalent counting rate.
The purpose of this study was to investigate whether 3D measurement has the potential to replace the 2D technique for determining myocardial viability and whether cardiac function parameters can reliably be measured in 3D mode.
MATERIALS AND METHODS
Patients
Twenty-one patients (18 men and 3 women; mean age ± SD, 64 ± 13 y) with LV dysfunction were enrolled in this study. Sixteen patients had three-vessel coronary artery disease, 4 patients had two-vessel disease, and in 1 patient cardiomyopathy was suspected. In 16 patients, previous myocardial infarction had been documented. Five patients were diabetic. Written informed consent was obtained from all patients.
PET
All patients underwent euglycemic–hyperinsulinemic clamping in preparation for PET. An infusion of 2.3 IU of insulin and 2 mmol of potassium chloride solution in 100 mL of 10% glucose was given over 1 h. In patients with a blood glucose level > 12 mmol/L, 4–6 IU of insulin were given intravenously before insulin–glucose clamping. Halfway through the clamping, 18F-FDG was injected. The injected activity was 291 ± 75 MBq (range, 210–437 MBq). This equates to an activity per body mass at the start of 3D acquisition of 2.3 ± 0.7 MBq/kg (range, 0.7–3.7 MBq/kg). For all patients, this level was below the activity for peak 3D noise equivalent counting rate for the Siemens/CTI ECAT Exact HR+ scanner used in this study (10). Acquisition began 30 min after injection. A transmission scan was acquired for 10 min before the emission scans. Nongated 2D data (2D-NG) were acquired for 15 min, immediately followed by a 2D gated (2D-G) acquisition of 15 min and 3D gated acquisitions of 10 min (3D-10) and 5 min (3D-5). 3D-5 data could not be acquired for 3 patients who could not tolerate the additional time required for acquisition. Ring difference, span, and mash (merging of sinograms of adjacent projection angles in the transaxial direction) were set to 7, 15, and 2, respectively, for 2D acquisitions and 22, 9, and 2, respectively, for 3D acquisitions. The energy window was set to 350–650 keV. Pixel size was 2.57 × 2.57 × 2.46 mm. All datasets were corrected for attenuation and reconstructed iteratively (4 iterations; 8 ordered subsets; gauss filter; Nyquist frequency 6.0; 128 × 128 matrix; zoom of 2; offset x = 3 cm, y = 5 cm). Random and scatter correction was used as implemented by the manufacturer. Random events were measured online in a delayed coincidence time window and were subtracted online from the projection data. Scatter was corrected using a single-scatter-simulation algorithm (11). Gated acquisitions were performed using 16 frames per cardiac cycle and a heart rate acceptance window of 50–150/min.
Data Analysis
Quantitative, semiquantitative, and visual image analysis was performed by 2 independent investigators. Sinogram files of the gated data (2D-G, 3D-10, and 3D-5) were summed and reconstructed to obtain nongated images for comparison with 2D-NG. Results were analyzed using a 20-segment polar map. The activity concentration (Bq/mL) was determined for each segment. Visual analysis was based on a 3-point rating scale: 1 = viable, 2 = nontransmural scar, 3 = transmural scar. Further clinical information and angiography results were considered for visual analysis. End-systolic and end-diastolic LV volumes and LV ejection fraction (LVEF) were calculated automatically with QGS (Cedars-Sinai Medical Center), a software package that offers a quantitative, 3D analysis of cardiac function and has previously been validated for use with 18F-FDG PET (12).
Statistical Analysis
Absolute activity concentrations of each segment from 2D-G, 3D-10, and 3D-5 studies were compared with the respective values from the 2D-NG study using linear regression. The 95% confidence interval of the difference between 2 proportions was calculated using the method proposed by Newcombe (13) to determine whether sensitivity for detecting nonviable segments using an uptake threshold of 50% was significantly different between 2D-NG and the other protocols. To analyze regional activity distribution quantitatively, absolute activity concentrations measured in each segment with the 2D-G, 3D-10, and 3D-5 protocols were expressed as a ratio to the values obtained with 2D-NG. One-way ANOVA with Dunnett’s post-test was performed to examine whether mean 2D-G/2D-NG, 3D-10/2D-NG, and 3D-5/2D-NG activity ratios for each segment were different from unity. A Friedman test was used to compare the visual viability ratings of the various acquisition protocols. Linear regression was used to compare LVEF and LV volumes. Statistical analysis was performed with Prism software, version 3.03 (GraphPad Software, Inc.).
RESULTS
Count Statistics
Moving from 2D to 3D acquisition, true coincidences increased 8-fold, random coincidences 19-fold, and single events 3-fold, when results from all patients were averaged (Table 1). This increase was partially due to an increase in scanner sensitivity with our 3D acquisition protocol (increase in ring difference from 7 to 22) and resulted in a 57% lower true-to-random ratio with 3D. These results are comparable with previous evaluations of the ECAT Exact HR+ scanner (10,14).
Count Statistics for 2D and 3D Acquisitions
Absolute Activity Concentration
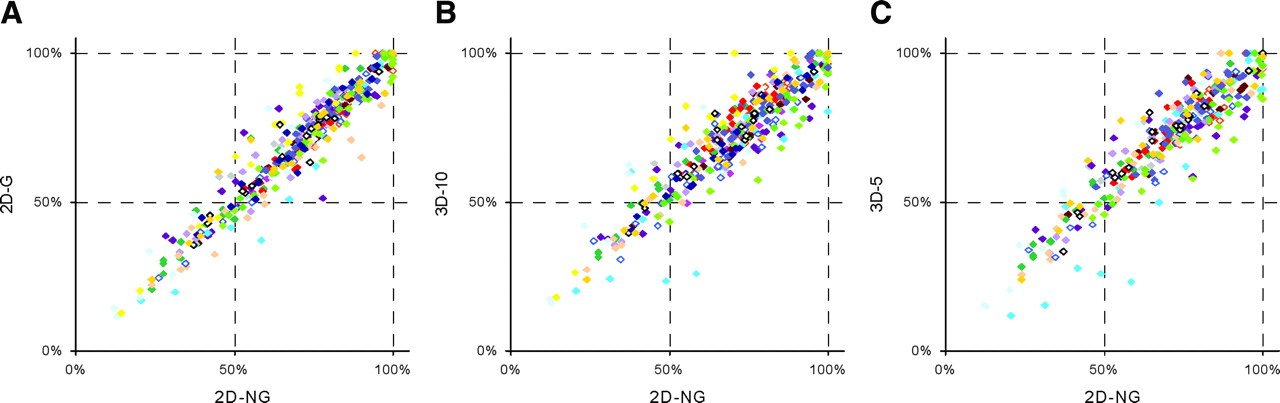
The activity concentration measured in each segment with the 2D-G, 3D-10, and 3D-5 acquisition protocols was compared with that obtained with 2D-NG acquisition. Figure 1 contains these data for all patients and shows a good linear correlation between respective protocols, except for the patient represented by a yellow dot and the patient represented by a blue dot. These patients had an unusually high myocardial uptake, although injected activity per body mass was below the recommendations for peak 3D noise equivalent counting rate for this scanner (10). Good correlation was confirmed by regression analysis (Fig. 1). Figure 2 repeats the data contained in Figure 1 based on relative activity concentration. It is immediately apparent that for viability assessment based on a 50% uptake threshold, the results varied with the various acquisition protocols for only a small number of segments (left upper and right lower quadrants), compared with the number that were correctly assessed (right upper and left lower quadrants). 2D-NG detected 62 nonviable segments. Of these, 4, 13, and 9 were identified as viable using the 2D-G, 3D-10, and 3D-5 protocols, respectively. On the other hand, these protocols defined as nonviable 10, 4, and 5 segments, respectively, that were declared viable by 2D-NG. Compared with 2D-NG, the sensitivity of 2D-G, 3D-10, and 3D-5 was 94%, 79%, and 84%, respectively, and the specificity was 97%, 99%, and 98%, respectively. The sensitivity of both 3D acquisition protocols was significantly lower than that of 2D-NG.

Absolute activity concentration (Bq/mL) measured in each segment with 2D-G (A), 3D-10 (B), and 3D-5 (C) protocols, compared with 2D-NG acquisition. Each dot represents 1 segment, and a different color represents each of the 21 patients. Corresponding residual plots are in left upper corners. Values for slope of curve and Pearson correlation coefficient were, respectively, 1.04 and 0.98 for 2D-G, 0.97 and 0.97 for 3D-10, and 0.97 and 0.96 for 3D-5.
Relative activity concentration in each segment with 2D-G (A), 3D-10 (B), and 3D-5 (C) protocols, compared with 2D-NG acquisition. Segment with maximum absolute activity concentration in each patient equals 100%. Each dot represents 1 segment, and a different color represents each of the 20 patients. One patient with hibernating myocardium confirmed by 13NH3 PET was excluded.
Regional Activity Distribution
To analyze whether the 2D-G, 3D-10, and 3D-5 protocols correctly reflect regional variations in myocardial uptake, absolute activity concentrations measured in each segment with those protocols were compared with 2D-NG. This analysis was performed for each patient, and 2 representative examples are shown in Figure 3. It is visually apparent that all 4 acquisition protocols depict the same pattern of regional variations in myocardial viability. The results of quantitative analysis of regional activity distribution are shown in Figure 4. Indeed, no significant difference was found between the 2D-G, 3D-10, or 3D-5 protocol and 2D-NG. However, a wider spread of values was observed in the apical and basal segments of the left ventricle. This finding was associated with a transmural scar in the apex in 12 of 21 patients, which made automatic contour finding less reliable and required manual contouring.
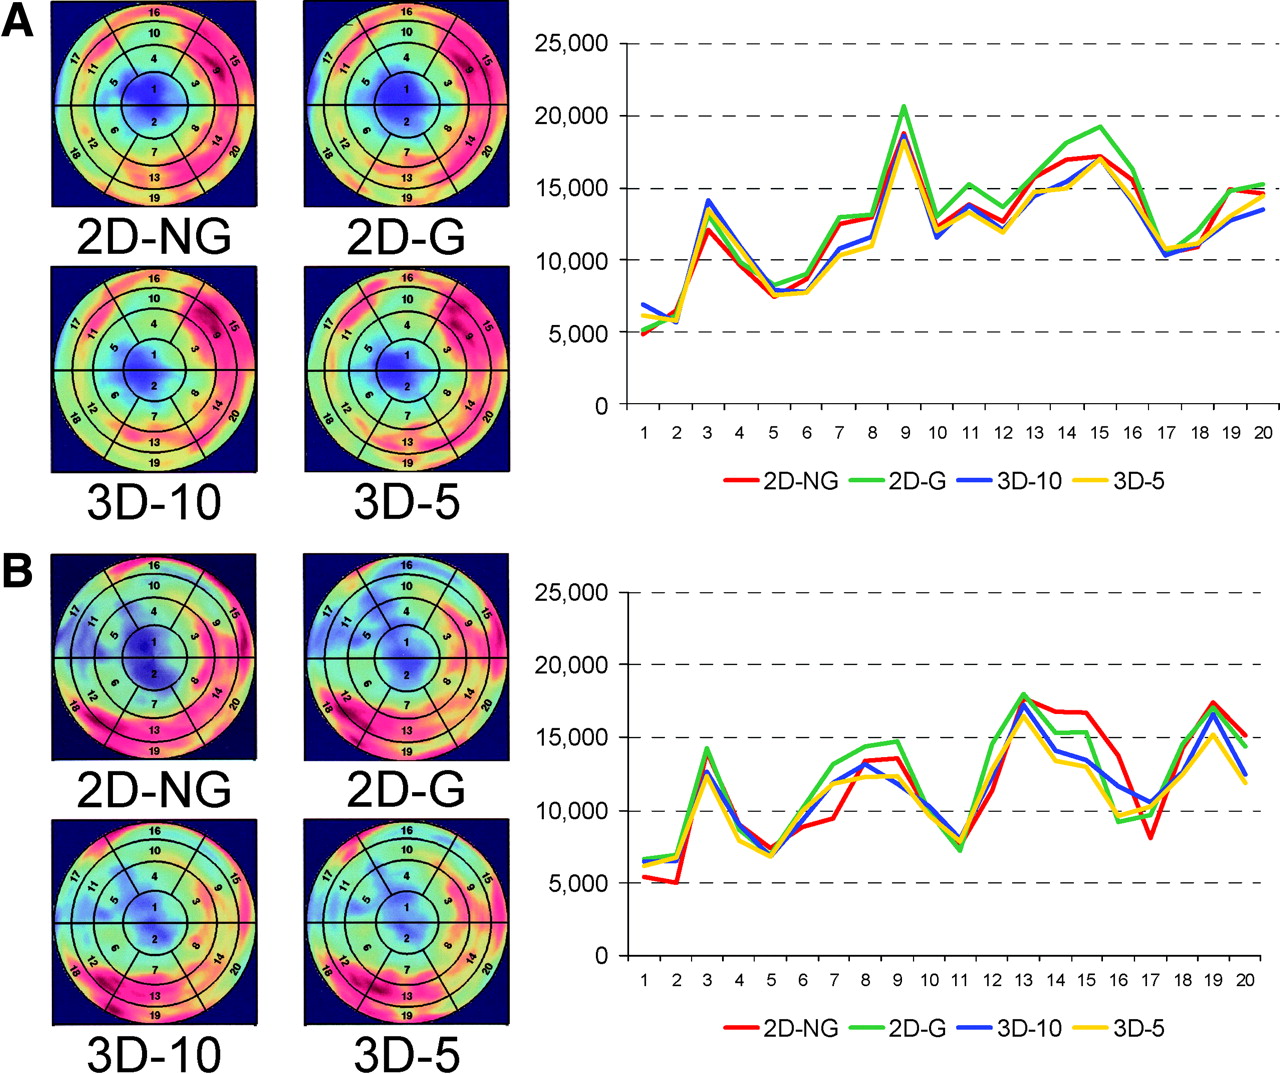
Regional variation of absolute activity concentration in each of 20 segments measured with 2D-NG, 2D-G, 3D-10, and 3D-5 protocols. Polar maps are shown for each protocol, and absolute activity concentrations (Bq/mL) have been plotted for each segment. Two representative patients (A and B) are shown.
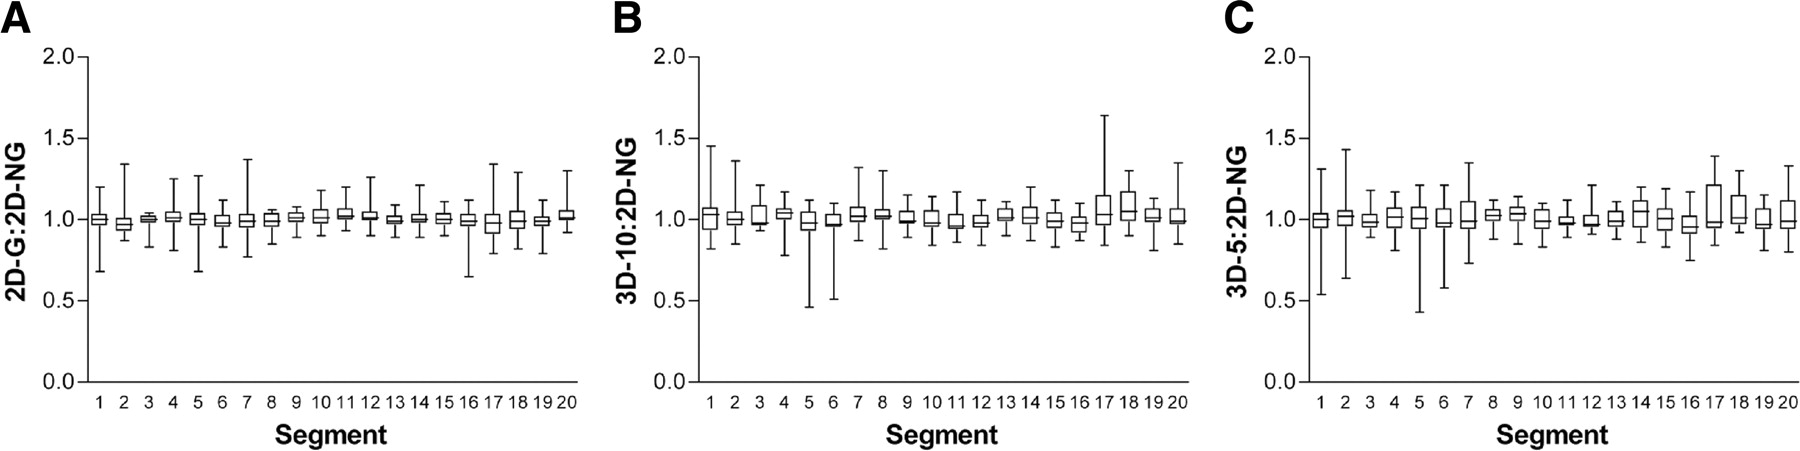
Mean regional activity distribution in all 20 segments measured with 2D-G (A), 3D-10 (B), and 3D-5 (C) protocols, expressed as a ratio to 2D-NG values.
Visual Analysis
All segments were rated on a 3-point scale (Table 2). A clinical rating different from that of 2D-NG was found in 10% of segments with 2D-G, 12% with 3D-10, and 15% with 3D-5 acquisition protocols. No significant differences were found between viability ratings obtained with the various acquisition protocols (χ2 = 2.50, df = 3, P = 0.48). When segments were grouped according to the 3 main coronary territories, as is routine for clinical reporting, visual analysis gave comparable results for the 2D-NG, 2D-G, 3D-10, and 3D-5 protocols (data not shown).
Number of Segments Showing Viable Myocardium, Nontransmural Scarring, and Transmural Scarring, as Measured with 2D-NG, 2D-G, 3D-10, and 3D-5
LV Function and Volume
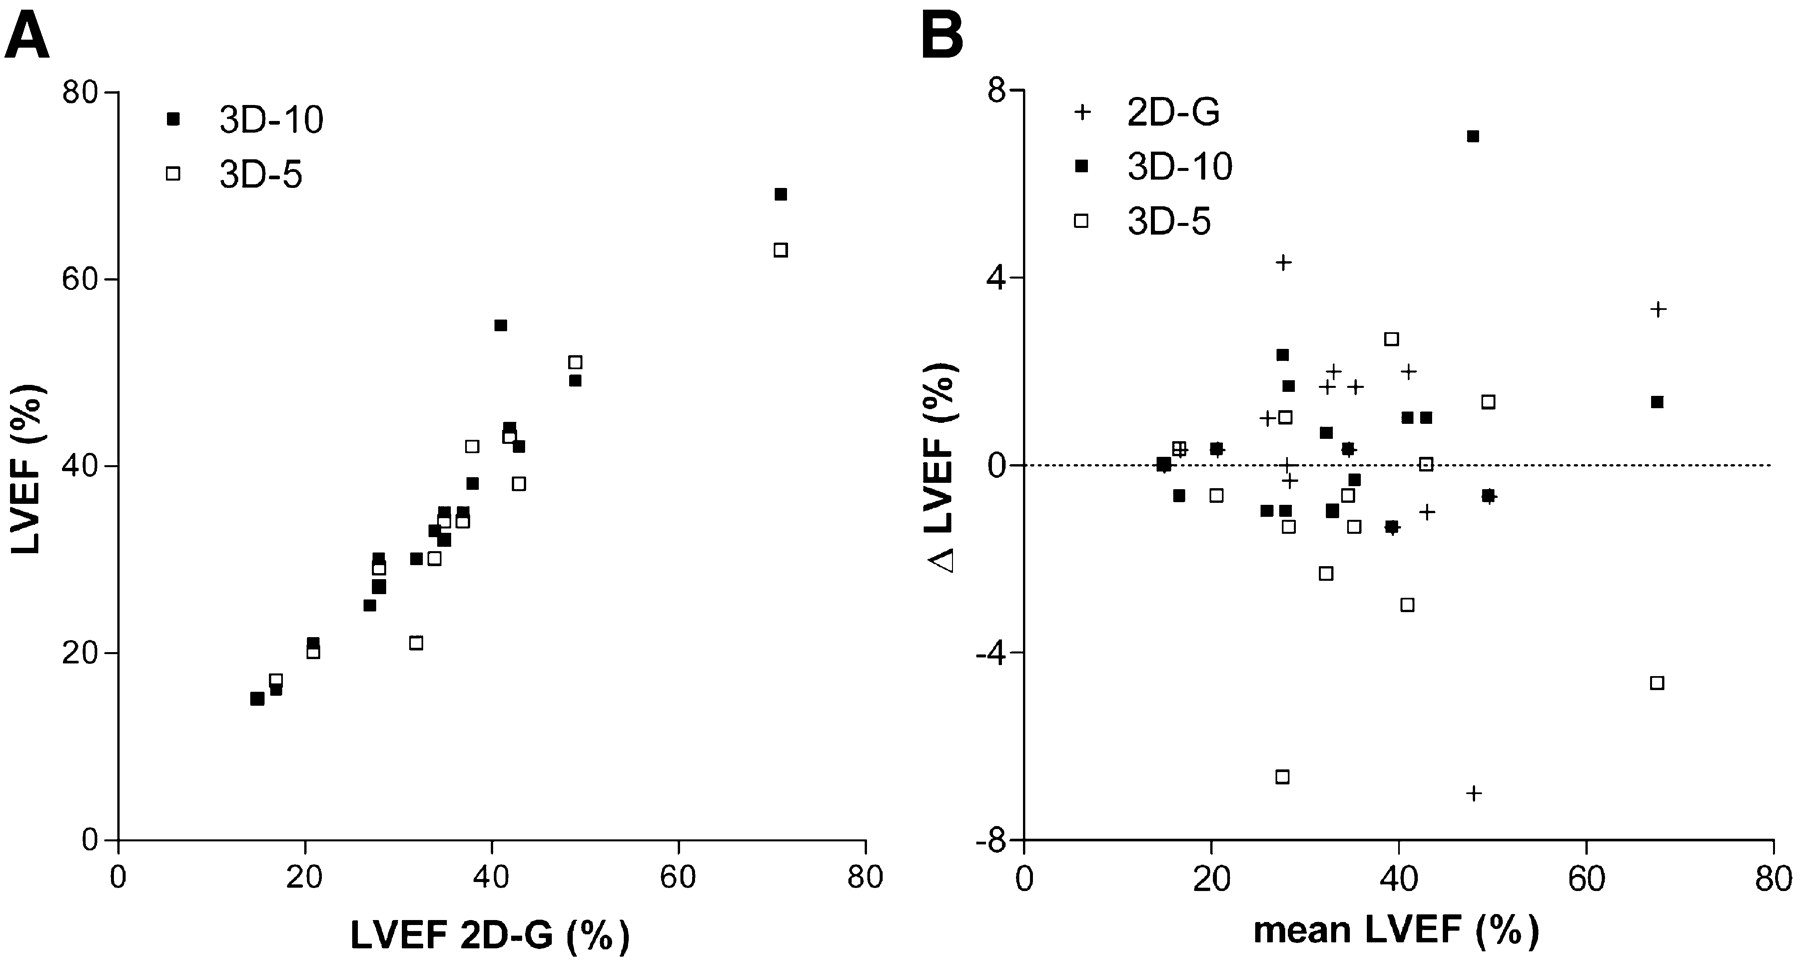
LVEF obtained with the 3 gated protocols is shown in Figure 5. Mean LVEF was 33.9% ± 13.3%, 34.0% ± 13.8%, and 33.0% ± 12.9% for 2D-G, 3D-10, and 3D-5, respectively. End-diastolic and end-systolic volumes and LVEF obtained with 3D-10 and 3D-5 showed a good linear correlation with those measured with 2D-G (Fig. 5; data for end-diastolic and end-systolic volumes not shown).

(A) Comparison of LVEF measured with 2D-G, 3D-10, and 3D-5 protocols. (B) Corresponding Bland–Altman plot. Slope of curve, {2D,3D} intercept, and Pearson correlation coefficient were 1.02, {0.4,-0.4}, and 0.96, respectively, for 3D-10 and 0.91, {-1.3,1.2}, and 0.96, respectively, for 3D-5.
DISCUSSION
Myocardial Viability PET
Revascularization, either by coronary artery bypass grafting or percutaneous transluminal coronary angioplasty, substantially benefits survival, quality of life, and cardiac events, compared with medical treatment of patients with chronic coronary artery disease (1,15–17). These benefits do, however, come with an increase in perioperative morbidity and mortality, particularly in patients with impaired LV function (2,3). There is therefore a clinical need to identify the patients most likely to benefit from revascularization (18). In 1986, Tillisch et al. demonstrated that 18F-FDG uptake is present in hibernating myocardium and is a good predictor of functional recovery after revascularization (1), as has since been confirmed by other studies (4–6). In current clinical practice, a combination of 18F-FDG PET and a perfusion study is usually applied to determine viability (19). Alternative techniques, including 201Tl SPECT (20), contrast-enhanced MRI (6), and dobutamine echocardiography (21,22), perform comparably in predicting functional recovery after revascularization (21).
3D Versus 2D Acquisition
3D acquisition seems attractive because it offers several technical advantages, mainly higher sensitivity to true coincidence events. It is, however, more sensitive to random and scattered coincidences and events from outside the field of view (9). The number of PET scanners acquiring exclusively in 3 dimensions is ever increasing, but few studies have evaluated 3D acquisition for cardiac PET. With 15O-H2O, 3D has been shown to provide reliable and accurate measurements of absolute regional myocardial blood flow (23). A comparison of 2D and 3D acquisition of 82Rb found an inferior image quality with 3D, although the scanner was operating at the limit of its counting-rate capabilities (24). Under suitably optimized conditions, noise equivalent counting rate for a given activity can be higher with 3D than 2D acquisition, allowing shorter acquisition times (10,25,26). However, this possibility strongly depends on the injected activity and the scanner characteristics. For this reason, our results cannot be applied to other imaging protocols or scanners without further validation.
Our study has demonstrated that 3D data acquisition for either 10 or 5 min gives a mean absolute activity concentration comparable to that of 2D acquisition for 15 min. Based on a 50% uptake threshold, sensitivity for the detection of viable segments decreased 6%, 21%, and 16% with 2D-G, 3D-10, and 3D-5, respectively, compared with 2D-NG, resulting in a significantly lower sensitivity for both 3D protocols. Specificity remained unchanged. This loss of sensitivity was due to an inaccurate reflection of activity in regions with low uptake. 3D images are more susceptible to degradation by randoms and scatter, and this degradation will be particularly problematic in regions with low uptake that are immediately adjacent to regions with high uptake. The problem may appear worse when a fixed uptake threshold is used for declaring a segment viable, as small changes in uptake in a large number of segments may translate into a marked loss of sensitivity. Visual viability ratings were different from 2D-NG in 10%, 12%, and 15% of segments with 2D-G, 3D-10, and 3D-5 protocols, respectively (not significant). Pagano et al. (4) reported that the best cutoff for predicting a postrevascularization increase in LVEF was viability in 8 of 16 segments. Although we do not know which acquisition protocol best reflects “true” myocardial viability, a loss of sensitivity on the order of 15%–20% or a visual misjudgment of viability in up to 15% of segments seems, therefore, unlikely to affect clinical management and outcome.
LV Function Parameters
ECG-gated 18F-FDG PET has been used to measure LVEF (27), and the result correlated well with results from X-ray left ventriculography (28), cine MRI (12), and radionuclide angiography (7), although the use of 2 different software algorithms was found to be associated with a systematic bias (7). 18F-FDG uptake correlated broadly with regional ejection fraction (29).
Our study has demonstrated that LVEF obtained with 2D acquisition for 15 min was comparable to that obtained with 3D acquisition for either 10 or 5 min. In addition, gated acquisition has the potential to improve the interpretation of a viability scan, although our investigation did not study this in detail.
Study Shortcomings
For practical reasons, our protocol used a fixed sequence starting 30 min after injection: transmission scan (10 min), 2D-NG emission scan (15 min), 2D-G emission scan (15 min), 3D-10 emission scan (10 min), and 3D-5 emission scan (5 min), giving a total emission scanning time of 45 min, with short intervals between emission scans. The ratio of myocardium activity to blood-pool activity has been shown to increase over time, resulting in better image quality at 90 min after injection than at shorter uptake times (30). This may have introduced a bias in favor of 3D data in our protocol. On the other hand, such a fixed sequence might systematically disadvantage the protocols performed last, because of the likely increase in patient movement artifacts. This increase could compromise correct colocalization of myocardial segments in the polar map to some degree and might have contributed to a less accurate determination of absolute activity concentration with the 3D-10 and 3D-5 protocols.
CONCLUSION
An ECG-gated 3D imaging protocol using 300 MBq of 18F-FDG and an ECAT Exact HR+ scanner gives results comparable to those of 2D acquisition for absolute and regional myocardial activity distribution, LV function, and visual viability assessment. Sensitivity for viability assessment with a 50% uptake threshold was significantly less with 3D, but specificity was maintained. We believe that this protocol delivers a clinical performance nearly equivalent to that of 2D acquisition.
Footnotes
Received Mar. 3, 2004; revision accepted Aug. 12, 2004.
For correspondence or reprints contact: Claudia Brogsitter, MD, Department of Nuclear Medicine, University of Dresden, Fetscherstrasse 74, 01307 Dresden, Germany.
E-mail: Claudia.Brogsitter{at}uniklinikum-dresden.de


