


Abstract
CT-based attenuation correction is a widely used option in commercial PET/CT scanners. However, as a result of a nonsimultaneous acquisition and differences in temporal resolution between both modalities, a potential misregistration between the PET and CT, especially in the thorax and the upper abdomen, can be found. We observed a substantial number of apparent perfusion defects in spatial coincidence with the misregistered segments of the heart and assumed these defects were related to an incorrect attenuation correction. The purpose of this work was to assess the clinical impact of emission–transmission misalignment in myocardial perfusion imaging with PET/CT and to investigate potential solutions. Methods: Twenty-eight coronary artery disease patients underwent PET/CT 13NH3 rest/stress examinations. The emission–transmission misalignment was corrected by manual registration and the PET studies were reconstructed again using the realigned CT images for attenuation correction. The effects of the registration were evaluated by quantitative analysis of the local tracer uptake on a polar map basis. In addition to manual registration, 2 alternative realignment methods were evaluated: mutual information–based image registration and emission-driven correction based on the outline of the heart in the PET image. Results: Manual realignment resulted in a change in the defect size of >10% of the left ventricle in 6 of 28 studies (21.4%); in 5 of the studies, this resulted in the disappearance of large apparent perfusion defects (15%–46% of the left ventricle), which were fully due to emission–transmission misregistration. Automatic image registration was unable to realign the datasets, whereas the emission-driven correction showed a good agreement with manual registration. Conclusion: Misregistration of PET and CT images is common in cardiac PET/CT studies and results in artifacts on the attenuation-corrected PET images, which appear to be corrected by repeating the PET reconstruction after manual realignment of the CT image data. In contrast to manual realignment, an automated emission-driven correction appears to be a promising approach.
Since the introduction of combined PET/CT scanners, CT has replaced external rotating sources (e.g., 68Ge or 137Cs) for the measurement of the transmission scan used to account for photon attenuation (absorption and scatter) within the body. The use of CT has several advantages: (a) the transmission scan is significantly faster, improving patient comfort and throughput; (b) CT contains much lower statistical noise; (c) the transmission scan can be acquired after injection without bias from the injected tracer; (d) it eliminates the need for periodic replacement of the external rotating sources; and (e) CT provides anatomic information that complements the functional data provided by PET.
CT has been validated for attenuation correction of cardiac images even when low tube currents are used (1). However, CT-based attenuation correction potentially suffers from a nonsimultaneous acquisition as well as differences in scanning time between PET and CT: The latter is acquired in a few seconds, covering only a fraction of the respiratory cycle, whereas PET shows an image averaged over the whole respiratory cycle. This difference has been reported to produce PET/CT misregistration in the thorax and upper abdomen, resulting in artifacts due to a biased photon attenuation correction in the misregistered regions, compromising the localization of lesions near the dome of the liver (2).
To our knowledge—and despite the fact that the heart is closely coupled with the diaphragm and, thus, shows a significant respiratory motion (3)—no studies have reported on the effects of this misregistration for cardiac PET/CT. In contrast, the problem of emission–transmission misalignment in cardiac imaging—due to pharmacologic stress, breathing, or other patient motion—has been previously investigated using PET with rotating sources (4,5), SPECT (6), and SPECT/CT (7).
In our center, several PET/CT perfusion studies had moderate-to-severe PET/CT misregistration, and we observed apparent perfusion defects in spatial coincidence with the misregistered segments. We therefore investigated whether these defects could be artifactual and originated from an incorrect attenuation correction in the presence of emission–transmission misregistration. We assumed the severe difference between the attenuation factor of the lung, where there is virtually no attenuation, and that from the heart tissue to be the underlying reason for reduced uptake in the misregistered cardiac segments.
The purpose of this study was to assess the clinical impact of emission–transmission misalignment in cardiac PET/CT and discuss possible solutions such as image registration and an emission-driven correction.
MATERIALS AND METHODS
Patient Population
Twenty-eight consecutive patients (20 men, 8 women; age, 63 ± 12 y [mean ± SD]) who were referred to our institution for evaluation of coronary artery disease were enrolled in this study. All patients had been referred for a PET/CT rest/stress perfusion study. Informed patient consent was given.
PET/CT System
Imaging was performed on a Biograph 16 PET/CT (Siemens Medical Solutions), combining a lutetium oxyorthosilicate-based ECAT ACCEL PET with improved detection electronics (Pico3D) and a 16-slice Somatom Emotion CT. The PET scanner has an axial field of view of 16.2 cm and has no septa, so that all PET data was acquired in 3-dimensional (3D) mode (8,9).
Protocol
Transmission data for the thorax were acquired with a low-dose CT scan (120 kV, 26 mA) performed in shallow breathing. After that, patients received a 300- to 500-MBq injection of 13NH3 synchronized with the start of the PET acquisition. The PET rest examination lasted for 10 min, and 30 min later pharmacologically induced stress was achieved by a 6-min infusion of adenosine at 0.16 mg/min/kg of body weight. Patients received a second 300- to 500-MBq 13NH3 injection, and the PET stress examination was acquired for 10 min. Image data from 5 to 10 min after injection were summed and used for further analysis. Both CT and PET were acquired in the arms-down position to improve patient comfort and reduce the probability of motion.
Data Processing
The acquired PET data was reconstructed using the ordered-subsets expectation-maximization (OSEM) algorithm with 4 subsets and 8 iterations. The attenuation map, image containing the attenuation factor for each voxel that is used for attenuation correction, was obtained from the CT image after the necessary transformations, including scaling from x-ray to γ-ray energy and smoothing to match PET spatial resolution (10).
To investigate whether emission–transmission misregistration was at the origin of perfusion defects, we sought to remove the misregistration by realigning the CT to the PET and repeating the PET reconstruction with the aligned CT-based attenuation map. For this purpose, a registration program was developed using IDL (Interactive Data Language; RSI Inc.), allowing 3 different possibilities to realign the PET and CT examinations: manual registration, automatic registration, and an “emission-driven” in-house–developed correction method to modify the heart outline based on the PET data. Details on each of the realignment techniques are provided in the following sections.
For each PET examination acquired, all 3 realignment techniques were applied separately. PET rest and stress scans coming from the same patient were processed independently, as motion could potentially happen in only 1 of both scans. Using each of the realigned CT-based attenuation maps, the PET raw data were reconstructed again. The tracer uptake was quantified before and after realignment by spatially sampling the left ventricle (LV) and projecting the measured activity on a polar map basis (11). The polar map was then divided in 17 segments according to the AHA17 model (12), normalized, and compared with a normal 13NH3 perfusion map. Segments where the uptake differed by >2.5 SD were considered as perfusion defects.
PET/CT Registration
In both manual and automatic PET/CT registration, motion between the PET and CT scans was approximated as being rigid and with no rotational component—that is, registration was limited to a translation between both datasets in all 3 spatial directions.
Manual registration was done by interactively moving the CT image over the PET image and assessing the overlap in fused PET/CT images from coronal, sagittal, and transaxial views. Careful manual registration required 30–60 s for a PET/CT dataset.
We implemented the automatic registration using normalized mutual information as the similarity measure (13)—that is, as the indicator of the similarity between both images in the evaluated position. The principle of automatic image registration is to find the spatial transformation between both images providing the highest value for the similarity measure, and it is commonly achieved through the maximization of the similarity measure using an optimization algorithm. However, the most simple and robust algorithm—although the one that is by far the most computationally expensive—is to do an exhaustive search throughout all transformation parameters, checking all possible spatial transformations to find the one providing the highest similarity measure. The advantage of such an approach is that the algorithm will not stop in the presence of local maxima, so that the absolute maximum of the function is going to be found in all cases. As our transformation was approximated to be purely translational, and with the additional assumption that the displacement in each direction could be no larger than 3 cm, registration using an exhaustive search required a run time of approximately 20 s for each PET/CT dataset.
Emission-Driven Correction
The emission-driven correction is an in-house–developed method based on the following assumption: If there is tracer uptake corresponding to the LV on the PET image, the corresponding voxel in the CT should contain cardiac tissue as well. However, in case there is an inconsistency and the voxel contains lung tissue and, therefore, nearly no attenuation, the value of the voxel is modified to match that of cardiac tissue.
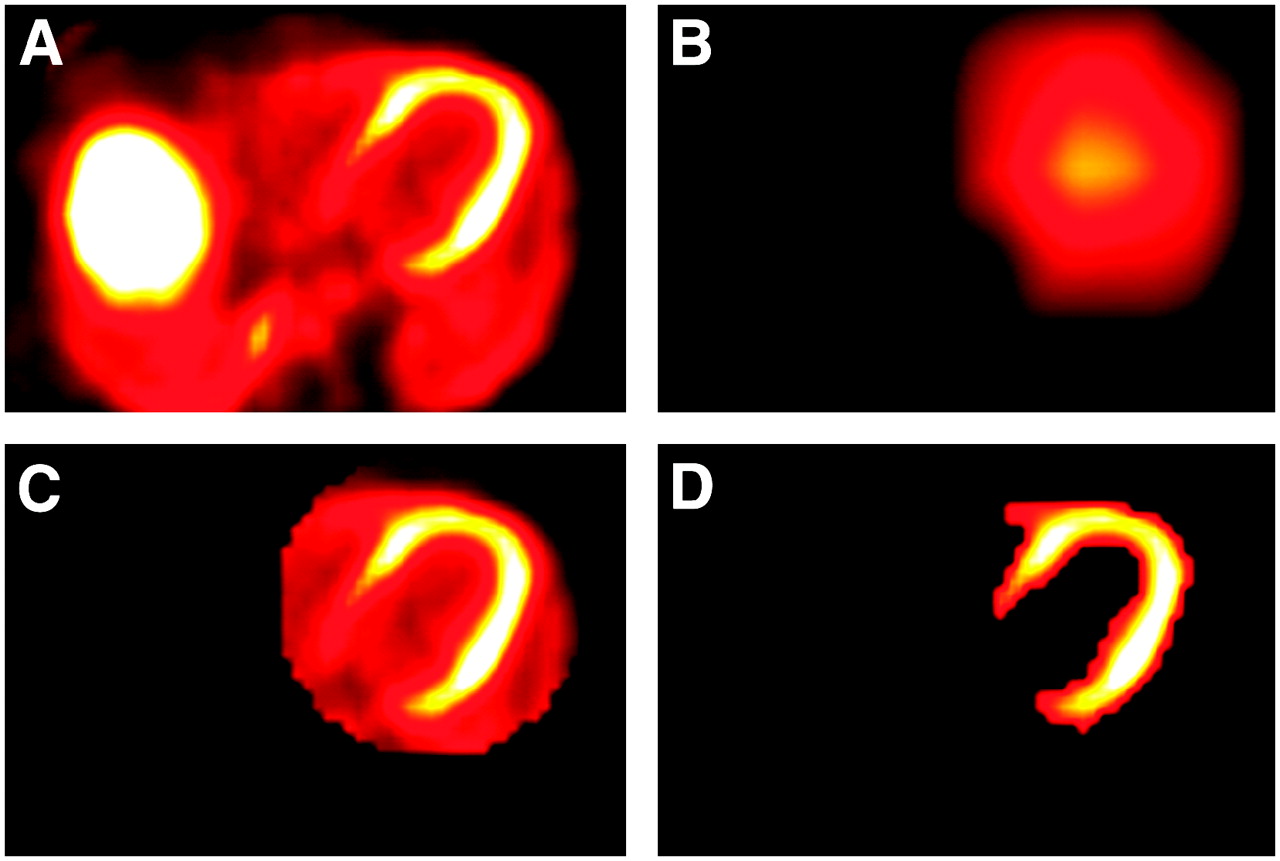
As this operation was only to be applied in the LV, a fully automatic segmentation of the LV from the PET scan was required. The LV always has high 13NH3 uptake, but a simple histogram thresholding for the whole volume would have failed as other organs in the same bed position—for example, the liver–may show higher uptake (Fig. 1A). The assumption that the heart is located on the left side of the patient made it possible to discard half of the image. Furthermore, an a priori knowledge of the acquisition was used: The bed position used for cardiac imaging was always selected so that the LV is located in the central transaxial slice, corresponding to plane 23 of 47 in our scanner. A strong smoothing filter (boxcar average, 90 mm) was applied to this plane (Fig. 1B), so that the maximum value contained in it after the application of the filter was roughly the spatial center of the LV. A 3D ellipsoid approximating the shape of the LV (but slightly larger) was automatically defined around this point, and a binary mask was used to exclude all voxels outside of this ellipsoid (Fig. 1C). As the location of the LV was now defined, a local histogram thresholding within this area was able to classify the voxels as belonging or not belonging to the LV (Fig. 1D).

Segmentation of LV used by emission-driven algorithm. (A) Central transaxial plane of initial PET image. (B) Image after masking left side and applying a strong smoothing filter; spatial center of the LV is assumed to be roughly the point with maximum intensity in image. (C) 3D ellipsoid defined around spatial center; 3D ellipsoid is a circle in each transaxial plane. (D) Segmentation results after histogram thresholding within ellipsoid.
After the segmentation, the proposed correction was as follows: If a voxel was classified as belonging to the LV on the PET image, we tested whether the CT-based attenuation factor corresponded to heart tissue (i.e., if it was higher than 0.095 cm−1, assuming 0.1 cm−1 is the reference cardiac tissue attenuation factor). If the attenuation factor was lower, it was replaced by the average cardiac attenuation factor from all other voxels classified as belonging to the LV.
The segmentation and modification of the attenuation map required <1-s run time using a standard personal computer. Although the focus of this study was rest/stress 13NH3 perfusion examinations, the emission-driven correction could be applied to most tracers used in cardiac PET/CT, such as 18FDG and 82Rb, with the only condition that the LV can be segmented out of the PET data.
RESULTS
Manual Registration
The misalignment between the PET and CT datasets was quantified after manual registration using the Euclidian distance between the original and the registered pose—that is, as the square root of the sum of the misalignments in each individual direction. The misalignment averaged 6.1 ± 7.0 mm for the 28 rest acquisitions and 6.0 ± 5.6 mm for the 28 stress acquisitions, revealing that the extent of observed misalignment is not increased despite the pharmacologic stress and the delay in the acquisition.
The spatial distribution of the motion for all 56 examinations was as follows: left–right, 1.3 ± 2.2 mm (range, 0–5.1 mm); anterior–posterior, 1.6 ± 2.9 mm (range, 0–15.4 mm); head–feet, 4.7 ± 6.1 mm (range, 0–23.6 mm). Head–feet motion represented the major component of the misalignment, in agreement with the main direction of the breathing motion. The maximum value of the misalignment for an examination was 29 mm.
Figure 2 shows the distribution of the misalignment according to its magnitude, as well as the changes in measured tracer uptake and defect size observed after reconstruction with the manually registered CT for attenuation correction. The registration had noticeable effects when the misalignment was >6 mm, which occurred in half of the examinations. When the misalignment was >8 mm (29% of the scans), the effects on the tracer uptake were severe, resulting in notable changes of the defect size (average, 6.7% LV) assessed by comparison with a normal 13NH3 database.
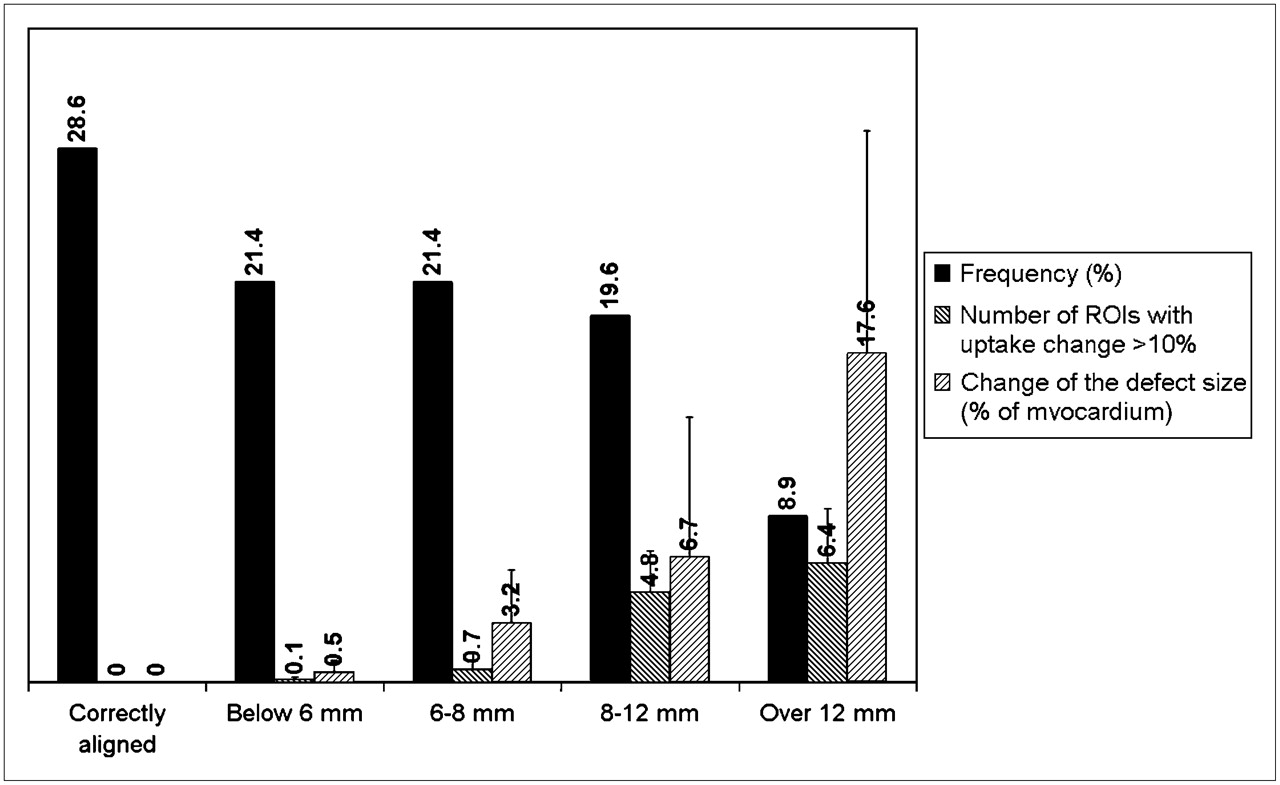
Classification of 56 scans according to degree of misalignment. For each group, 2 parameters indicating effects resulting from manual registration are shown: the average number of segments from the AHA17 model that incurred an uptake change of >10% and the change in defect size in percentage of myocardium.
The mean local differences of normalized uptake between the original studies and the studies after manual registration are shown in Figure 3A. Significant differences were observed in the anterior and anterolateral segments, suggesting that a bias due to misregistration could exist in PET/CT perfusion studies, showing up as slightly reduced uptake in these segments.
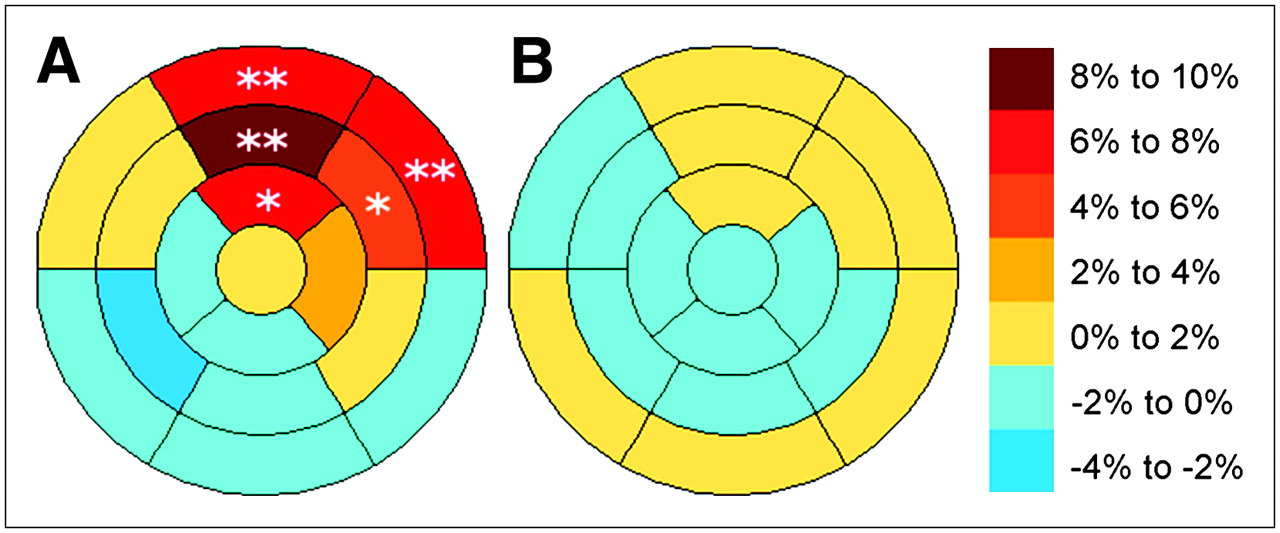
Mean differences in normalized uptake: (A) between studies with and without manual registration and (B) between studies with manual registration and with emission-driven correction. *P < 0.10; **P < 0.05.
The defect size of 6 of 28 patients (21.4%) changed by >10% LV in either the rest or the stress examinations, all of them after a manual realignment of >10 mm. Of these 6 patients, 4 had a defect (15%–46% LV) located in the anterior or anterolateral segment, which was completely artifactual and disappeared after reconstruction with the realigned CT, 1 patient had an artifactual defect (15% LV) in the inferoapical wall, and another patient had an increase in size (by 13% LV) of a septal perfusion defect induced by the registration. This was the only case where the correction resulted in a modest increase of the defect size.
Automatic Registration
Two different approaches were investigated: When the registration was applied to the complete dataset, the initial PET/CT pose was considered to be optimal by the registration algorithm, as the voxels from the body in the PET and CT images were sufficiently aligned. In other words, the registration algorithm does not improve the cardiac registration when applied to the complete dataset, as the effects of a misaligned heart are technically compensated by a reasonably well-aligned thorax. Subsequently, we tested a more regional approach focusing on the cardiac structures only by manually defining a volume of interest around the heart and removing all other surrounding structures. Unfortunately, this approach also did not produce the desired result, as the low correlation between the functional (only LV) and anatomic images (atria, ventricles, blood) in the heart made mutual information incapable of properly assessing the similarity between both datasets in the evaluated positions.
Emission-Driven Algorithm
Figure 4 shows the comparison between the variation of measured uptake produced by the emission-driven algorithm and by manual registration. Because of the reduced size of the regions considered in the AHA17 model, some local differences were observed. The correlation between both methods was high (R2 = 0.74, P < 0.001), and good agreement was seen for large misregistration-induced defects. Mean local differences in uptake between the studies corrected by manual registration and by the emission-driven algorithm were all nonsignificant and were within a 2% interval (Fig. 3B), indicating good agreement between both approaches. Figure 5 shows an example of the emission-driven correction compared with manual registration for a patient with a severe misalignment.

Comparison between correction methods. (A) Regression plot between variation of local measured uptake (in percentage of original uptake) introduced by manual realignment (Man Reg) and by emission-driven (Em Dr) algorithm. Each point corresponds to 1 segment of the AHA17 model from perfusion examination of 1 patient. Regression line (solid line) and line of equality (dotted line) are shown. (B) Difference in correction plotted against their average (Bland–Altman plot), with mean difference (dashed line) and 1.96-SD intervals (dotted line).
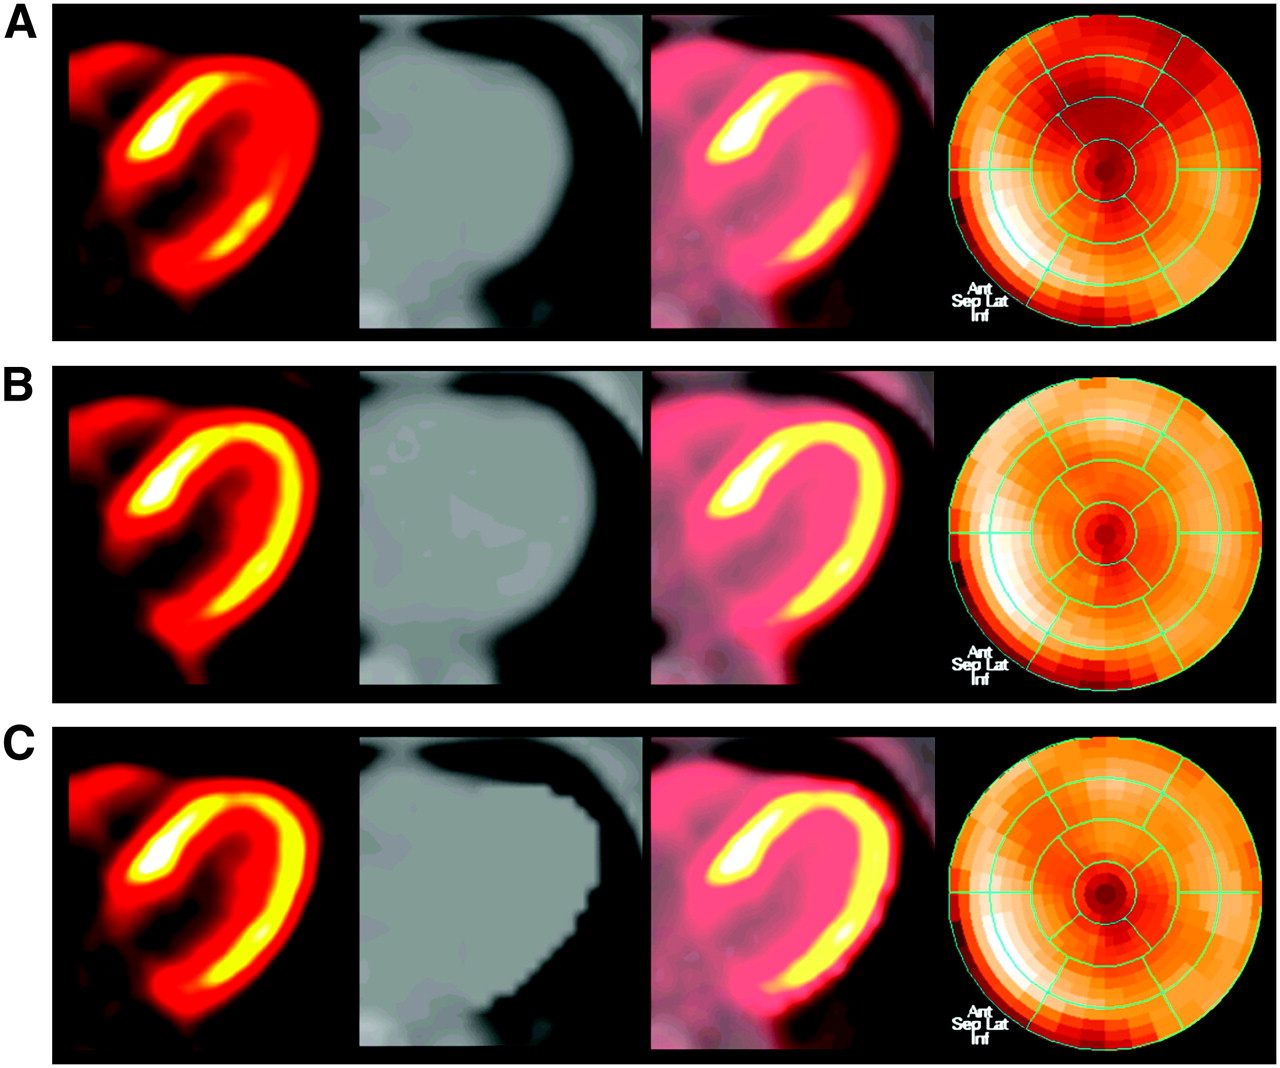
Study with PET/CT misregistration of 11 mm. Columns from left to right: PET, CT, fused PET/CT, and polar map. From top to bottom: (A) Original study. (B) Study after manual registration and reconstruction using coregistered attenuation map. (C) Study after emission-driven correction and reconstruction using modified attenuation map. Undercorrection for attenuation in anteroapical and anterolateral segments produced reduced apparent uptake and was assessed as a perfusion defect (24% of myocardium) after comparison with a normal database. Both correction methods had comparable results, recovering uptake in these segments and demonstrating that defect was completely artifactual.
One theoretic limitation of the emission-driven algorithm—although not observed in this study—is as follows: For a severe perfusion defect located in a misaligned area, the uptake would probably be so low that the segmentation would not identify it as cardiac tissue and would, therefore, not perform any correction for this area—that is, the emission-driven algorithm would preserve this area as it initially was in the original study, where the misregistered perfusion defect would likely appear more intense than it really is. This limitation is related to the segmentation step of the algorithm, which is currently based on thresholding of the image intensity. Improvements of the segmentation step by spatial constraints, model-based segmentation, or use of the tracer dynamics of the myocardium could help overcome it.
DISCUSSION
The results indicate that, despite the use of combined PET/CT hardware, emission–transmission misregistration occurs frequently in perfusion studies using PET/CT. Changes in the defect size of >10% of the myocardium were observed in 6 of 28 patients (21.4%), in 5 of these patients being fully artifactual defects which disappeared completely after coregistration, results which are in agreement with previous studies (4).
The misregistration had larger effects in the anterior and anterolateral segments, producing a significant reduction in measured uptake in these areas. This supports our hypothesis that the severe difference in the attenuation factor of cardiac and lung tissue (0.1 cm−1 vs. 0.02 cm−1) could be the core reason for the changes in measured uptake: Indeed, the anterior and lateral segments have the largest common surface with the lungs, whereas the septal and inferior walls are in contact with other soft tissue (right ventricle, liver, etc.), so that a misalignment will produce only minor changes in the attenuation factors for these segments.
PET/CT misregistration can be minimized during acquisition with optimized protocols where patient comfort is maximized (e.g., arms-down acquisition, short protocols) and with adapted breathing protocols (14,15). Despite these precautions, which were already adopted in our study, misalignment can still be present and needs to be corrected. A possible approach is to modify the CT acquisition protocol to reduce its temporal resolution to match that of the PET examination. Proposed implementations include using an ultra slow acquisition (16) or respiration-averaged CT (17). These approaches can indeed minimize the breathing-induced misalignment at the expense of increased radiation dose for the patient or longer acquisition times. However, misalignment resulting from other sources (e.g., patient motion or changes of the heart location due to pharmacologic stress agents) will still not be corrected.
One strategy we investigated in our center was the analysis of the misalignment immediately after reconstruction of the PET images—while the patient was still lying on the bed—to perform a second ultra low-dose CT (80 kV, 13 mA) if a moderate-to-severe misalignment was detected. This approach was not convenient for the regular workflow and increased slightly the radiation dose received by the patient. Moreover, the second CT scan could potentially present misalignment as well.
Image registration appears to be a promising solution. Although automatic registration has been reported to provide satisfactory results for whole-body PET/CT registration (18), we obtained disappointing results for the cardiac region. Manual registration is a solid option, with the inconvenience of being time-consuming and observer dependent. In contrast to manual registration, the proposed emission-driven correction has the advantages of being fast and fully automatic—therefore, having a high potential for clinical routine application. Its application yielded results comparable with those achieved by manual registration. However, patients showing large perfusion defects in severely misregistered areas could represent a weakness of this approach as compared with manual registration.
A limitation of this study is the lack of a gold standard to confirm that the defects that disappeared after PET/CT registration were artifactual defects and not real perfusion defects. The primary motivation for this study was the observation that rest/stress studies presenting moderate-to-severe emission–transmission misregistration had apparent perfusion defects in spatial coincidence with the misregistered segments. This, combined with the conclusions from previous works, which observed significant changes of local uptake after a simulated emission–transmission misalignment in PET and SPECT (5,6), made us confident that the apparent defects were due to the observed misregistration. The fact that the defects disappeared completely after manual registration by an expert firmly supported the hypothesis that the defects were artifactual and were due to a biased attenuation correction.
CONCLUSION
Emission–transmission misalignment occurs frequently in cardiac perfusion studies using PET/CT and can create artifacts on the attenuation-corrected PET images, which primarily show up as false-positive defects in the anterior and anterolateral segments. The artifacts appear to be removed by repeating PET reconstruction after manual realignment of the CT image data. Alternatively, an automated emission-driven correction appears to be a promising approach, which, however, needs evaluation in a larger study population.
Acknowledgments
This project was supported in part by a research grant from Siemens Medical Solutions, Chicago, IL.
Footnotes
-
COPYRIGHT © 2007 by the Society of Nuclear Medicine, Inc.
References
- Received for publication September 20, 2006.
- Accepted for publication November 3, 2006.


Jump to section
Related Articles
Cited By...
- Value of SiPM PET in myocardial perfusion imaging using Rubidium-82
- The Effect of Misregistration Between CT-Attenuation and PET-Emission Images in 13N-Ammonia Myocardial PET/CT
- Motion Correction of 18F-NaF PET for Imaging Coronary Atherosclerotic Plaques
- Hybrid PET/MR Imaging of the Heart: Potential, Initial Experiences, and Future Prospects
- Cardiac PET/CT Misregistration Causes Significant Changes in Estimated Myocardial Blood Flow
- Workflow and Scan Protocol Considerations for Integrated Whole-Body PET/MRI in Oncology
- Characterization of a Perirectal Artifact in 18F-FDG PET/CT
- Single-Phase CT Aligned to Gated PET for Respiratory Motion Correction in Cardiac PET/CT
- Low-Dose Quantitative Myocardial Blood Flow Imaging Using 15O-Water and PET Without Attenuation Correction
- Decreased Perfusion in the Lateral Wall of the Left Ventricle in PET/CT Studies with 13N-Ammonia: Evaluation in Healthy Adults
- Directions and Magnitudes of Misregistration of CT Attenuation-Corrected Myocardial Perfusion Studies: Incidence, Impact on Image Quality, and Guidance for Reregistration
- Cardiac Positron Emission Tomography
- Tissue Classification as a Potential Approach for Attenuation Correction in Whole-Body PET/MRI: Evaluation with PET/CT Data
- Comparison of Myocardial Perfusion 82Rb PET Performed with CT- and Transmission CT-Based Attenuation Correction
- SPECT/CT
- Cardiovascular nuclear imaging: from perfusion to molecular function
- Reducing Radiation Dose in Rest-Stress Cardiac PET/CT by Single Poststress Cine CT for Attenuation Correction: Quantitative Validation
- Frequent Diagnostic Errors in Cardiac PET/CT Due to Misregistration of CT Attenuation and Emission PET Images: A Definitive Analysis of Causes, Consequences, and Corrections
- Attenuation Correction in Myocardial Perfusion SPECT/CT: Effects of Misregistration and Value of Reregistration