


Abstract
CT-based attenuation correction (AC) for myocardial perfusion PET studies is challenging because of respiratory motion. Our study aimed to compare the transmission CT (TCT)–based and CT-based AC for myocardial perfusion PET/CT images with a direct semiquantitative approach comparing differences in segmental count distribution. Methods: Stress and rest 82Rb PET scans from 54 consecutive patients acquired on a PET/CT scanner with dual CT-based and TCT-based AC were considered. TCT- and CT-based AC images were automatically registered to each other, and direct voxel-based and American Heart Association segment–based estimation of positive and negative changes between these scans was performed. Additionally, visual quality control (QC) of CT map alignment with PET emission data was performed by 2 expert observers, and studies with significant (≥5 mm) misalignment were reprocessed with corrected CT alignment. Results: We used the 17-segment American Heart Association model for TCT-to-CT regional change analysis in all patients and found that 4 segments on rest and 4 segments on stress scans differed more than 3% between CT- and TCT-corrected images for studies without significant misalignments (<5 mm); only 1 differed by more than 5%. In cases with significant misalignment of greater than or equal to 3% TCT–CT AC, changes were observed on 14 rest and 10 stress segments; after alignment, these differences were still seen in 13 rest segments and 11 stress segments. Visual QC revealed that 46% of rest and 54% of stress PET scans were misaligned by greater than or equal to 5 mm with the CT maps acquired during normal breathing. The range of the reported PET/CT misalignment was 0–15 mm in x, 0–16 mm in y, and 0–20 mm in z directions. The overall agreement in visual QC of PET/CT alignment between the observers was 72.2% Conclusion: There are significant differences between TCT and CT AC applied to cardiac PET/CT studies, which remain after alignment of CT maps to emission data.
Myocardial perfusion PET is an established cardiac modality that is regarded as more accurate than SPECT in the diagnosis of coronary artery disease (CAD) (1). A key strength of PET, compared with SPECT, that is reflected in better diagnostic performance is the availability of accurate attenuation correction (AC), which has been traditionally performed with transmission sources. However, with the evolution of PET/CT in the oncologic arena (2), most PET scanners are currently sold in the hybrid PET/CT configuration, in which the CT-based AC has replaced the traditional transmission CT (TCT)–based AC technique. A low-dose CT-based AC has been proposed instead of the TCT-based approach for PET (3). None of the PET/CT systems offered today allows for TCT-based AC.
CT-based AC for PET studies has proven challenging because of the effects of possible respiratory motion in general (4) and for myocardial perfusion studies more specifically (5,6). To date, regional perfusion differences between TCT- and CT-based AC have not been directly compared for the same myocardial perfusion images. One of the key elements of myocardial perfusion imaging is the semiquantitative analysis of perfusion with normal limits, which is sensitive to small regional changes. It is important to understand the differences between TCT- and CT-based AC, because any differences will have implications for the selection of normal limits in perfusion quantification. In this study, we aimed to perform a detailed, semiquantitative comparison of these 2 AC techniques by applying them to the same rest–stress 82Rb PET studies on a PET/CT scanner on which both of these AC methods are available.
MATERIALS AND METHODS
The overall study population consisted of 34 consecutive male and 20 consecutive female patients who underwent rest–adenosine stress 82Rb PET/CT studies, performed at the Cedars-Sinai Department of Imaging between September 2005 and November 2006 on the hybrid PET/CT scanner equipped with both CT and TCT AC systems and for which all the data were available. The retrospective use of clinical data in this study was approved by the Institutional Review Board at Cedars-Sinai. Some studies had not saved the CT maps that were needed to verify the realignment, and some had not saved the raw images that were required for the reconstruction. Therefore, it was possible to perform all of the analysis required in this study from the raw data for only 54 patients (108 stress and rest scans). The average age of these patients was 68 ± 10.5 y, the average weight was 80 ± 22 kg (176 ± 48 lbs), and the average body mass index was 27.8 ± 5.5. The studies were performed only once a week on a PET/CT scanner equipped with both TCT and CT correction systems, and therefore the studies took a relatively long time to accumulate.
Acquisition and Reconstruction Protocols
PET/CT Acquisition.
All patients underwent a rest–stress 82Rb PET/CT study. Images were acquired in 3-dimensional mode on a 16-slice PET/CT scanner (Gemini; Philips), equipped with both CT-based correction and 137Cs TCT–based correction. The overview of the protocol used is presented in Figure 1. Patients were studied after 24 h of abstinence from caffeinated drinks. AC maps were obtained from both the TCT images and the CT images. AC was performed separately for stress and rest images to avoid misregistration due to exercise-induced diaphragm position changes (7). Patients were instructed to breathe shallowly for the duration of the scan, as reported in previous studies (8). After a 5-s CT scout acquisition with 120 kVp, the 137Cs TCT scan was performed (1 emission bed position requiring 3 overlapping field-of-view TCT scans of 23 s each) and was followed immediately by the CT scan for AC. The CT scan was acquired in a nongated mode, during shallow breathing (9). Image-acquisition parameters were as follows: scan length, 180 mm; collimation, 16 × 0.75; slice thickness, 3 mm; total scan time, 14 s; pitch, 0.9; rotation time, 0.75 s; tube voltage, 120 kVp; tube current, 30 mAs/slice; and patient dose, 2.3 mGy.

Protocol for cardiac rest–stress 82Rb PET/CT study with CT-based and TCT-based AC. Total imaging time is approximately 23 min.
Subsequently, rest PET images were acquired, typically 2 min after injection of 82Rb (1,295 MBq [35 mCi]) to allow for blood-pool clearance. The scan lasted approximately 4 min. After completion of the rest 82Rb scan, patients underwent a stress protocol and were injected with a second 82Rb dose (1,110–1,295 MBq [30–35 mCi]) 2 min after the pharmacologic stress agent was injected, the suggested effective amount of time to wait (10). A second (stress) set of TCT and CT AC scans was obtained for the correction of the stress images immediately after stress scans, as recommended (8). The total (stress–rest) acquisition time was approximately 25 min.
Adenosine PET Protocol.
Adenosine was infused at 140 μg/kg/min for 5 min. At the end of the second minute, 82Rb (1,110–1,295 MBq [30–35 mCi]) was injected; stress PET acquisition was started approximately 120 s later.
PET Image Reconstruction.
Acquisition was obtained in list mode. The first step in the reconstruction was the sorting of the list-mode data. Images were then reconstructed in both ungated and gated formats (8 bins) with a 3-dimensional row-action maximum-likelihood algorithm according to the vendor's reconstruction software (version 9.1; 3D RAMLA), using 1 iteration and a relaxation parameter of 0.045. These parameters were optimized to provide the best visual image quality for the clinical cardiac PET scan reading. Decay, scatter, and random corrections for both TCT- and CT-based reconstruction were applied. AC was applied to nongated images using CT maps with rescaled AC coefficients to correct for the differences in CT and PET photon energies. This correction was performed using the vendor's software by combined piecewise linear approximation and segmentation (11). TCT AC used the segmented approach and 0.095 1/cm attenuation coefficient. No manual short-axis reorientation was performed. Original transverse images with TCT- and CT-based AC were transferred for automated processing, visual quality control (QC) of alignment, and perfusion change analysis to a stand-alone PC equipped with Cedars-Sinai QPET software. In this comparative analysis, gated 82Rb reconstructions were not used.
Image Quantification.
Semiquantitative pixel-by-pixel comparison of images corrected with TCT and CT AC maps was performed with a direct-change quantification approach, available in the QPET software (12). Summarizing briefly, change analysis included automated image registration of TCT-corrected and CT-corrected PET scans and direct voxel-by-voxel subtraction of these images after iterative normalization of counts. The same left ventricular contours derived from the first (TCT-based) scan were used for both datasets (CT- and TCT-corrected). No reference databases were used in this comparison, and the changes are represented as the normalized perfusion count differences (positive or negative) obtained as previously described (12) for stress–rest changes, applied here to measure changes between CT- and TCT-corrected images and integrated over a given segment. Both global TCT–CT changes and regional changes in a 17-segment model were computed. All results were automatically derived. In 9 patients (18 studies), the contours needed to be adjusted before the change analysis was applied.
Visual QC of PET/CT Alignment.
QPET software was used to perform initial internal PET/CT fusion alignment, taking into account the 3-dimensional-position parameters of PET and CT scanners contained in the DICOM header. The alignment of PET and CT in the absence of motion was verified initially by a separate QC scan of the thoracic phantom with 18F-FDG in the myocardium to verify that the PET and CT scans of the phantom did show misalignment in the QPET software. This was done to verify PET/CT fusion software used later for alignment in patient studies.
Two expert observers, unaware of any of the results of the comparisons, independently verified the alignment of CT images with emission PET data, using the fusion capability of the QPET software. Data were reviewed in all planes using a multiplanar (sagittal, coronal, and transverse) display of PET, CT, and fused PET/CT data. Experts were able to adjust the window and level settings on the CT scanner and adjust α-blending between PET and CT before adjusting the position. Roving window display (an interactive superimposition of a portion of the PET image on the CT image) was also used in all cases to judge the misalignment. The users were asked to judge the misalignment subjectively by grading it on a 0–2 (correct–incorrect) scale. If an incorrect misalignment was identified, the observers performed a visual alignment in 3 dimensions, adjusting x, y, and z shifts to measure quantitatively the misalignment between PET and CT data. To resolve the differences between 2 observers for the misalignment correction, these results were verified by a third observer, and one final x, y, and z misalignment was assigned for each case. If a significant misalignment was noted (total 3-dimensional alignment distance ≥ 5 mm), the studies were reconstructed again by realigning the CT map and then performing the reconstruction of the emission data with the newly aligned map. Additionally, all 108 transmission–emission pairs were independently evaluated for misalignment in a similar fashion, using fusion display and outer-body contours as anatomic landmarks.
Statistical Analysis.
All continuous variables are expressed as mean ± 1 SD. Paired t tests were used to compare differences in paired continuous data, and McNemar tests were used to compare differences in paired discrete data. For unpaired continuous data, 1-way ANOVA was used. All statistical tests were 2-tailed, and a P value of less than 0.05 was considered significant.
RESULTS
Quantification of Differences
In Figure 2, we used the 17-segment American Heart Association model to show the average changes between TCT and CT for stress and rest studies in which alignment is within 5 mm or less. A total of 4 segments on rest and 4 segments on stress scans differed by more than 3% between CT- and TCT-corrected images for studies without significant misalignments, and only 1 segment was different by more than 5%. We show changes between TCT and CT for stress and rest for the studies in which misalignment was considered 5 mm or more, for both before (Fig. 3A) and after (Fig. 3B) CT alignment correction. Prealignment differences greater than 3% were observed on 14 rest and 10 stress segments, and postalignment differences were still seen in 13 rest segments and 11 stress segments. In addition, 3 segments on rest and 2 on stress differed on average by more than 5% after misalignment correction. In cases with significant motion observed, the anteroapical segment shows the greatest change, even after misalignment correction.
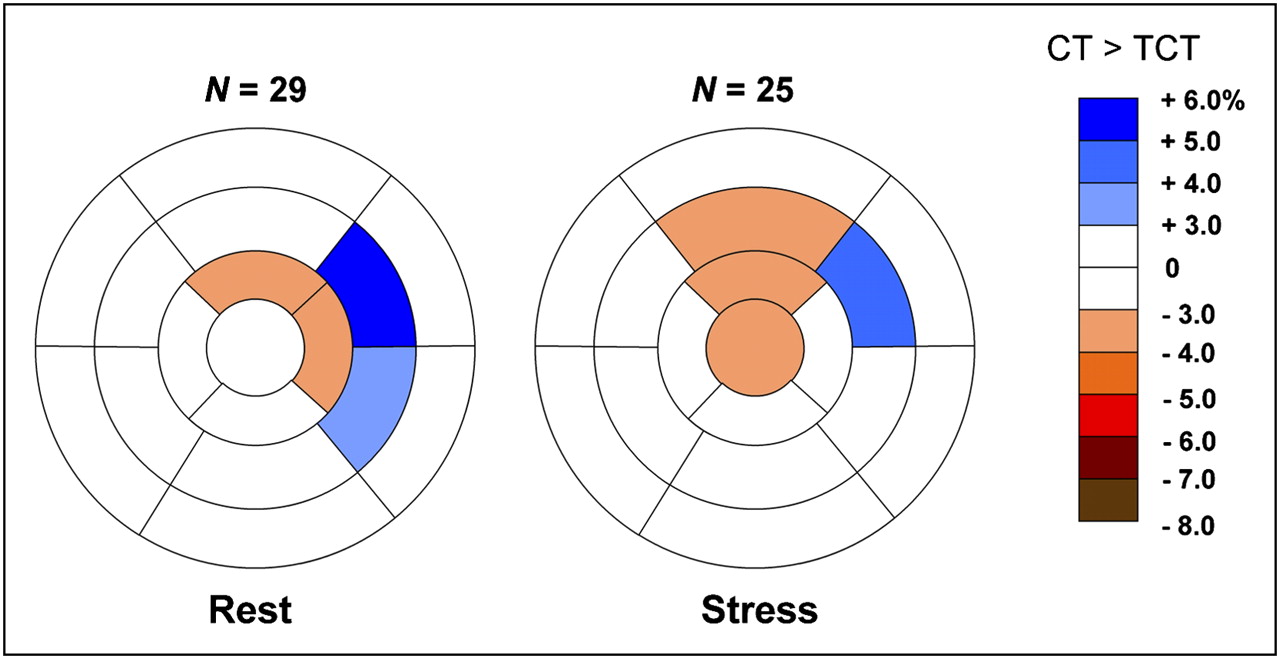
Stress and rest American Heart Association 17-segment representation of average differences between 82Rb PET data attenuation-corrected with TCT and with CT for studies with no misregistration or with misregistration less than 5 mm. Changes are expressed as percentage of all counts in myocardium (all changes are P < 0.05). Negative change (red) implies that CT-corrected value is smaller.

Stress and rest American Heart Association 17-segment representation of average differences between 82Rb PET data attenuation, corrected with TCT and with CT for studies with misregistration greater than 5 mm before (A) and after (B) alignment correction.
Before misalignment correction, the largest segmental changes were observed in segment 7 (49%; CT < TCT). The largest global CT-to-TCT change (average in all segments) in 1 patient study was 18% (CT < TCT). After correction, the largest segmental change was 65% (segment 7), and the largest global change (average change for all segments for a given patient) was 24% (both CT < TCT). The largest segmental and global change occurred in 1 case in which alignment correction increased the TCT–CT differences. The second largest segmental change after correction was 39% (segment 10), and the second largest global change was 9%.
Individually, changes greater than 10% between any of the segments of a given study occurred in 27.6% of rest studies and 28.0% of stress studies without significant misalignment, in 56.0% of rest studies and 42.3% with significant misalignment, and in 48.0% of rest studies and 58.0% of stress studies corrected for significant misalignment. Changes greater than 20% still occurred in at least 1 segment in 26.9% of rest studies and 33.1% of studies after misalignment correction in significantly misaligned cases.
QC of Alignment
In Figure 4, we show the frequency and magnitude of misalignment for rest (Fig. 4A) and stress (Fig. 4B) studies. The overall agreement regarding the correct or incorrect alignment (defined as observer difference < 5 mm) between 2 observers was 72.2%. The range of misalignment was 0–15 mm in x, 0–16 mm in y, and 0–20 mm in z. A total of 10 studies were judged aligned (grade, 0) by observer 2 but were shifted by more than 5 mm by observer 1. For one of these studies, observer 1 made an adjustment greater than 10 mm. On the other hand, observer 1 found a perfect alignment in 10 studies, which were adjusted by more than 5 mm by observer 2 (6 of these 10 studies were adjusted by more than 10 mm by observer 2). Overall, 38 (70%) of the stress studies and 36 (67%) of the rest studies were judged to be misaligned by 5 mm or more by at least 1 observer. After an additional verification step to resolve the differences between the 2 observers by a third observer, the number of studies misaligned by 5 mm or more was 25 (46%) for rest and 29 (54%) for stress. In Table 1, interobserver variability is specified in all 3 directions. None of the 108 transmission–emission pairs has shown visual misalignments as observed on the CT-emission pairs.

Frequency and magnitude of misalignment as judged by 2 observers for rest (A) and stress (B) studies.
Interobserver Variability in PET/CT Alignment
Examples
In Figure 5, we show an example of the differences, with polar maps, change analysis, and fusion QC pages, before and after CT misalignment correction in which the differences were resolved by the alignment procedure. In Figure 6, we show an example of a study in which differences still remain, despite manual realignment of the CT map.

Example of misalignment in rest 82Rb study of female patient (weight, 54.4 kg [122 lb]; age, 76 y; body mass index, 20.9). Images are before alignment correction (A) and attenuation-corrected with aligned CT (aCT) (B). From left to right, figure shows TCT- and CT-corrected original images, positive and negative change images with overlaid contours, raw polar maps, change polar maps, and PET/CT fusion images with blue arrows showing identified misalignment. TCT > CT changes are seen in septal wall (white arrows). Differences between CT- and TCT-corrected studies changed after alignment correction of CT. Two observers identified displacements of x = 10, y = 4, and z = 6 mm and x = 6, y = 11, and z = −1 mm.

Example of misalignment in stress study of male patient (weight, 75.9 kg [167 lb]; age, 67 y; body mass index, 25.4), in which AC by aligned CT (aCT) did not eliminate differences between CT- and TCT-corrected images. TCT > aCT changes remain in anterior and septal walls (white arrow), and TCT < aCT changes are shown in inferior wall (yellow arrow), despite manual alignment. Note that irregular heart structure on CT maps (green arrows), which is likely due to respiratory and cardiac motion effects during normal breathing CT, could be likely cause of remaining differences.
DISCUSSION
We have observed significant regional count differences between TCT- and CT-corrected studies, despite an attempt to correct misalignment of emission PET data and CT images acquired during normal breathing. One implication of this finding is that the same normal-limit databases should not be exchanged between these 2 types of AC, because the interstudy variation in normal limits is in the 5%−7% range in most segments (13,14). Previously reported PET performance for detection of CAD (sensitivity, specificity, and accuracy) may indeed be different with CT-based systems. The CT misalignment problem may be one of the reasons why in the recent PET/CT study, the data specificity obtained with a PET/CT system (14) was both lower (specificity, 54%) than that previously reported with the PET transmission systems by visual analysis (specificity, 88%) and also slightly lower than that reported for the relative quantification of SPECT with transmission AC (specificity, 80%) for detection of greater than or equal to 70% stenosis (13).
In other recent studies, CT-based and TCT-based alignments for cardiac PET have been compared in small patient groups, with conflicting results. Koepfli et al. (3), in their initial validation of the CT-based AC, compared global rather than regional parameters between CT and TCT AC in 11 patients and did not find significant changes. This approach, however, is likely to mask respiratory effects, which can cause both positive and negative changes, as shown in our work, and these will likely be cancelled in the global analysis. In another recent study of oncologic whole-body PET data, good correlations (r = 0.78–0.82) were found between segmental uptakes of 18F-FDG in the cardiac region, obtained from standard PET (with transmission AC) and from PET/CT (in separate acquisition) in 27 patients (15). However, in that study, the images were acquired by different scanners, and the differences between corresponding segments have not been directly compared. CT-based AC for cardiac imaging has also been compared with transmission techniques in phantoms (16) and in human subjects in a small pilot group (n = 7) on separate scanners, in which significant differences have been observed (17).
Other studies observed a similar rate of incorrectly aligned studies in cardiac PET/CT (18,19) and SPECT/CT (20). Manual and automatic registration for cardiac PET/CT was proposed as a potential solution (18), as performed in this study. However, Gould et al. have recently shown that the rigid-body correction for the image alignment may not be sufficient with the standard helical CT acquisitions because of the nonlinear changes between PET and CT; these authors proposed more complex 4-dimensional CT protocols to allow rigid manual re-registration (6). The point of view of Gould et al. was disputed by a different group, which reported a lower incidence of misalignment when applying a protocol that uses fast free-breathing (21). These previous studies were based on visual subjective judgments of PET/CT misalignment, and they did not directly compare CT-based correction with the previously established reference standard (TCT-based correction), as we have performed in this work. Our study shows that significant regional differences remain between data acquired with CT-based and TCT-based corrections after rigid-body corrections.
The cardiac PET/CT misalignment problems have been recently recognized by the equipment vendors, and various new implementations of the reconstruction software allow re-reconstruction of PET data after manual visual realignment of PET and CT. However, it has been suggested that because of complex respiratory artifacts present in standard helical CT acquired during breathing, 4-dimensional CT acquisitions (with significant additional radiation dose) may be required to apply these manual corrections (6). Furthermore, there is a significant difficulty and interobserver variability in identifying such misalignments visually (as shown in this work) due to lack of clearly corresponding anatomic features and potential respiratory and cardiac phase mismatch, despite normal-breathing CT acquisition. Consequently, this process introduces undesirable additional variability to the final perfusion images available for semiquantitative analysis. In fact, in this study the surprisingly low agreement (72%) between two observers with respect to the amount of misregistration indicates that this variability may be substantial. Therefore, automated registration tools built into the image reconstruction may be preferred. These tools are likely to require a nonlinear registration approach in view of the recent findings (6) and in view of the results presented in this study. To our knowledge, such techniques are not available for cardiac PET/CT applications at this point. Additionally, we have observed significant regional changes between CT- and TCT-corrected studies without obvious visual misalignments. It is therefore possible that visual QC as currently practiced is not sensitive enough, and it is not helpful in some cases.
Potential solutions may require specialized cardiac CT protocols (6,22,23). In these recently published articles, the authors proposed to use the cine CT technique (4) and then average the CT data over many respiratory cycles, creating a respiration-blurred CT scan that matches blurring of transmission and emission scans. Alessio et al. have found that the use of an intensity-maximum cine CT, rather than an averaged cine CT (22), gives more robust AC; however, misregistration between PET and CT could still occur. Radiation dose can also be critical, but this issue can be partially solved by radically lowering the CT beam current, which is possible on some types of scanners (6). Another approach, proposed by Cook et al. (23) and applied in canine studies, used respiratory gated PET acquisition and a cine CT to perform a different AC for each phase of the respiratory cycle.
Study Limitations
No coronary angiography results were available to verify the results of our study; however, we simply report differences between the CT- and TCT-based AC methods in the same patients. The TCT standard may not represent the absolute truth because the attenuation coefficients are approximated in both CT-based and TCT-based techniques, and misalignment between transmission and emission data could potentially occur. However, we visually checked the transmission–emission data for misalignment and did not observe it in any of the studies. Furthermore, TCT-based techniques have been used for several years and were used in various validation studies of cardiac PET research. Therefore, they represent a de facto reference standard, even if not the “absolute truth.” Thus, we believe that the comparisons, as presented here, are of great interest to all cardiac PET users, because previous findings in cardiac PET need to be compared with new results obtained with current-generation scanners. Additionally, we did not assess how the observed differences affect the clinical decision making; however, this was a retrospective study in which angiography results were not available and that aimed to characterize changes in a semiquantitative fashion. We did not perform quantification of perfusion with normal limits. Instead, direct image registration of TCT- and CT-corrected studies and pixel-based analysis of changes between the TCT- and CT-based data were used. In this study, a normal-breathing protocol was used, and others suggested that a near-expiration protocol may be more appropriate (17). However, other prominent laboratories reported cardiac 82Rb PET/CT acquisition during normal breathing (9), and other studies recommend quiet breathing for AC of thorax PET/CT scans (24). Only translational misalignments were assessed by the users, and it is possible that there were additional rotational or even more complex components. However, the addition of rotational misalignments would likely result in further increased interobserver variability and significantly increase the operator time.
CONCLUSION
Significant differences in perfusion count distribution between cardiac PET studies with TCT- and CT-based AC exist, which remain even after alignment correction of CT studies. Normal limits for cardiac PET acquired with CT-based and TCT AC should not be interchanged, and serial scans obtained on both standard PET and PET/CT may not be directly comparable. Further investigation and optimization of CT-based AC are required for cardiac PET/CT.
Footnotes
-
COPYRIGHT © 2008 by the Society of Nuclear Medicine, Inc.
References
- Received for publication February 27, 2008.
- Accepted for publication September 3, 2008.


Jump to section
Related Articles
Cited By...
- Dual-Gated Motion-Frozen Cardiac PET with Flurpiridaz F 18
- Coronary Arterial 18F-FDG Uptake by Fusion of PET and Coronary CT Angiography at Sites of Percutaneous Stenting for Acute Myocardial Infarction and Stable Coronary Artery Disease
- Comparison of Clinical Tools for Measurements of Regional Stress and Rest Myocardial Blood Flow Assessed with 13N-Ammonia PET/CT
- Agreement of Visual Estimation of Coronary Artery Calcium From Low-Dose CT Attenuation Correction Scans in Hybrid PET/CT and SPECT/CT With Standard Agatston Score
- Low-Dose Quantitative Myocardial Blood Flow Imaging Using 15O-Water and PET Without Attenuation Correction