


Abstract
Misregistration of cardiac PET/CT data can lead to misinterpretation of regional myocardial perfusion. However, the effect of misregistration on the quantification of myocardial blood flow (MBF) has not been studied. Methods: Cardiac 82Rb-PET/CT scans of 10 patients with normal regional myocardial perfusion were analyzed. Realignment was done for the baseline and stress PET/CT images as necessary, and MBF was obtained from dynamic data. Then, the stress images were misregistered by 5 mm along the x-axis (left) and z-axis (cranial) and again by 10 mm. A 10-mm misregistration in the opposite direction (−10 mm along the x-axis [right] and z-axis [caudal]) was also tested. Stress MBF was recalculated for 5-, 10-, and −10-mm misregistrations. Results: Stress MBF of the left ventricle decreased by 10% ± 6% (P = 0.005) after 5-mm misregistration and by 24% ± 15% (P = 0.001) after 10-mm misregistration. In descending order, the most important stress MBF changes occurred in the anterior (39% ± 9%), lateral (34% ± 9%), apical (20% ± 16%), inferior (12% ± 10%), and septal (10% ± 12%) walls after 10-mm misregistration. Lesser changes were observed after 5-mm misregistration, with the same wall distribution. In contrast, −10-mm misregistration increased global MBF by 9% ± 6% (P = 0.004). In descending order, the overestimation of estimated MBF after −10-mm misregistration occurred in the lateral (15% ± 8%), apical (15% ± 18%), anterior (9% ± 5%), and inferior (9% ± 11%) walls. Conclusion: Misregistration of the stress PET/CT dataset leads to significant global and regional artifactual alterations in the estimated MBF. Quantitative error was observed throughout the myocardium and was not confined to those heart regions that extended into the lung on misregistered CT.
Quantitative cardiovascular PET, including measurements of absolute myocardial blood flow (MBF) and myocardial flow reserve (MFR), seems likely to become part of routine clinical practice in the evaluation of individuals with heart disease. There is supportive evidence demonstrating that impaired vasodilator-induced MBF and MFR are independent risk factors for cardiac death and other adverse cardiovascular events (1–4). Precise and reliable quantification of flow is of paramount importance in the management of these patients.
It has previously been demonstrated that accurate estimation of myocardial tracer uptake for regional myocardial perfusion PET requires proper alignment of the emission–transmission data (5). Error-free reconstruction of PET data with a registered CT attenuation map is essential for accurate quantification and interpretation of cardiac perfusion.
Misalignment of the CT and PET studies can be caused by respiratory or cardiac motion and gross physical movement of the patient. This motion can produce an erroneous attenuation map that imposes lung attenuation parameters onto the heart wall, thereby underestimating the attenuation and creating artifactual areas of hypoperfusion (5,6). Moreover, regional inhomogeneities in attenuation produced by misregistration are frequently not appreciated visually but may be important quantitatively and need to be considered. The impact of emission–transmission misregistration of cardiac PET/CT datasets on MBF quantification has not, to our knowledge, been evaluated yet and was the aim of the present study.
MATERIALS AND METHODS
Study Group
Cardiac PET/CT image datasets of 10 patients referred for clinical indications were analyzed. To avoid interfering effects of flow-limiting coronary stenosis, only subjects with no prior history of coronary artery disease who had normal regional myocardial perfusion and an MFR greater than 3.00 on PET were included in this analysis. The study was approved by the ethics committee, and the need to obtain informed consent was waived.
PET/CT Protocol
All imaging was performed on a 64-slice Discovery Rx VCT PET/CT scanner (GE Healthcare). Individuals were positioned, and a low-dose helical CT scan (120 kV, 50–100 mA) was acquired during shallow breathing before rest imaging for attenuation correction of the rest and stress PET data. Through a large antecubital intravenous line, 1,480–1,850 MBq of 82Rb were infused, and a list-mode 2-dimensional PET scan was acquired for 8 min.
Vasodilator stress with dipyridamole (0.56 mg/kg, 4 min) was started after the rest acquisition, and a second dose of 1,480–1,850 MBq of 82Rb was injected, starting 4 min after the end of the dipyridamole infusion and followed by acquisition of an 8-min list-mode scan. The patient was not moved between the rest and stress scans.
PET/CT Misregistration
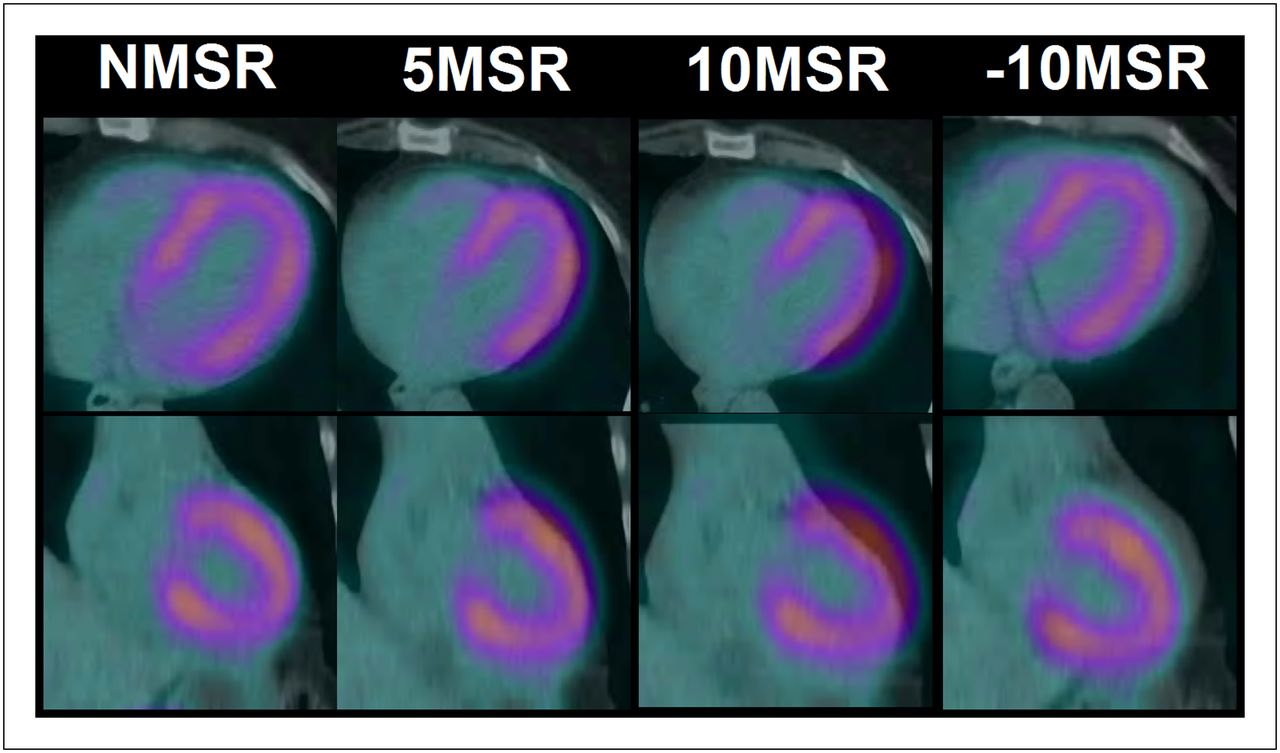
Manual registration was created by interactively moving the CT image over the PET image in the coronal, sagittal, and transaxial views. Four sets of cardiac PET/CT images were obtained. The first set was assigned to the no-misregistration group. Both rest and stress PET/CT images were visually aligned for proper registration, paying special attention to ensure that the left ventricular myocardial activity on PET did not overlap with the lung parenchyma on CT. The second set included only stress images in which a 5-mm misregistration of the PET and CT datasets was artificially created along both the x-axis (left) and the z-axis (cranial), such that there was overlap between the lung parenchyma on CT and the lateral and anterior walls of the left ventricle on PET. The third set included only stress images with 10-mm misregistration along both the x- and the z-axes, resulting in a similar overlap pattern between the lung and the heart. The fourth set included images in which a 10-mm misregistration was artificially created in the opposite direction (−10-mm misregistration), that is, 10 mm toward the right along the x-axis and 10 mm caudally along the z-axis (Fig. 1).

Axial (top row) and coronal (bottom row) images showing no misregistration (NMSR) and effects of 5-mm misregistration (5MSR), 10-mm misregistration (10MSR), and reverse 10-mm misregistration (−10MSR) between PET and CT images.
Separate attenuation-corrected PET images based on these 4 different registration conditions were generated. For each registration condition, static (90-s prescan delay) and dynamic (32 frames: 20 × 6 s, 5 × 12 s, 4 × 30 s, and 3 × 60 s) images were reconstructed using the ordered-subsets expectation-maximization algorithm (2 iterations, 21 subsets).
Image Analysis
Quantification was performed using the custom-designed MunichHeart software, which had been previously validated at our institution (7). Myocardial activity in the last frame of the dynamic datasets was volumetrically sampled, and segmented polar maps of the left ventricle were generated and applied to the whole dynamic series to obtain myocardial time–activity curves. A small region of interest was positioned in the left ventricular cavity to obtain the arterial input function. MBF was then quantified using a simplified retention approach (7,8). The concentration of myocardial activity between 4 and 8 min was normalized to the area under the arterial input function in the first 120 s. The resulting index was software-corrected for partial volume, spillover, and nonlinear extraction of 82Rb (7).
This process was initially performed on the no-misregistration dataset and then repeated on the 5- and 10-mm misregistration datasets.
MBF was obtained at peak stress and rest, and the ratio of stress flow to rest flow was used to obtain MFR. Both MBF and MFR were obtained on a global and regional basis for different walls of the left ventricle (anterior, inferior, lateral, septal, and apical) in all 3 sets of images. Additionally, the summed stress score was calculated using the standard 17-segment 5-point scale (9).
Statistical Analysis
Data are shown as mean ± SD or mean percentage change and 95% confidence interval (CI). An ANOVA with repeated measures combined with the Bonferroni test for post hoc analysis and correction for multiple comparisons was used to compare global and regional differences in flow between no misregistration and 5- and 10-mm misregistration. P values of less than 0.05 were considered statistically significant. Analysis was performed using SPSS (version 19.0; IBM) for Windows (Microsoft).
RESULTS
Regional myocardial perfusion was normal at baseline (summed stress score, 0 in all no-misregistration cases) but changed significantly with 5-mm misregistration (summed stress score, 2.4 ± 1.2; P < 0.0001) and 10-mm misregistration (summed stress score, 8.0 ± 2.3; P < 0.0001) after development of apparent regional defects in the anterior and lateral walls (Fig. 2).

Myocardial perfusion stress PET images and polar maps demonstrate effects of no misregistration (NMSR) and effects of 5-mm misregistration (5MSR), 10-mm misregistration (10MSR), and reverse 10-mm misregistration (−10MSR) between PET and CT images. Artifactual defects are prominent in anterior and lateral walls of heart, although this patient had no disease. SA = short axis; VLA = vertical long axis.
Between the no-misregistration and 10-mm misregistration studies, there was a statistically significant decrease in stress-induced global MBF (24% change; 95% CI, 17–31; P = 0.001) and global MFR (23% change; 95% CI, 15–30; P < 0.0001). The reduction in stress-induced global MBF (10% change; 95% CI, 5–14; P = 0.005) and global MFR (9% change; 95% CI, 5–13; P = 0.02) between the no-misregistration and 5-mm misregistration datasets was also significant. There was an overestimation of global MBF (9% change; 95% CI, 3–13; P = 0.004) and MFR (12% change; 95% CI, 2–21; P = 0.2) after −10-mm misregistration (Tables 1 and 2).
Regional and Global Differences in Calculation of Vasodilator-Induced Stress MBF
Regional and Global Differences in Calculation of MFR
On a regional basis, and in descending order of change, stress MBF (Fig. 3) and MFR decreased in the anterior, lateral, apical, inferior, and septal walls after both 5- and 10-mm misregistration compared with no misregistration. This reduction was statistically significant in all myocardial walls (except the septum for stress MBF) between no-misregistration and 10-mm misregistration datasets but reached statistical significance only for the anterior and lateral walls between the no-misregistration and 5-mm misregistration studies (Table 1). In the −10-mm misregistration images, regional MBF was significantly overestimated (in descending order of change) in the lateral, apical, and anterior walls (Tables 1 and 2; Fig. 3).

Percentage decrease in artifactual stress MBF (% change ± SD) to different ventricular walls and total left ventricle with 5-mm misregistration (5MSR), 10-mm misregistration (10MSR), and reverse 10-mm misregistration (−10MSR) datasets compared with images with no misregistration. *Statistically significant changes in estimates of absolute stress MBF compared with images with no misregistration.
DISCUSSION
The main finding of our study was that misregistration of the stress PET/CT dataset caused a marked global and regional reduction of the calculated absolute flow. Although this was somewhat expected, the magnitude of the difference in stress MBF and MFR due to varying degrees of PET/CT misregistration had not been previously determined.
Misregistration of CT for attenuation correction and PET emission data with associated artifactual PET defects is due to momentary helical CT snapshots at some point in the respiratory cycle. The attenuation of thoracic–diaphragmatic structures on the snapshot CT scan may not match the actual average attenuation of the constantly changing thoracic–diaphragmatic structures over longer emission scans during normal breathing (5,10). A study by Gould et al. showed that most misregistration defects were anterior or lateral and were associated with corresponding anterior or lateral misregistration on the PET/CT fusion images (5). The marked difference in the attenuation factor of cardiac and lung tissue has been mentioned as the possible reason for the changes in measured tracer uptake (10).
To compute absolute flow, several corrections have to be made to the data, including correcting the myocardial counts for partial-volume losses and for spillover from blood-pool activity to the myocardium, and correction of blood-pool activity or arterial input for myocardial–to–blood-pool spillover (8). All these factors may potentially be affected by artifactual myocardial perfusion defects caused by misregistration, leading to false absolute MBF values. Therefore, measurements of absolute MBF may be appropriate only if the primary radionuclide uptake data are correctly obtained using properly registered PET/CT images. Similar corrections are required when MBF is calculated using 13N-ammonia (11,12), and it is likely that misregistration between the emission and transmission images will affect MBF estimation when 13N-ammonia is used as a radiotracer.
In this study, to avoid unnecessary radiation exposure, we obtained a single CT scan for attenuation correction (before rest imaging) of both rest and stress PET datasets since we previously found that a repeated CT scan after the stress study does not significantly improve misregistration in the stress images (6).
There has been renewed interest in translation of MBF and MFR using PET from the research realm to routine clinical practice. Recent studies have shown significant diagnostic potential for abnormal MFR in identification of triple-vessel disease and the prognostic impact of abnormal MFR over and above that predicted by traditional risk factors and high-risk findings on a cardiac PET/CT scan (1–4). With the increasing availability of PET, there is a growing potential for wider application of this measurement. Our study shows that even a 0.5-cm misregistration of the anterior and lateral walls can decrease estimates of stress-induced global MBF by 5%–14% and that 1 cm of misregistration can decrease it by a factor of 17%–31%. Importantly, misregistration affected the measured regional flow in all myocardial walls, including the inferior wall and septum, despite no obvious overlap between these walls on PET and tissues of different attenuation densities on CT. This quantitative error was observed throughout the myocardium because of the way photon attenuation affects PET images. The attenuation at a particular point is dependent on the total attenuation along all lines of response passing through that point, not simply on the attenuation properties at that immediate location. As such, attenuation correction factors derived from misregistered CT will be expected to be inaccurate for all locations, not simply those areas where there is a pronounced difference in tissue attenuation, such as when myocardium on PET is seen to lie in the lung on CT. This was seen in our study, with the greatest differences occurring in the anterior and lateral walls, along with a lesser degree of calculated differences in the inferior wall and septum. These differences became more pronounced with increasing severity of misregistration. Interestingly, when the PET images in our study were misregistered by 10 mm in the opposite direction, there was a statistically significant overestimation of MBF. However, the estimated change was to a lesser degree than that seen after 10-mm misregistration, most likely because of increased attenuation correction factors applied to the central region of the field of view. This possibility is supported by the fact that the change was least in the septum (located more centrally in the field of view) and maximal at the apex and the lateral wall, which are more peripherally located.
The limitations of this study were that only a small number of subjects without a history of coronary artery disease were studied, and only a single validated model of MBF estimation was used. Perfusion using 82Rb has been validated for estimation of MBF using different analytic methods. The magnitude of change that could potentially occur during misregistration using other validated models for estimation of MBF with 82Rb has not yet been studied.
CONCLUSION
Misregistration in the axial and coronal planes of stress PET/CT studies causes significant artifactual errors in estimation of global and regional myocardial flow. Quantitative error was observed throughout the myocardium and was not confined to those heart regions that extended into the lung on misregistered CT. This study reinforces the need for appropriate quality control and for care to ensure optimal registration when cardiac PET/CT images are obtained for either clinical or investigational purposes.
DISCLOSURE
The costs of publication of this article were defrayed in part by the payment of page charges. Therefore, and solely to indicate this fact, this article is hereby marked “advertisement” in accordance with 18 USC section 1734. No potential conflict of interest relevant to this article was reported.
Acknowledgments
We thank Judy Buchanan from the Division of Nuclear Medicine at Johns Hopkins for her helpful editorial assistance.
Footnotes
Published online Oct. 22, 2012.
- © 2013 by the Society of Nuclear Medicine and Molecular Imaging, Inc.
REFERENCES
- Received for publication May 2, 2012.
- Accepted for publication July 20, 2012.


Jump to section
Related Articles
Cited By...
- Automated Motion Correction for Myocardial Blood Flow Measurements and Diagnostic Performance of 82Rb PET Myocardial Perfusion Imaging
- Cardiac Displacement During 13N-Ammonia Myocardial Perfusion PET/CT: Comparison Between Adenosine- and Regadenoson-Induced Stress
- Clinical Quantification of Myocardial Blood Flow Using PET: Joint Position Paper of the SNMMI Cardiovascular Council and the ASNC
- Scatter Correction with Combined Single-Scatter Simulation and Monte Carlo Simulation Scaling Improved the Visual Artifacts and Quantification in 3-Dimensional Brain PET/CT Imaging with 15O-Gas Inhalation
- The Effect of Misregistration Between CT-Attenuation and PET-Emission Images in 13N-Ammonia Myocardial PET/CT