


Abstract
In 3-dimensional PET/CT imaging of the brain with 15O-gas inhalation, high radioactivity in the face mask creates cold artifacts and affects the quantitative accuracy when scatter is corrected by conventional methods (e.g., single-scatter simulation [SSS] with tail-fitting scaling [TFS-SSS]). Here we examined the validity of a newly developed scatter-correction method that combines SSS with a scaling factor calculated by Monte Carlo simulation (MCS-SSS). Methods: We performed phantom experiments and patient studies. In the phantom experiments, a plastic bottle simulating a face mask was attached to a cylindric phantom simulating the brain. The cylindric phantom was filled with 18F-FDG solution (3.8–7.0 kBq/mL). The bottle was filled with nonradioactive air or various levels of 18F-FDG (0–170 kBq/mL). Images were corrected either by TFS-SSS or MCS-SSS using the CT data of the bottle filled with nonradioactive air. We compared the image activity concentration in the cylindric phantom with the true activity concentration. We also performed 15O-gas brain PET based on the steady-state method on patients with cerebrovascular disease to obtain quantitative images of cerebral blood flow and oxygen metabolism. Results: In the phantom experiments, a cold artifact was observed immediately next to the bottle on TFS-SSS images, where the image activity concentrations in the cylindric phantom were underestimated by 18%, 36%, and 70% at the bottle radioactivity levels of 2.4, 5.1, and 9.7 kBq/mL, respectively. At higher bottle radioactivity, the image activity concentrations in the cylindric phantom were greater than 98% underestimated. For the MCS-SSS, in contrast, the error was within 5% at each bottle radioactivity level, although the image generated slight high-activity artifacts around the bottle when the bottle contained significantly high radioactivity. In the patient imaging with 15O2 and C15O2 inhalation, cold artifacts were observed on TFS-SSS images, whereas no artifacts were observed on any of the MCS-SSS images. Conclusion: MCS-SSS accurately corrected the scatters in 15O-gas brain PET when the 3-dimensional acquisition mode was used, preventing the generation of cold artifacts, which were observed immediately next to a face mask on TFS-SSS images. The MCS-SSS method will contribute to accurate quantitative assessments.
PET is useful for visualizing physiologic and pathologic conditions in the brain, similarly to MRI. In particular, brain PET with 15O-gas inhalation (15O-gas brain PET) has been used for the quantitative assessment of cerebral blood flow (CBF), cerebral blood volume (CBV), cerebral metabolic rate for oxygen (CMRO2), and oxygen extraction fraction (OEF) (1–4). Despite attempts to quantify CBF, CMRO2, and OEF values by MRI (5,6), PET is established as the gold standard, used clinically to predict prognoses and determine operative indications in cerebrovascular disease (7,8).
A PET scanner is integrated into a CT system to acquire anatomic information and perform attenuation and scatter corrections. Today, because most commercially available PET/CT scanners are dedicated to 3-dimensional (3D) acquisition for whole-body imaging using 18F-FDG, it is important to update the imaging protocols in accord with the development of modern PET/CT scanners, toward the goal of maintaining 15O-gas brain PET as the gold standard. The 3D acquisition mode has high sensitivity, and with this mode the doses of radiotracers can thus be reduced or the acquisition time can be shortened. However, the increasing proportion of scatter events degrades the quantitative performance of PET scanning (9), necessitating accurate scatter correction for the 3D acquisition mode.
Conventionally, 15O-gas brain PET is performed using the 2-dimensional (2D) acquisition mode with high quantitative accuracy. The accuracy of the 3D acquisition mode for quantitative brain imaging is controversial. Ibaraki et al. reported that the 3D acquisition mode with appropriate scatter correction provides high quantitative accuracy that is comparable to that in the 2D acquisition mode (10). Hori et al. observed cold artifacts on images corrected for scatter by CT-based tail-fitting scaling with single-scatter simulation (TFS-SSS) when a face mask for collecting 15O-gas as expired air was present in the field of view (FOV) in PET. Such cold artifacts may have originated from face-mask 15O-gas located outside the brain (11).
A face mask itself has a low linear attenuation coefficient (the μ-value) due to low-atomic-number materials or partial-volume effects. TFS-SSS requires that regions with tracer uptake include tissues with a certain μ-value as in 18F-FDG PET. However, the face mask used in 15O-gas brain PET creates a region in which tracers accumulate in the air with a low μ-value. The TFS-SSS method relies on the μ-value to identify boundaries, outside which no tracer activity is expected. In 15O-gas brain PET, the identified boundaries exclude the face mask; this method treats the activities in the mask as scatter contributions, and it therefore overscales the scatter estimate in the scaling algorithm.
A new scatter-correction method based on Monte Carlo simulation (MCS) was developed in 2014 (12). It combines single-scatter simulation (SSS) for estimating the scatter contribution with MCS (MCS-SSS) for calculating the scaling factor. In 2 studies, artifacts were successfully reduced on whole-body 18F-FDG PET images with MCS-SSS, when the imaged object was large with respect to the FOV of the PET (12,13). Unlike TFS-SSS, MCS-SSS does not require CT images for identification of the boundaries. Therefore, errors from scatter correction in 15O-gas brain PET may be minimized by MCS-SSS.
In the present study, we performed phantom experiments simulating 15O-gas brain PET and the 15O-gas brain PET of patient studies with cerebrovascular disease to examine the degrees of artifact reduction and the improvement of quantitative accuracy using MCS-SSS in a comparison with TFS-SSS.
MATERIALS AND METHODS
PET Scanner
A Gemini TF PET/CT scanner (Philips Healthcare) with a 64-detector-row CT system was used for all imaging (14). This scanner uses 4 × 4 × 22 mm lutetium–yttrium oxyothosilicate crystals. The coincidence and energy windows were used at their fixed settings of 3.8 ns and 460–665 keV, respectively. Random events were corrected by the delayed-window method. The acquisition was in the 3D-mode only.
Image Reconstruction
Images were reconstructed by a 3D row action maximum-likelihood algorithm (15) with the following default settings: number of iterations, 2; relaxation parameter, 0.012; blob radius, 2.5 pixels. The image matrix size was 144 × 144 pixels for the 576-mm FOV, and the voxel size was 4 × 4 × 4 mm. Attenuation correction was performed by the 4-segmented method using CT data. Scatter correction was performed on the PET console in TFS-SSS, and using a stand-alone Windows personal computer in MCS-SSS.
Overview of MCS-SSS
MCS-SSS is a combination of SSS with a technique for scaling the results of SSS using the scaling factor calculated by MCS (12,13,16). Here, SSS estimates the scatter contribution from a source distribution map in combination with an attenuation map. The total scatter count (Tscatter) is defined using the following equations: where Tmeasured is the measured total count on the sonogram, and TSSS is the total count on the scatter sinogram derived from SSS. The scaling factor for the SSS sinogram is then
 The scatter fraction (= total scatter events/total [true + scatter] events) is calculated by MCS to scale the sinogram derived from SSS. Because only the scatter fraction is required for estimating the scaling factor by the MCS, a large number of events for simulation are not required.
The simulation stabilizes normally reached 3-times iteratively updated until convergence, and then the MCS is terminated to reduce the processing time. Finally, the SSS sinogram scaled using the scaling factor is converted to an estimated scatter sinogram that matches the scatter contribution in the measured sinogram and used for the image reconstruction.
For 1-bed-position studies, MCS-SSS also assumes continuous-activity distribution beyond the axial FOV, to improve the accuracy of scatter estimation on the edge slices.
Phantom Experiments
We first prepared a NEMA (National Electrical Manufacturers Association) PET Phantom (NU2-1994; Data Spectrum Corp.) simulating the brain. This phantom is a circular cylinder (diameter, 20 cm; length, 19 cm), which removed air, water, and Teflon inserts. We filled the phantom with 3.8–7.0 kBq/mL of 18F-FDG solution.
Next, we filled a 100-mL plastic bottle with nonradioactive air or 0.0, 2.4, 5.1, 9.7, 24.5, 53.9, 78.9, 104.5, or 169.7 kBq/mL of 18F-FDG solution to simulate a face mask containing expired 15O-gas. The activity concentrations of 18F-FDG in the bottle were estimated from actual patient data. We measured the true activity concentrations of 18F-FDG in the cylindric phantom and bottles using an auto-well γ-counter (ARC-400; Hitachi). Decay was corrected to the start time of each PET imaging performed for each bottle attached to the cylindric phantom while its position was maintained during scanning. The 5-min PET acquisition was followed by CT imaging for attenuation and scatter corrections with the following parameters: tube voltage, 120 kVp; tube current, 300 mAs; slice thickness, 2 mm; FOV, 600 mm.
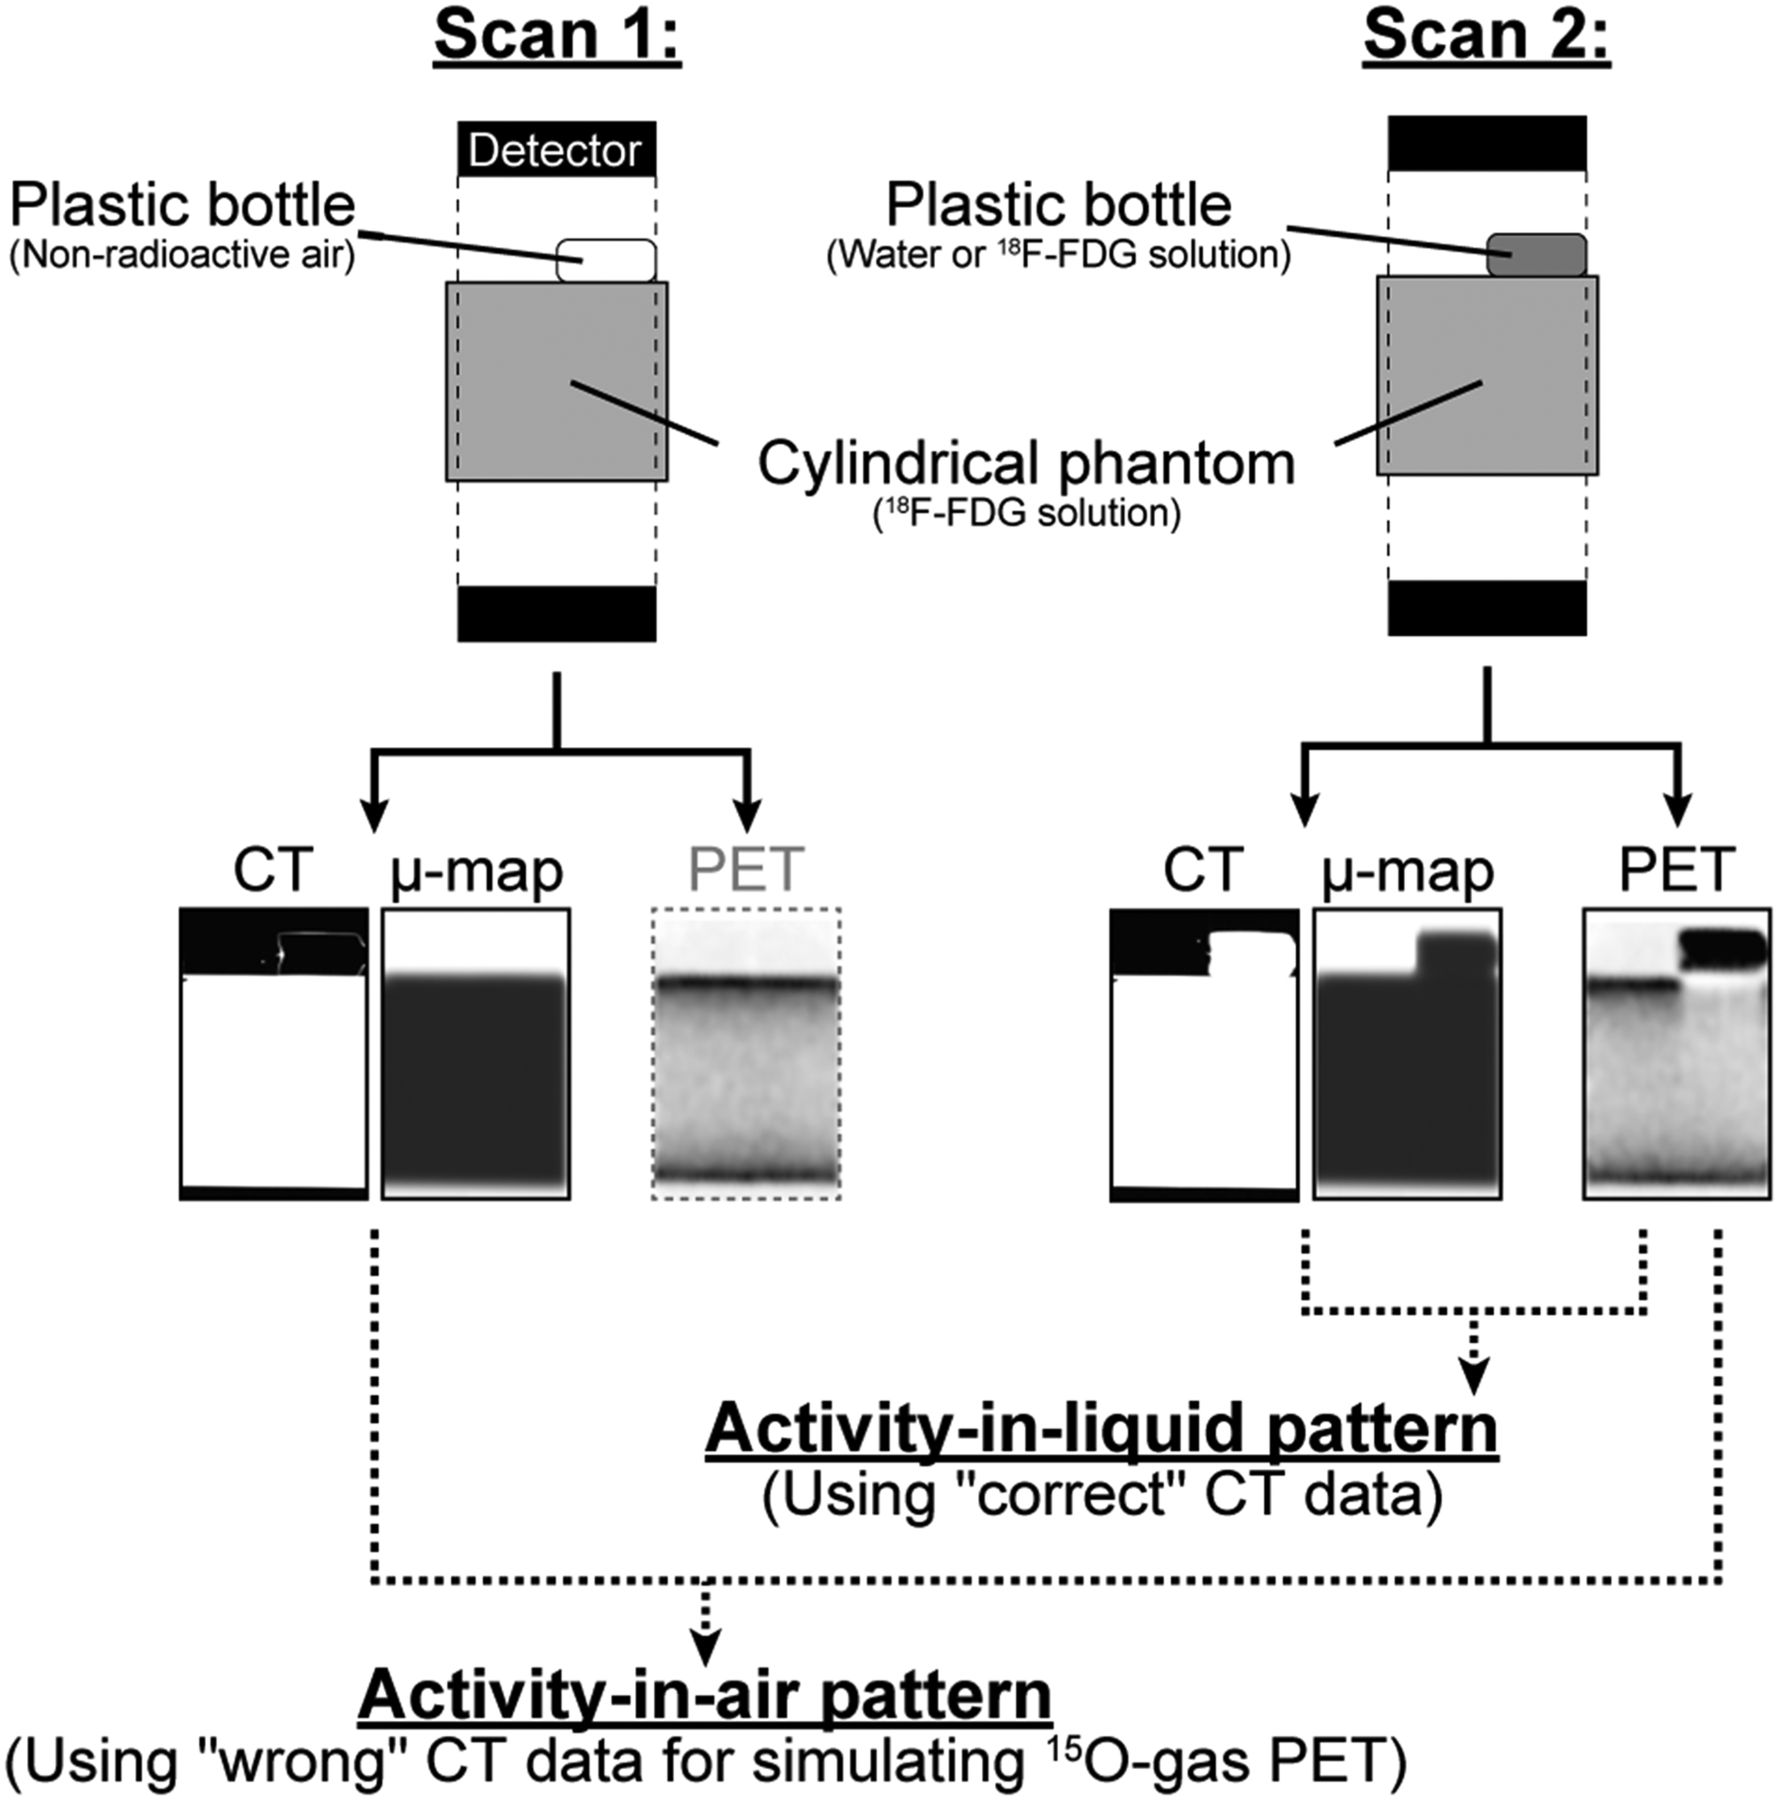
For the simulation of 15O-gas brain PET, we reconstructed attenuation- and scatter-corrected PET images of the bottle filled with water or 18F-FDG solution using the wrong CT data of the bottle filled with nonradioactive air (Fig. 1, activity-in-air pattern). For comparison, images were also reconstructed PET images of the bottle filled with water or 18F-FDG solution using the correct CT data of the bottle filled with water or 18F-FDG solution, respectively (Fig. 1, activity-in-liquid pattern). Images with attenuation correction but without scatter correction (non-SC) were also reconstructed.

Procedures used for data acquisition and image reconstruction in phantom experiments. Plastic bottle filled with nonradioactive air (scan 1) and water or an 18F-FDG solution (scan 2) was attached to cylindric phantom. Attenuation and scatter corrections were performed for PET data in scan 2 using the CT data obtained in scan 1 (activity-in-air pattern) and using CT and PET data in scan 2 (activity-in-liquid pattern).
On 5 images showing and not showing the bottle, 50-mm-diameter regions of interests were placed on the cylindric phantom. We compared the average image activity concentration of the 5 regions of interest with the true activity concentration. The coefficient of variation was calculated for the evaluation of image uniformity using the same region-of-interest data. We also measured scatter fractions for TFS-SSS and MCS-SSS for each activity concentration.
Human Studies
15O-gas brain PET imaging based on the steady-state method was retrospectively performed on 3 patients with unilateral internal carotid artery stenosis (case 1, a man in his 40s, right carotid; case 2, a man in his 50s, left carotid; case 3, a woman in her 70s, right carotid). After the patient’s head was securely fixed in place, 15O-gas–supplying nasal cannulas, a nonradioactive-oxygen mask, and an expired 15O-gas–collecting face mask were attached to the patient’s face. The nonradioactive-oxygen mask supplied oxygen only when the patient felt dyspnea or the arterial oxygen saturation dropped (<95%). CT images were acquired first for attenuation and scatter corrections. The CT imaging parameters were identical to those in the phantom experiments except for the tube current (100 mAs). PET imaging was then performed as described (2,17). The details of the procedure are provided in the supplemental materials (supplemental materials are available at http://jnm.snmjournals.org).
Prompt, scatter, and random sinograms from the C15O and C15O2 data were acquired for the generation of count profiles for the prompt—random and scatter sinograms. Because no sinograms were obtained from TFS-SSS, only those obtained from MCS-SSS were assessed. Activity concentration profiles for the axial direction were generated from sagittal images. Images for the quantitative assessments of CBF, CBV, CMRO2, and OEF were also generated. The institutional review board of the Hokkaido University Hospital approved the study.
RESULTS
Phantom Experiments
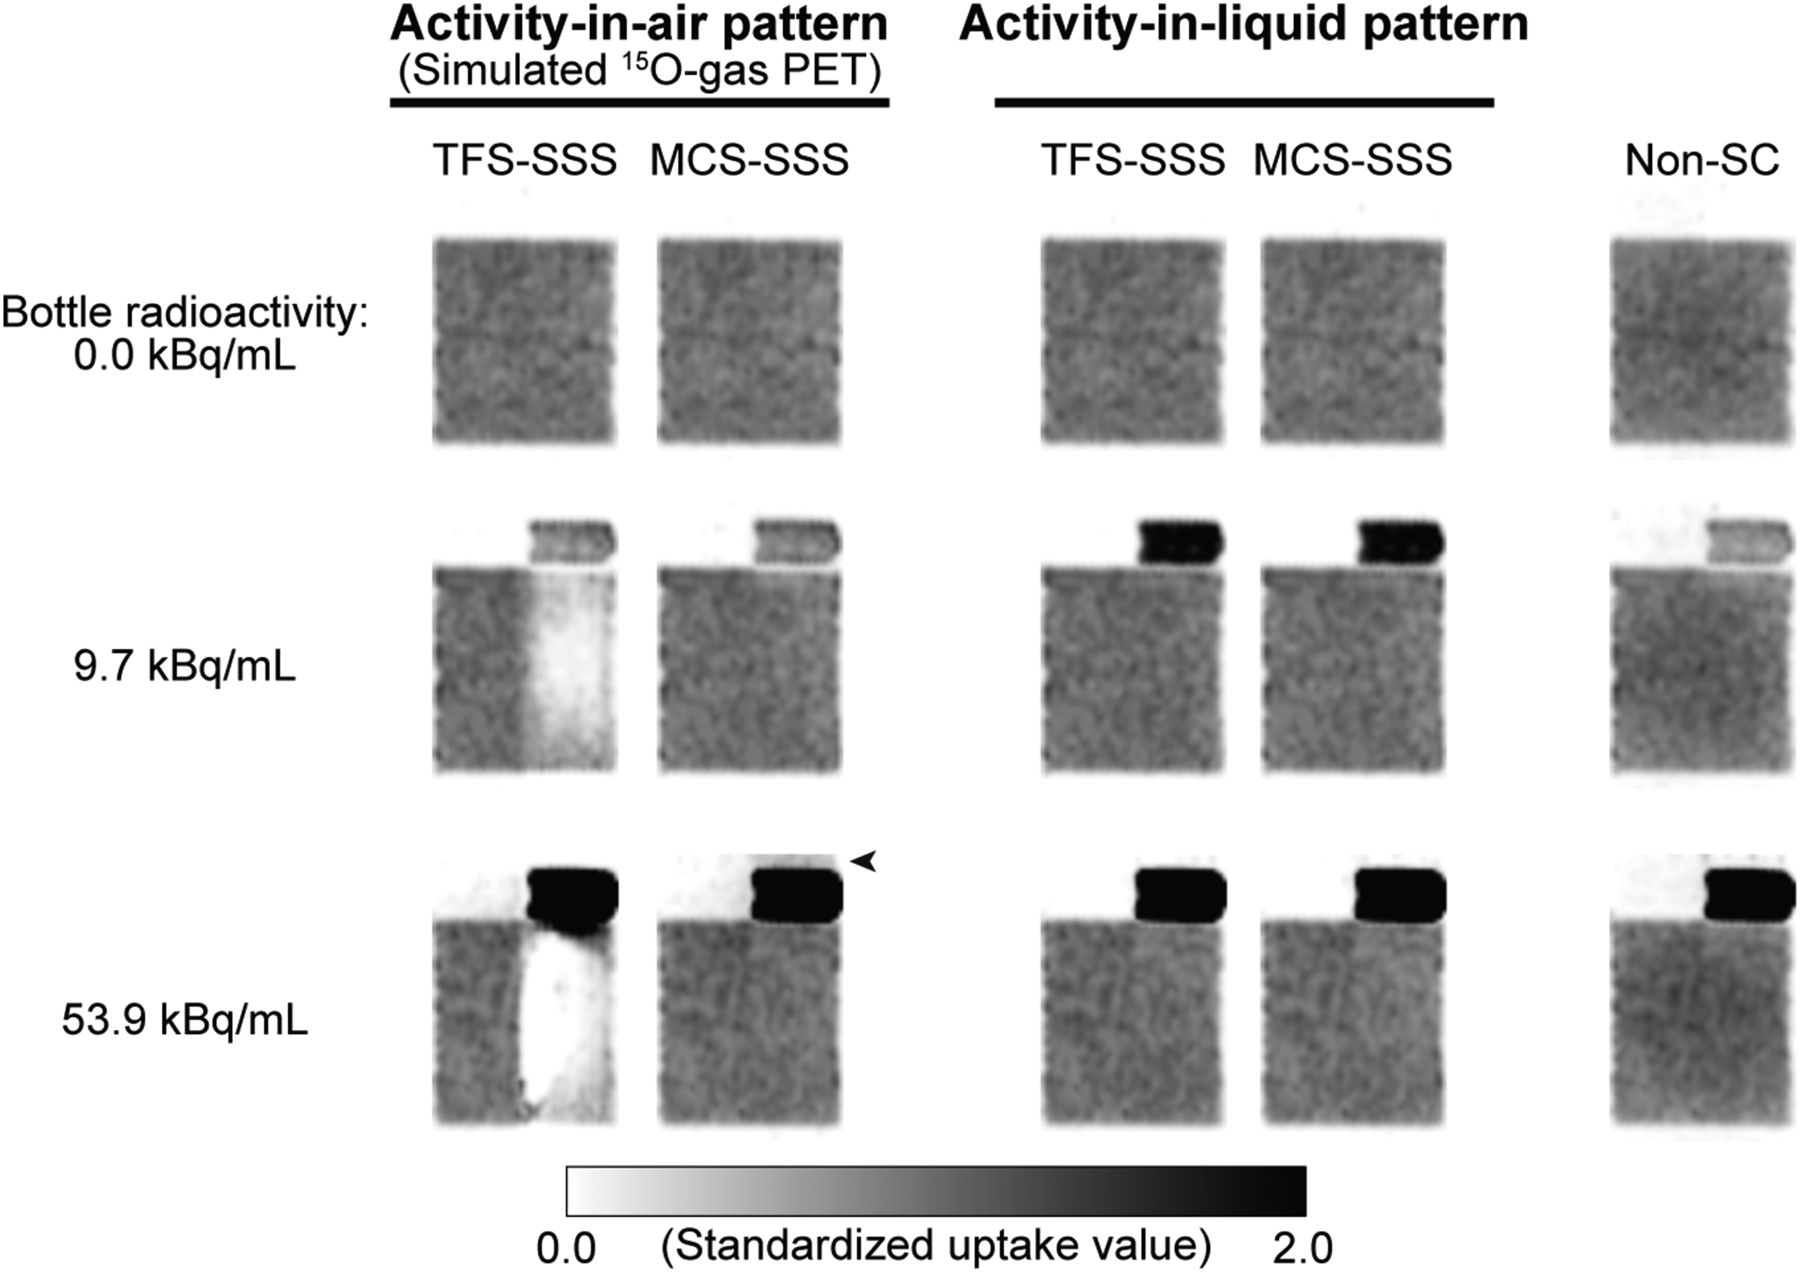
Figure 2 shows typical images of the phantom at the bottle radioactivity levels of 0.0, 9.7, and 53.9 kBq/mL. For the activity-in-air pattern, cold artifacts were observed immediately below the bottle on the TFS-SSS images at the radioactivity levels of 9.7 and 53.9 kBq/mL. The artifacts were more evident at 53.9 kBq/mL than at 9.7 kBq/mL. In contrast, the cylindric phantom on the MCS-SSS images generated no cold artifacts at any activity concentration. However, the image generated slight high-activity artifacts around the bottle when the bottle contained significantly high radioactivity (Supplemental Fig. 1).

Typical sagittal images of phantom for activity-in-air pattern, activity-in-liquid pattern, and case without scatter correction, when bottle radioactivity levels were 0.0, 9.7, and 53.9 kBq/mL. Black arrowhead = slight high-activity artifact.
At the activity concentration of 0.0 kBq/mL, no artifacts were observed under any conditions. The activity-in-liquid pattern for TFS-SSS or MCS-SSS and the non-SC images showed no artifacts regardless of the bottle radioactivity.
Figures 3A and 3B show the percentage errors of the activity concentration in the cylindric phantom and the true activity concentration with respect to the bottle radioactivity for the activity-in-air and activity-in-liquid patterns.

(A and B) Percentage errors of activity concentration in cylindric phantom and true activity concentration with respect to bottle radioactivity. Dotted line = TFS-SSS; solid line = MCS-SSS. Open and closed symbols represent slices with and without bottle, respectively. Scatter fractions in A and B are shown in C and D, respectively. Activity-in-air pattern (A and C); activity-in-liquid pattern (B and D).
The TFS-SSS on the bottle’s slices alone resulted in significant underestimations by 18%, 36%, and 70% at the bottle radioactivity levels of 2.4, 5.1, and 9.7 kBq/mL, respectively. At higher levels of bottle radioactivity, the image activity concentrations were greater than 98% underestimated. For the slices without the bottle in TFS-SSS, the underestimation was generally within 5%, although the error was −11% at 169.7 kBq/mL. For the MCS-SSS, in contrast, the error was always within 5% at any activity concentrations.
The activity-in-liquid pattern generated different results. The error was approximately 5% at all bottle radioactivity levels regardless of the method used at all slices.
Figures 3C and 3D show the scatter fractions for the activity-in-air and activity-in-liquid patterns. For the TFS-SSS of the activity-in-air pattern, the scatter fraction increased with increasing bottle radioactivity similarly to the tendency of underestimation of the image activity concentration, and it reached 50% at the image activity concentrations with greater than 98% underestimation. For the MCS-SSS, in contrast, the scatter fractions were 14%–27%. For both the TFS-SSS and the MCS-SSS of the activity-in-liquid pattern, the scatter fractions were 18%–27%, which corresponded to those in the MCS-SSS of the activity-in-air pattern. These results indicated that the scatter fractions were reasonable for the MCS-SSS of the activity-in-air pattern.
The coefficient of variation for the TFS-SSS and MCS-SSS images was similar under any conditions, but marked differences were observed on the bottle slice in the activity-in-air pattern at high bottle-radioactivity (Supplemental Table 1). The marked differences were because the number of zero values of the image activity concentration increased with the increase in bottle radioactivity.
Human Studies
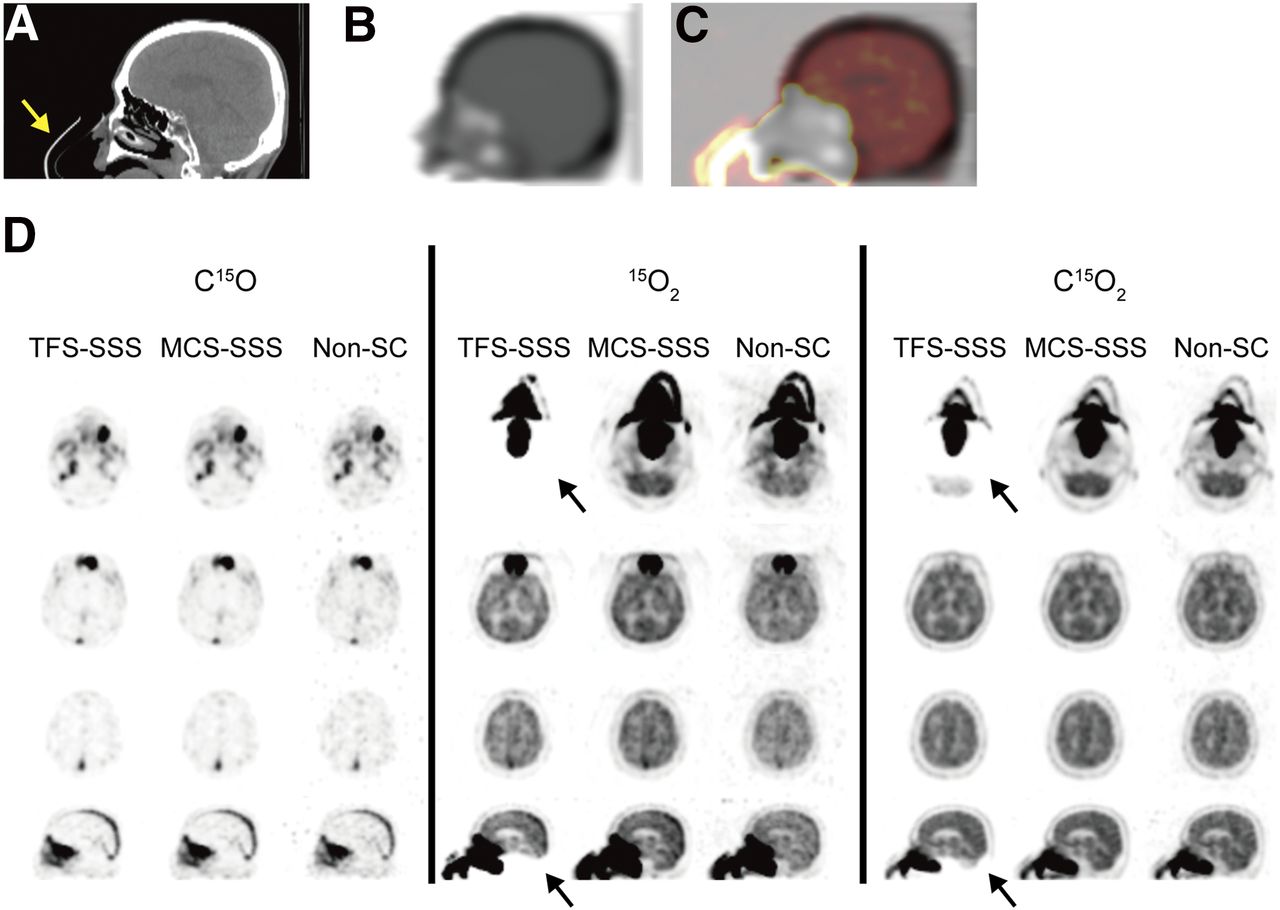
Representative CT, μ-map, and PET images of the patient case 1 are shown in Figure 4. The face mask is clearly shown in the CT image (Fig. 4A, arrow), but not in the μ-map (Fig. 4B). In the 15O2 and C15O2 PET images reconstructed by TFS-SSS, cold artifacts were generated on the slices with the face mask, underestimating the cerebellum (Fig. 4D, arrows). Figure 4C shows the C15O2 PET image superimposed on the μ-map. Radioactivity was clearly observed in the air region, and artifacts were generated at the same level. In contrast, the MCS-SSS and the non-SC image showed no artifacts. No artifacts were found on any images obtained with the inhalation of C15O regardless of the correction method used.

CT image (A), μ-map (B), image obtained by superimposing μ-map and C15O2 PET image (C), and PET images (D) of patient in case 1 in sagittal view. (D) Axial (rows 1–3) and sagittal (row 4) images of C15O, 15O2, and C15O2 PET. Yellow arrow = face mask; black arrows = cold artifacts.
The image count was significantly smaller for the slices with the face mask (slices 0–10) on the 15O2 and C15O2 PET images reconstructed by TFS-SSS than the count reconstructed by MCS-SSS (Supplemental Figs. 2B and 2C). For C15O, the image count did not decrease even on the slices with the face mask in both TFS-SSS and MCS-SSS (Supplemental Fig. 2A).
The results of the sinogram analysis, shown in Supplemental Figure 3, revealed that the scatter contribution was reasonably estimated by MCS-SSS even on the sinogram level.
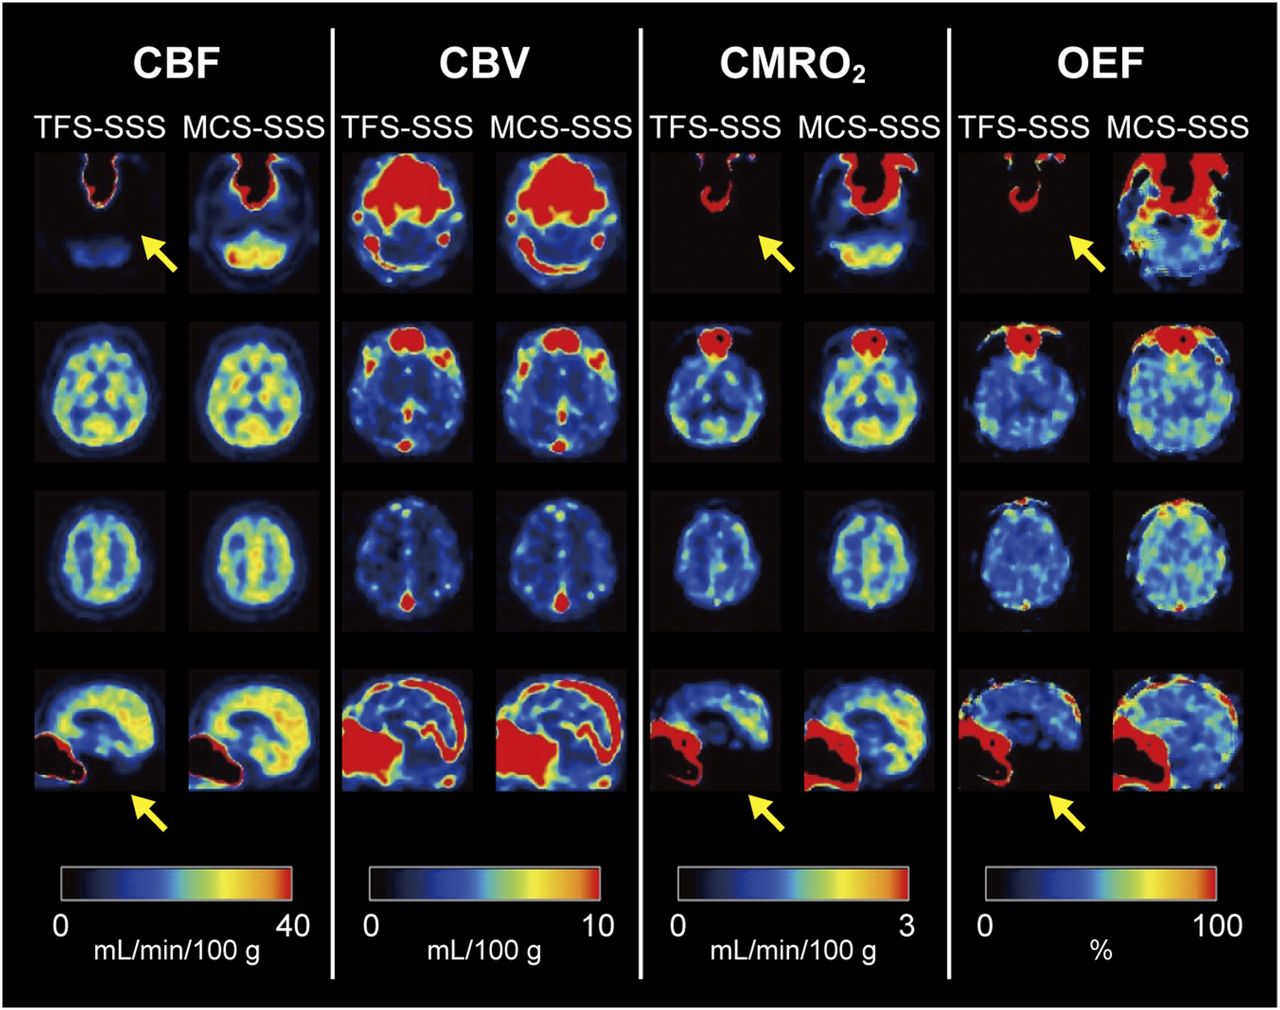
Figure 5 shows quantitative images derived from the C15O, 15O2, and C15O2 images. Cold artifacts were generated on the slices with the face mask for the CBF, CMRO2, and OEF obtained by TFS-SSS, degrading the quantitative values in the cerebellar region. In contrast, no artifacts were found on any MCS-SSS images.

Axial (rows 1–3) and sagittal (row 4) images for assessment of CBF, CBV, CMRO2, and OEF of patient case 1. Yellow arrows = cold artifacts.
We also found similar results for the other 2 patients' cases (Supplemental Fig. 4).
DISCUSSION
We evaluated the applicability of the newly developed scatter-correction algorithm (MCS-SSS) in 15O-gas brain PET. The results presented here showed that MCS-SSS accurately corrected scatters in 15O-gas brain PET using the 3D acquisition mode, preventing the generation of cold artifacts, which were observed immediately next to a face mask on the conventional method (TFS-SSS) images, and that the MCS-SSS contributed to the accurate quantitative assessment. To the best of our knowledge, this is the first report on MCS-SSS in a 15O-gas PET study.
In 3D PET imaging, typically 40% or more of the detected coincidence events encounter at least 1 Compton scattering before detection. Scatter events reduce the image contrast and degrade quantitation (18,19). SSS is currently widely used for estimating the scatter contribution in PET, which considers single Compton scattering effects calculated using the Klein-Nishina formula. The method is accurate as long as most scatter events are single Compton scatters. For a typical head imaging in the 3D acquisition mode, approximately 20% of the detected scatter events are multiple scatters (20,21). SSS should thus be scaled to compensate for the contribution from multiple scattering.
In TFS-SSS, the regions corresponding to the outside of the object on the sinogram, called the tail part, are used to estimate the scaling factor for SSS. The tail parts are determined from transmission images and are assumed to contain only the contributions from scatter events. The scaling factor is estimated by tail-fitting with the scatter contribution to the measured sinogram (22). This procedure is, however, often not robust because of incorrect selection of the tail parts, especially the small, noisy, or absent parts on the sinogram, resulting in significant fitting errors and the overcorrection of scatters (12,23,24). The MCS-SSS prevents artifact generation induced by the tail parts being smaller or disappearing (12,13).
The face mask used in the present study is made of polyvinyl chloride, and its CT value is approximately 200 Hounsfield units. Because this value is as high as that of the bone marrow in the human body, the regions can be delineated on the μ-map. However, the face mask is approximately 1 mm thick and is absent in the resultant μ-map (Fig. 4B), because the CT images are downsized to the PET matrix size, smoothed, and then converted to the μ-map by the bilinear or segment method (25,26). In this study, we designed our phantom experiments considering this phenomenon (Fig. 1, activity-in-air pattern).
The 15O-gas brain PET of the patients in this study was performed using the steady-state method. No activity existed in the face mask during the C15O PET imaging, whereas activity existed during the 15O2 or C15O2 PET imaging. In the TFS-SSS, artifacts were generated on the slices showing the face mask for the 15O2 or C15O2 PET imaging (Fig. 4D). This was because of the region with PET tracer uptake in air with a low μ-value (Fig. 4C), as similarly observed in the phantom experiments, which showed errors in scatter estimation.
In the steady-state method, the images for quantitative assessments of CBF and CBV were generated from C15O2 and C15O PET images, respectively, and those for CMRO2 and OEF assessments were generated from all C15O, 15O2, and C15O2 PET images (with CBV correction). Therefore, cold artifacts were also observed on the images for the CBF, CMRO2, and OEF assessments because the images were based on the cold artifact–containing images obtained by TFS-SSS.
In the MCS-SSS of the activity-in-air pattern, we found that the image contained slight high-activity artifacts around the bottle when the bottle contained high radioactivity (Fig. 2, Supplemental Fig. 1). The artifacts were generated probably due to the scatters, which were underestimated in the area next to the high-activity area (Supplemental Fig. 5). Thus, high-activity material such as the face mask must be positioned as distantly from the brain as possible. From the results of our phantom experiments, the underestimated scatters were minimal at more than 135 mm from the high-activity area. In the patient studies, the underestimation of scatters would be negligible because the distance between the face mask and the brain is approximately 130–170 mm.
In general, cold artifacts are generated during attenuation correction by the spatial deviation of CT and PET data due to respiratory motion and heart beating (27,28). In our phantom experiments, neither artifacts generated from the errors of attenuation correction nor those generated from errors of activity concentration were observed when the bottle radioactivity was 0.0 kBq/mL, as shown in Figures 2 and 3A. Hence, the effect of attenuation by water in the bottle is negligible.
A previous investigation showed that the misregistration in whole-body PET/CT caused by arm motion induced errors of scatter correction by TFS-SSS and generated cold artifacts similar to those created in 15O-gas brain PET (24). The MCS-SSS would likely be advantageous in whole-body imaging.
TFS-SSS estimates the scaling factor in slice-by-slice and tilt-by-tilt manners, whereas MCS estimates the factor from the entire volume. A disadvantage of MCS-SSS is that it may not be accurate when the activity distribution abruptly changes at the FOV boundaries in a 1-bed position study (i.e., for the head and neck region), because the number of scatter events also depends on the activity distribution beyond the axial FOV.
The limitations of this study are as follows. First, we did not compare our present findings with those obtained in the 2D acquisition mode. However, most commercially available PET/CT scanners are dedicated to 3D acquisition. Such a scanner was used in this study, and a comparison with the 2D acquisition mode was not possible. Second, we did not consider the effect of placing the face mask and the 15O-gas-supplying tube outside the FOV. Teuho et al. showed that the error between MCS-SSS and TFS-SSS did not differ significantly regardless of an outside external radiation source (13), but they did not assume the use of 15O-gas PET studies. Further investigations are needed to address this limitation.
CONCLUSION
In the TFS-SSS, cold artifacts were observed on the images containing the region with PET tracer uptake from air with a low μ-value, that is, the face mask for collecting 15O-gas. The generation of such artifacts was prevented by MCS-SSS, which does not require the detection of the tail parts on sinograms in the scaling algorithm. Our results suggest that using MCS-SSS enables accurate scatter correction and helps increase the quantitative accuracy in 15O-gas brain PET using the 3D acquisition mode.
DISCLOSURE
This work and the Windows-PC for MCS-SSS correction at Hokkaido University were funded through a sponsored research agreement with Philips Healthcare. Only non-Philips employees had control over the inclusion of data and information that might present a conflict of interest for the authors who are Philips employees. No other potential conflict of interest relevant to this article was reported.
Acknowledgments
We thank Kouichi Nitta and Nobuyuki Kayanuma from Hitachi, and Keisuke Fukuda, Teruki Iguchi, and Ko Higuchi from Philips Electronics Japan. We also thank the staff of the Department of Nuclear Medicine, Hokkaido University Graduate School of Medicine.
Footnotes
Published online Jun. 23, 2017.
- © 2017 by the Society of Nuclear Medicine and Molecular Imaging.
REFERENCES
- Received for publication March 10, 2017.
- Accepted for publication June 8, 2017.


Jump to section
Related Articles
Cited By...
- No citing articles found.