


Abstract
Cardiac PET combined with CT is rapidly expanding despite artifactual defects and false-positive results due to misregistration of PET and CT attenuation correction data—the frequency, cause, and correction of which remain undetermined. Methods: Two hundred fifty-nine consecutive patients underwent diagnostic rest–dipyridamole myocardial perfusion PET/CT using 82Rb, a 16-slice PET/CT scanner, helical CT attenuation correction with breathing and also at end-expiratory breath-hold, and averaged cine CT data during breathing. Misregistration on superimposed PET/CT fusion images was objectively measured in millimeters and correlated with associated quantitative size and severity of PET defects. Misregistration artifacts were defined as PET defects with corresponding misregistration on helical CT-PET fusion images that resolved after correct coregistration using a repeat CT scan, cine CT averaged attenuation during normal breathing, or shifted cine CT data that coregistered with PET data. Results: Misregistration of standard helical CT PET images caused artifactual PET defects in 103 of 259 (40%) patients that were moderate to severe in 59 (23%) (P = 0.0000) and quantitatively normalized on cine or shifted cine CT PET (P = 0.0000). Quantitative misregistration was a powerful predictor of artifact size and severity (P = 0.0000), particularly for transaxial misregistration >6 mm occurring in anterior or lateral areas in 76%, in inferior areas in 16%, and at the apex in 8% of 103 artifactual defects. Conclusion: Misregistration of helical CT attenuation and PET emission images causes artifactual defects with false-positive results in 40% of patients that normalize on cine CT PET using averaged CT attenuation data during normal breathing comparable to normal breathing during PET emission scanning and shifting cine CT images to coregister visually with PET.
Cardiac PET is an expanding noninvasive technology for identifying flow-limiting stenosis of coronary arteries, for assessing their severity as the basis of invasive procedures, for risk stratification, or for following progression or regression of coronary artery disease (CAD) after intense risk factor treatment that also predicts coronary events (1–15). Mild reductions in relative coronary flow reserve by PET indicate early nonobstructive or diffuse CAD as the basis for treatment before significant stenosis develops (9). These applications of PET perfusion imaging require accurate, reliable differentiation of small regional differences in relative myocardial radionuclide uptake (9,10).
Although thoracic and cardiac PET/CT has proven feasible, misregistration of attenuation and emission images causes artifactual abnormalities on cardiac PET images that are false-positive defects (16–24) or may artifactually worsen the severity of real perfusion defects. Misregistration of CT attenuation correction and PET emission data with associated artifactual PET defects is due to momentary helical CT “snapshots” at some point in the respiratory cycle of changing attenuating thoracic–diaphragmatic structures during breathing. The brief CT snapshots commonly do not match the actual average attenuation of the constantly changing thoracic–diaphragmatic structures over longer emission scans during normal breathing. This potentially major clinical limitation has not been definitively defined or resolved for current clinical protocols with commercially available cardiac PET/CT scanners and software. Thus, for PET/CT, the brief CT transmission data for attenuation correction are fundamentally different from earlier PET scanners using a rotating rod source for transmission data acquired slowly during normal breathing comparable to emission data acquisition.
Consequently, we examined the frequency, causes, consequences, and corrections of misregistration artifacts in current cardiac PET/CT protocols and software not previously reported, despite adverse effects on diagnostic accuracy.
MATERIALS AND METHODS
Study Patients
Two hundred fifty-nine consecutive patients undergoing diagnostic myocardial perfusion rest–dipyridamole PET/CT for potential CAD or follow-up imaging were analyzed at The Weatherhead PET Center for Preventing and Reversing Atherosclerosis of the University of Texas Medical School at Houston. All subjects signed an informed consent approved by the Committee for the Protection of Human Subjects of the University of Texas Health Science Center.
PET
Patients were instructed to fast for 4 h and abstain from caffeine, theophylline, and cigarettes for 24 h before the study. PET/CT was performed using a Discovery ST 16-slice PET/CT multislice bismuth germanate tomograph (GE Healthcare) in 2-dimensional mode with extended septa at a reconstructed in-plane resolution of 5.9-mm full width at half maximum (FWHM). Patients were positioned in the scanner using laser guides aligned to the base of the throat and confirmed by a CT scout scan. External body markers were used to check correct position throughout data acquisition. CT transmission scans were obtained as detailed below. Emission images were then obtained over 6 min after intravenous injection of 1,295–1,850 MBq (35–50 mCi) of generator-produced 82Rb and contained 24–60 million total counts, of which 12–30 million were true coincidence counts.
Immediately after completing the resting 82Rb scan, dipyridamole (0.142 mg/kg/min) was infused for 4 min. At 4 min after completion of the dipyridamole infusion, the same dose of 82Rb was given intravenously. Emission image acquisition was started at 70 s after the beginning of 82Rb infusion or 80 s after the beginning of infusion for patients with heart failure or heart rates below 55 beats per minute. After completion of stress emission imaging, a second helical CT transmission scan was obtained. For angina induced by dipyridamole, aminophylline (125 mg) was given intravenously.
The first 145 consecutive patients were imaged using helical CT attenuation correction of the PET data to determine the extent and causes of misregistration associated with artifactual PET defects as falsely positive studies. Helical CT transmission scans were obtained at 120 kV and 100 mA over 29 s during normal breathing in a subset of patients or over 4 s at end-expiratory breath-hold in another subset of patients. For the next 114 consecutive patients, in addition to the short end-expiratory helical CT, cine CT during normal breathing was added to the helical CT protocol. These subsets of patients served to compare quantitatively the extent of misregistration and associated artifactual defects between PET images reconstructed with helical CT attenuation correction data at end expiration and images reconstructed with cine CT averaged attenuation correction data during breathing in the same patient.
Imaging Protocols, Data Acquisition, and Attenuation Correction
After positioning in the gantry, patients had a CT scout scan using 120 kV and 10 mA in anterior–posterior format to bracket the heart. A cine CT scan for average CT attenuation correction was acquired during normal breathing at rest; this was followed by a helical CT scan at end expiration. Perfusion imaging of 82Rb was then obtained at rest and after dipyridamole stress; this was followed by another cine CT scan during normal breathing for stress average attenuation correction and another helical CT scan. The total time for a complete rest–stress study averaged 40 ± 6 min (mean ± 1.0 SD).
Cine-mode data acquisition is one of the 3 optional data acquisitions on the Discovery PET/CT scanner that include axial, helical, and cine modes. The helical CT acquisition used 120 kVp, x-ray collimation of 16 by 1.25 mm, gantry rotation of 0.5 s, and helical pitch of 1.75:1. The radiation exposure was 5.7 mGy for the helical CT scan.
The cine CT scan used 120 kVp, x-ray collimation of 8 by 2.5 mm, gantry rotation cycle of 0.5 s, cine duration of 10 s, and 14-cm coverage. Each reconstruction used 360° of CT data over 0.5 s. The cine data acquisition lasted for 78 s, of which 70 s was for 7 cine CT acquisitions of 10 s each and 8 s was for 6 table translations of 2 cm each between 2 cine CT acquisitions. Tube current for cine CT was 10 mA for patients weighing <100 kg, 15 mA for 100–130 kg, and 20 mA for >130 kg. The radiation dose and effective dose equivalent for cine CT were 10 mGy and 2.36 mSv, respectively, for tube current of 10 mA. For each cine CT scan, there are 1,232 CT images reconstructed 2 min after the cine CT acquisition and 22 images per slice location during normal respiration before averaging into an average CT image over several breathing cycles. The processing time for an averaged cine CT attenuation scan was <1 min.
Interpolation of the average CT attenuation data was performed to make the average CT images align at the locations of the PET slices for attenuation correction of the PET data and for evaluating registration between the average CT image and the PET images corrected with the average CT attenuation data. In view of the inherent blurring introduced by the average CT but not by the helical CT data, we applied 4- and 10-mm FWHM gaussian filtering on the average CT and helical CT data, respectively, before CT attenuation correction of the PET data.
Software was also developed to shift the averaged cine CT data in horizontal and vertical directions in the transaxial plane and in the superior–inferior or z-axis direction of different planes to align the CT heart borders visually with the PET data to achieve good coregistration. The average cine CT slices shifted to match the PET slices are saved for repeat reconstruction of the PET images using the shifted average attenuation correction data. The cine CT PET has been previously described for cancer imaging (21), here adapted to cardiac imaging with the shift software.
Analysis of PET Images
Images were reconstructed using filtered backprojection with a Butterworth filter having a cutoff of 0.55, roll-off of 10, and pixel size of 3.27 × 3.27 mm. Fusion images were made by superimposing attenuation-corrected emission and CT transmission scans in horizontal, coronal, and sagittal views. Misregistration of CT and PET images was quantified in millimeters for comparison with quantitative size and severity of regional perfusion defects on PET images corresponding to the regions of misregistration on the PET/CT fusion display.
After attenuation correction, reconstructed PET emission images in DICOM (Digital Imaging and Communications in Medicine) format were exported to a Sun Ultra 60 workstation of a mPower-HZL PET scanner (Positron Corp.) for reorientation into long- and short-axis tomographic and topographic 3-dimensional (3D) displays using previously described automated quantitative software (1–10) for comparison with our earlier report on misregistration artifacts in PET using a rotating rod transmission source for attenuation correction (20). Quantitative data from 82Rb and 18F phantoms imaged on the GE Healthcare scanner are quantitatively and accurately exported to the Positron scanner and software for automated quantitative analysis and display of PET images.
A 3D restructuring algorithm generates true short- and long-axis views from reconstructed PET transaxial cardiac images, perpendicular to and parallel to the long axis of the left ventricle. From the tomographic data, circumferential profiles are used to reconstruct 3D topographic views of the left ventricle showing relative regional activity distribution divided into lateral, inferior, septal, and anterior quadrant views of the 3D topographic display corresponding to the coronary arteries as previously described (4–10,20).
Mean activity in each quadrant is normalized to the maximum 2% of pixels in the whole heart dataset. Regions of each quadrant are identified having values outside 2.0 SD and 2.5 SD (97.5% confidence intervals [CI]) outside normal values of 50 healthy volunteers with no risk factors by complete medical history (no hypercholesterolemia, hypertension, diabetes, smoking, obesity, drug or alcohol abuse, other systemic diseases, or family history of CAD). Percentages of circumferential profile units outside 2.0 SD and 2.5 SD were calculated automatically for each quadrant and the whole heart.
Severity of a perfusion defect is quantified as the average relative uptake in a defined quadrant or the lowest quadrant average relative activity—that is, the average relative activity for the quadrant having the lowest average activity of anterior, septal, lateral, and inferior quadrants for each subject, expressed as percentage of the highest 2% of activity in the image dataset. Size of perfusion defects is quantified as percentage of the whole cardiac image outside 2.0 SD or 2.5 SD or 97.5% CI of healthy control subjects in each quadrant and whole heart. Combined size and severity of perfusion defects is defined as percentage of the whole cardiac image with relative activity of <60% of maximum activity (100%), which is 3.0 SD below mean maximum activity of healthy control subjects.
Misregistration Artifacts
On fusion images of helical CT PET and separately of cine CT PET, electronic calipers were used to measure the distance in millimeters between the cardiac border on the PET image and the cardiac border on the CT image in the horizontal plane of maximal misregistration on transaxial and coronal views and in the vertical or z-axis of the coronal view. In addition, on the coronal view, the distance was measured from the zero reference position of helical and cine CT scans to the dome of the right diaphragm to determine systematically the effects of diaphragmatic position on misregistration artifacts.
On PET perfusion images, artifactual abnormalities due to misregistration were defined as criteria (i) plus (ii), (iii), or (iv) as follows:
(i) The defect on the PET image was associated with a corresponding area of misregistration on the superimposed CT transmission and PET emission fusion scans.
(ii) An abnormality on the resting CT PET scan associated with misregistration disappeared, and the image normalized with correct coregistration of CT and PET emission data on the stress PET scan.
(iii) The abnormalities on the helical CT PET scans at rest or stress disappeared, and the image normalized with correct coregistration of CT and PET emission data on the cine CT PET scan or when the misregistration was corrected by shifting the cine CT scan to coregister visually with the PET scan.
(iv) The abnormality on helical CT PET disappeared on an additional separate rest–stress study repeated on the next day using an mPower-HZL standard PET scanner with a rotating rod transmission source and shift software to ensure correct registration of emission and transmission data as previously documented (20).
Therefore, to be counted as having an abnormality due to PET/CT misregistration, every patient with abnormal helical CT PET at rest or stress had to have a stress perfusion study with no significant regional defect after correct PET/CT coregistration. Any patient with a defect that persisted on stress PET/CT images or after correct coregistration that was outside 2 SD of healthy subjects was classified as having a “real” defect, not an artifact, even if the defect improved after correct registration. Therefore, our observed prevalence of abnormalities due to PET/CT misregistration is a conservative underestimate.
For PET scans meeting the above criteria for misregistration artifacts, the severity, size, and combined size–severity of perfusion abnormalities in the same quadrant as the CT PET misregistration were objectively quantified by automated software. In addition to automated measures of defect size and severity, the perfusion abnormalities due to CT PET misregistration were visually graded according to the relative color scale bar by 2 independent readers, who were unaware of clinical information, as none (white or red), mild (yellow), moderate (green), or severe (blue) in the same quadrant for which misregistration was measured.
Statistical Methods
Statistical analyses were performed using SPSS version 11.5 (SPSS Inc.) for multivariate linear regression analysis, for multivariate logistic regression analysis, and for significance of differences in continuous variables among groups determined by a paired or unpaired 2-tailed t test with data reported as mean ± 1 SD. A Pearson χ2 analysis was performed for discrete variables. A 2-tailed P value < 0.05 was considered statistically significant.
RESULTS
Figure 1A illustrates an abnormal PET scan with a mild-to-moderate anterior and lateral defect (top row) due to misregistration of helical CT transmission and PET data. This defect disappears and the image normalizes after repeat reconstruction using cine CT attenuation correction (bottom row). Figure 1B shows the corresponding helical CT-PET fusion images with severe misregistration in transaxial and coronal views but good coregistration on the cine CT-PET fusion images (Fig. 1C). The magnified inset illustrates quantification of misregistration in the transaxial view using an image caliper, 12 mm in this example.
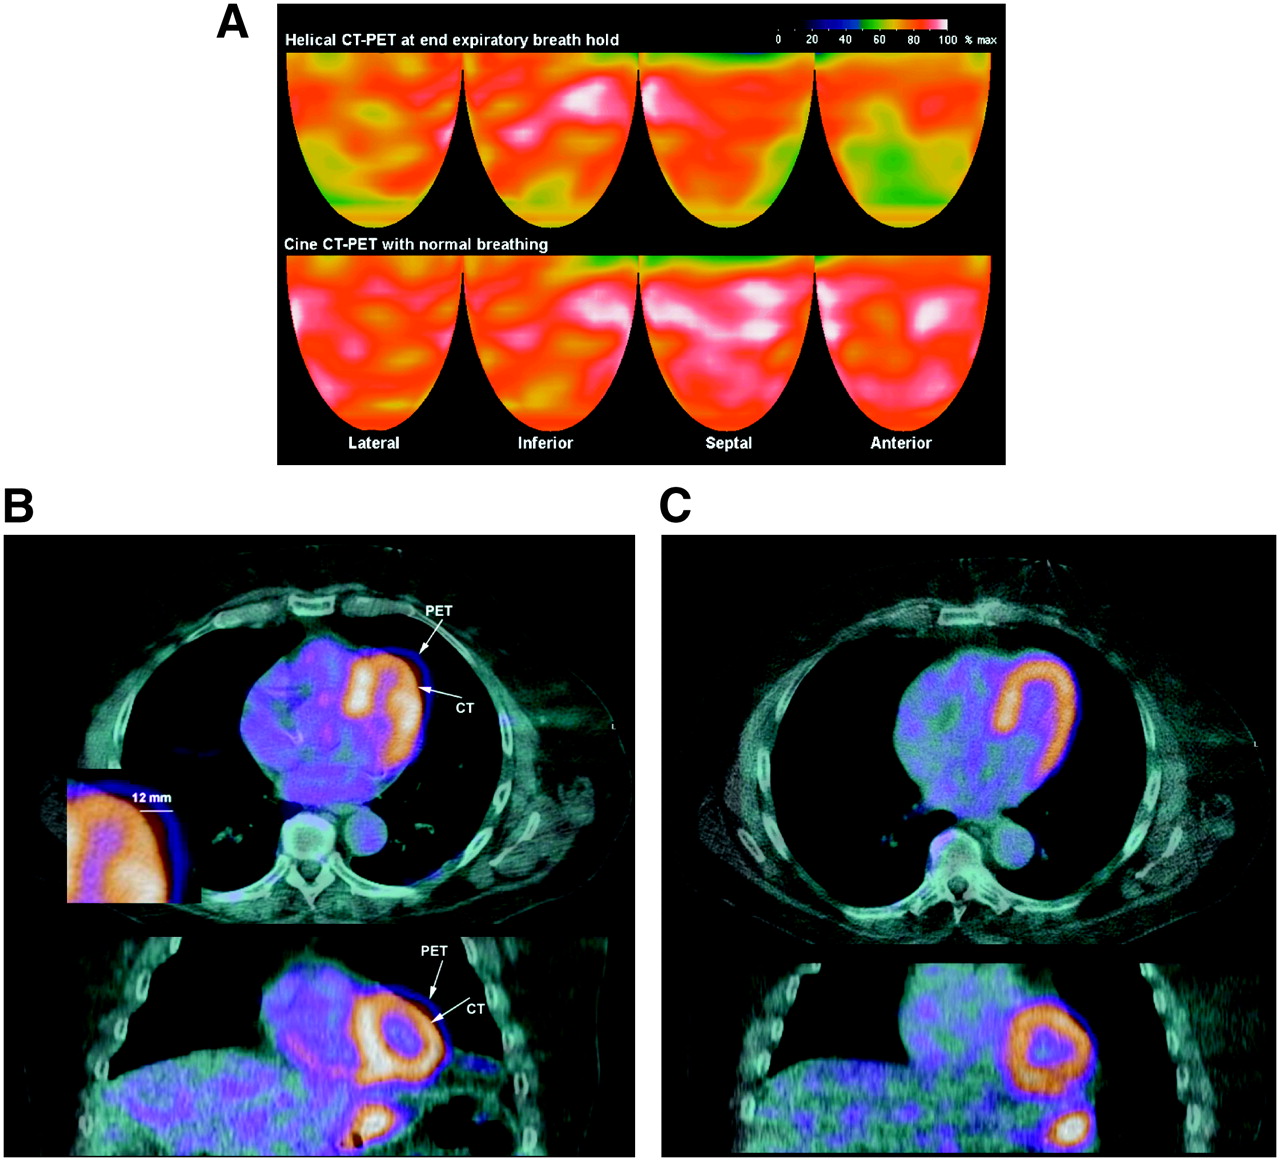
(A) Topographic 3D displays of helical CT PET with a mild-to-moderate anterior and lateral defect (top row) that is not present on cine CT PET (bottom row). White indicates the highest myocardial uptake of 82Rb, reflecting the highest myocardial perfusion, with red being the next highest and progressively lower perfusion indicated by color gradations from red to yellow, green, and blue. (B) For same patient as in A, misregistration on helical CT-PET fusion images in transaxial (top) and coronal (bottom) views. Arrows indicate heart borders on helical CT and PET emission images as unmatched, with region of misregistration corresponding to area of artifactual defect. Magnified inset illustrates quantification of misregistration in transaxial view—here, 12 mm—using an electronic caliper on the screen. (C) For same patient, cine CT-PET fusion images show good coregistration associated with no defect and a normal scan.
The quantitative extent of misregistration of the helical CT attenuation correction data and the PET emission data is analyzed on a per-patient basis by χ2 analysis in Table 1. With misregistration of >6 mm on the transaxial fusion images of helical CT and PET emission images, the PET perfusion scan showed artifactual defects that were significant diagnostic errors in 103 of 259 (40%) patients (P = 0.0000). Transaxial misregistration of >6 mm frequently caused artifactual defects with the proportion of moderate-to-severe artifactual defects progressively increasing for misregistration of 6–10 mm and for >10 mm.
All Patients
Of 259 patients, 137 were classified as having real perfusion abnormalities outside 2 SD of healthy subjects that persisted after correction of PET/CT misregistration or on the stress PET and, therefore, were not counted as artifactual abnormalities. The remaining 122 patients with no persisting defects after stress or after correct PET/CT coregistration were analyzed quantitatively to compare those with and without misregistration artifacts (as defined in Materials and Methods). For quantitative data in Table 2, these strict criteria removed patients with real defects outside 2 SD of healthy control subjects on the final averaged cine or averaged cine shifted stress CT PET images, thereby eliminating the bias of real defects on quantification of the artifactual defects due to misregistration. Visually mild, moderate, and severe artifactual defects (as defined in Materials and Methods) showed statistically significant progressive worsening in severity, in combined size–severity, in size as percentage <2 SD and in size as percentage <2.5 SD of healthy subjects with severity of PET/CT misregistration in millimeters.
Size and Severity of Misregistration Artifacts
In 59 patients (23% of the 259), the artifactual defects due to misregistration on helical CT PET images were moderate to severe and significantly outside normal limits for quantitative severity, size, and combined size–severity. This prevalence of artifactual abnormalities due to PET/CT misregistration is a conservative underestimate of true prevalence because a real defect in any patient outside 2 SD of healthy subjects that persisted on stress images was not counted as an artifactual defect even if it improved after correct PET/CT registration.
Logistic multivariate regression analysis was done with the 3 misregistration measurements in millimeters (transaxial x-axis, coronal horizontal x-axis, and coronal vertical z-axis) as independent variables, with the dependent variable being separately either any artifact or only moderate-to-severe artifacts. Transaxial misregistration (x-axis) predicted misregistration artifactual defects so completely (coefficient of regression analysis, B = 0.94, P = 0.0000) that the other measurements added no more predictive power.
Similarly, multivariate regression analysis was done with the 3 misregistration measurements as independent variables and the dependent variable being separately the severity (mean quadrant activity), size (percentage outside 2.5 SD), or combined size–severity (percentage of the left ventricle outside 60% of maximum activity) of the abnormalities due to PET/CT misregistration. The coronal horizontal (x-axis) misregistration measurement was such a strong predictor of the 3 quantitative measures of defect severity (B = 2.23 for combined size–severity, B = 0.96 for severity, B = 0.59 for percentage outside 2.5 SD; for all, P = 0.0000) that other misregistration measurements added no predictive power. These results indicate that the 3 misregistration measurements are closely related such that the x-axis misregistration in either the transaxial or coronal view is a complete predictor of artifactual defects.
For patients with both helical and cine CT PET (Table 3), the artifactual defects due to misregistration of helical CT attenuation and PET emission data were markedly reduced by using the averaged cine CT data acquired during normal breathing that is comparable to the PET emission acquisition during normal breathing. Compared with all patients, this quantitative improvement was even greater for the subset of patients with artifactual defects due to PET/CT misregistration, excluding those with real defects as defined above. Transaxial PET/CT misregistration in millimeters was significantly less with cine CT PET compared with helical CT PET.
Patients with Both Helical and Cine CT PET
Diaphragm position was significantly lower on averaged cine CT images than on helical CT at end expiration, indicating that the diaphragm at end expiration was higher than the average diaphragmatic position during breathing. This higher diaphragmatic position at end expiration caused more misregistration artifacts than slower helical CT during breathing and more than averaged cine CT during breathing as detailed below.
Most misregistration defects were anterior or lateral (76%) associated with corresponding anterior or lateral misregistration on the CT-PET fusion images. The remainder had inferior (8%) or apical (16%) abnormalities due to inferior or apical misregistration of helical CT PET or different diaphragmatic position during the helical CT compared with the diaphragm position on the cine CT average attenuation scan that resolved the artifactual defect. Both the artifactual defects and their associated misregistration on helical CT-PET fusion images resolved on cine CT PET in most cases.
However, of the 114 patients with both helical CT and cine CT PET, 22 (19%) had persisting artifactual defects with persisting PET/CT misregistration on the cine CT-PET fusion images. For these patients, the cine CT data were shifted to achieve proper visual coregistration with the PET images that were then reconstructed again with the shifted cine CT attenuation data. With this final coregistration, the artifactual defect disappeared and the images normalized.
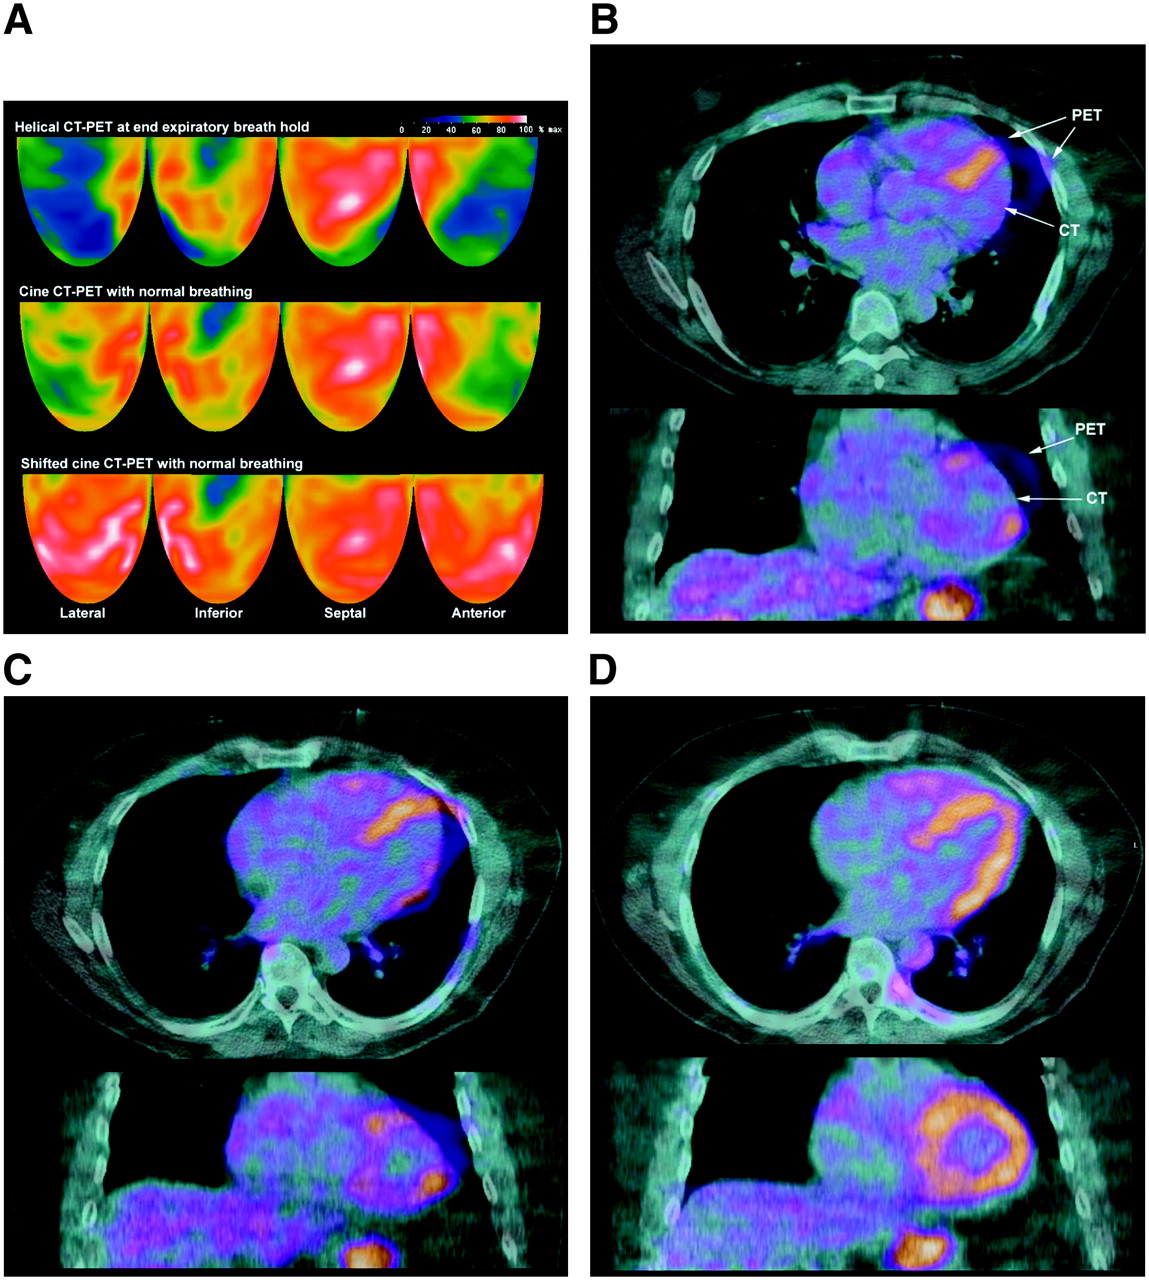
Figure 2A illustrates severe anterior, apical, lateral, and basal inferior defects on the helical CT PET (top row) that remained but were less severe on cine CT PET (middle row). The anterior, apical, and lateral defects resolved only on the shifted cine PET/CT (bottom row) that achieved proper coregistration. However, the basal inferior defect persisted with correct registration, indicating right coronary stenosis, confirmed by coronary arteriography with no stenosis of the left coronary artery. Figures 2B–2D show the corresponding misregistration on the helical CT PET and cine CT-PET fusion images but no misregistration on the shifted cine CT-PET fusion images.

(A) Topographic 3D displays of helical CT PET with severe anterior, apical, lateral, and basal inferior defects (top row) that are also present but less severe on cine CT PET (middle row). Anterior, apical, and lateral defects normalize on shifted cine CT PET (bottom row). (B) For same patient as in A, helical CT-PET fusion images in transaxial (top) and coronal (bottom) views show marked misregistration. Arrows indicate heart borders on helical CT and PET emission images as unmatched, with region of misregistration corresponding to area of artifactual defect. (C) For same patient, cine CT-PET fusion images also show misregistration. (D) For same patient, shifted cine CT-PET fusion images with no misregistration associated with disappearance of artifactual anterior, apical, and lateral artifactual defects.
Of the 22 patients in whom cine CT failed to correct misregistration, 8 of the 114 patients with both helical CT and cine CT PET (7%) showed more severe misregistration on cine CT PET than on helical CT PET, with a corresponding more severe artifactual defect on cine CT PET images. These 8 artifactual defects were corrected by reconstructing the PET images after shifting the cine CT average attenuation images to coregister visually with the PET images with corresponding quantitative improvement and normalization of the images (Table 4).
Patients with Cine CT PET Having Worse Misregistration Artifactual Defects than with Helical CT PET Corrected by Shifting Cine CT Data
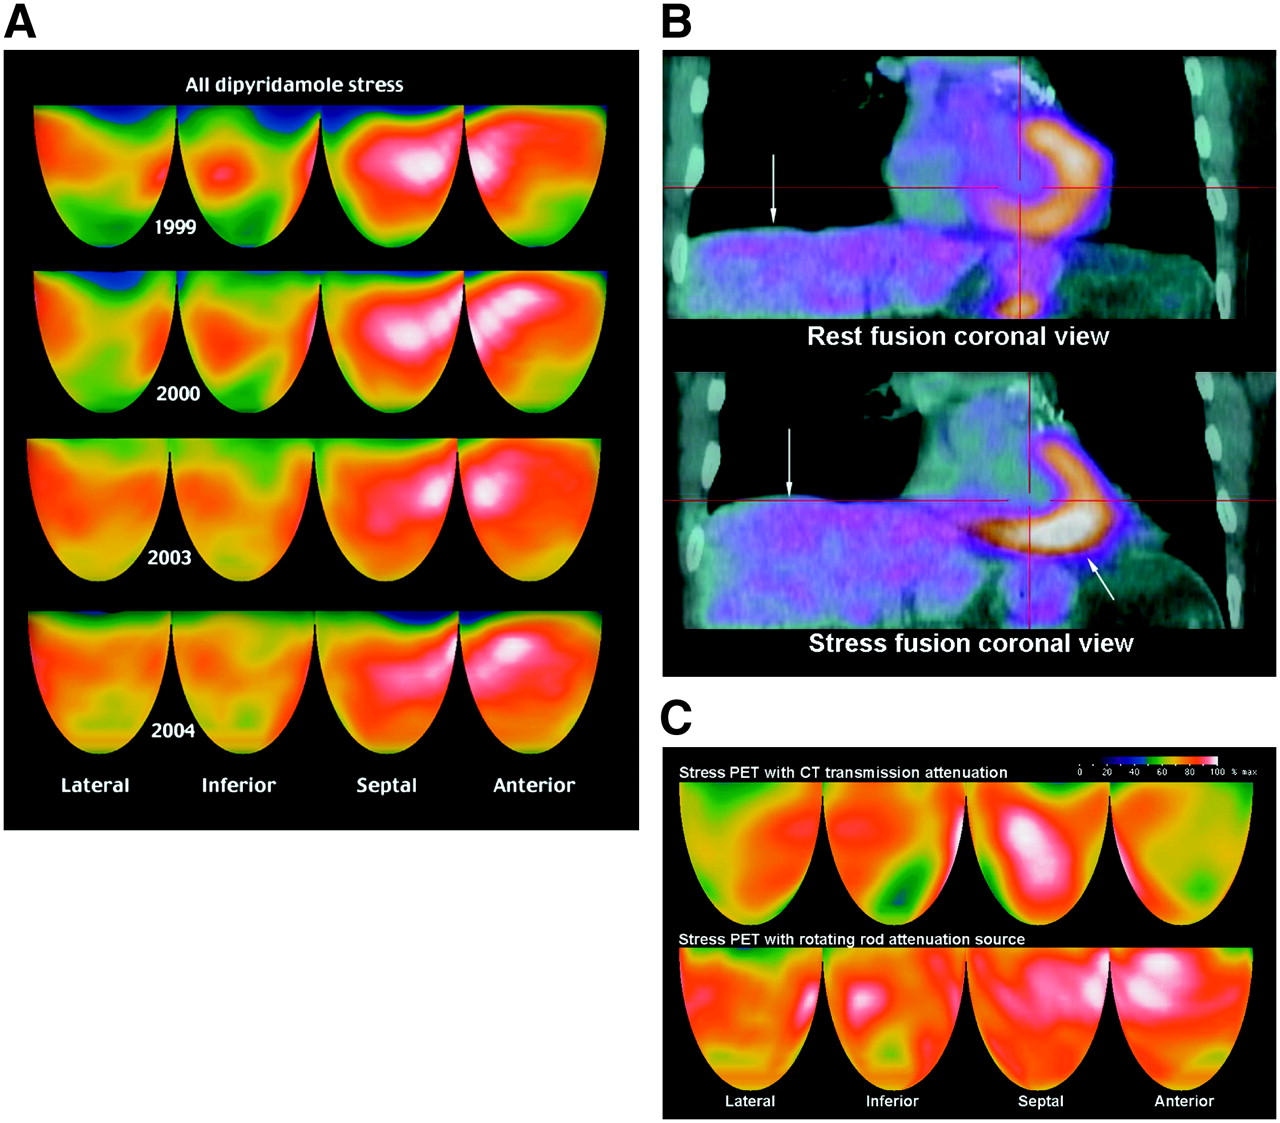
Artifactual defects may also be caused by the diaphragm being in a different position during helical CT and PET despite good coregistration of the heart borders on CT-PET fusion images (Fig. 3), obtained before cine CT was available. In this patient with known CAD, the rest–dipyridamole PET of 1999 with a rotating rod attenuation source showed moderately severe regional stress perfusion defects that improved at yearly follow-up after intense medical treatment (Fig. 3A).

(A) Stress perfusion images at yearly intervals using a Positron PET scanner with rotating rod transmission source show progressive improvement on a strict lifestyle and medical regimen. (B) For same patient as in A, rest and stress helical CT-PET fusion images at follow-up in 2006 were acquired during normal breathing before cine CT was available. Diaphragm–heart mismatch (arrows) on stress fusion image caused attenuation overcorrection inferiorly and associated relative anterior defect on stress PET despite borders of heart being properly coregistered on both rest and stress perfusion images (see text). (C) For same patient, follow-up stress perfusion helical CT PET images in 2006. Diaphragm–heart mismatch on stress fusion image shown in B caused artifactual anterior, lateral, and inferoapical defects (top row) that disappeared on repeated stress scan using Positron PET scanner with a rotating rod attenuation transmission source (bottom row) and correct coregistration.
In 2006, on the same regimen with no symptoms or change in clinical status or medications, follow-up helical CT PET showed apparent marked worsening with new, moderately severe anterior and distal inferior stress defects not present previously. Helical CT-PET fusion images showed proper coregistration of heart borders but demonstrated a markedly different heart-to-diaphragm relation (Fig. 3B). The heart is in the same location on both rest and stress CT and PET scans according to the CT reference position marked by the red cross-hairs. However, because the patient was breathing, the diaphragm on the stress helical CT is much higher relative to the heart on the stress fusion image, whereas the heart on the stress PET image remained unchanged from rest.
This diaphragm–heart mismatch on the stress fusion image caused attenuation overcorrection inferiorly and an associated relative anterior defect on the stress PET. In addition, the stomach air bubble is higher on the expiratory helical CT than the inferior heart border on the emission scan, thereby creating a small strip of inferior attenuation undercorrection despite the rest of the inferior half of the heart being overcorrected.
To resolve the question of severe worsening before cine CT was available for this patient, the PET study was repeated on the next day with the same rest–dipyridamole protocol, same medications, and same dose of 82Rb but on the Positron PET scanner with a rotating rod attenuation source. This repeat rest–stress study showed no misregistration and no significant stress-induced perfusion defects and was similar to the earlier PET scans, displayed for comparison with the helical CT PET of the prior day in Figure 3C. The absence of significant perfusion defects after correct coregistration indicates artifactual defects on the earlier PET/CT.
We also examined the frequency of artifactual defects due to misregistration in patients with slow 29-s helical CT scans during breathing compared with different patients with fast 4-s helical CT scans during end-expiratory breath-holding. Slow helical PET/CT during breathing had significantly fewer artifactual defects due to misregistration than fast helical PET/CT at end-expiratory breath-hold (Table 5). In addition, the artifactual defects with slow helical CT PET during breathing were of a different type associated with layering of the CT data and multiple diaphragm and heart border fragments, which caused jagged notched layers of CT attenuation correction data. Correspondingly, the artifactual defects consisted of jagged, irregular linear notches or bites out of the resting CT and PET perfusion images as illustrated in Figure 4.

(A) Resting CT transmission image acquired over 29 s with normal breathing shows “motion layering” of CT scan (top row). Helical CT-PET fusion image demonstrates a corresponding notching of attenuation (arrows) and notched undercorrection of PET data. (B) For same patient as in A, corresponding rest–stress 3D topographic display has linear anterior and lateral artifacts (arrows) on rest emission scan caused by motion layering on resting CT scan, not present on stress scan. Mild inferior defect is not associated with any misregistration but is due to diffuse atherosclerosis of posterior descending coronary artery.
Patients with Slow Helical CT over 29 Seconds During Breathing Compared with Patients with Fast 4-Second Helical CT at End-Expiratory Breath-Holding
DISCUSSION
This study demonstrates artifactual defects on cardiac helical CT PET in 40% of patients that are false-positive results. These artifactual defects are of 3 types: (a) PET/CT misregistration, (b) diaphragm–heart PET/CT mismatching, and (c) layering of helical CT data seen with slow helical CT scans during breathing. These misregistration abnormalities are due to short helical CT snapshots in the respiratory cycle of attenuating structures that fail to match the average attenuation of constantly changing thoracic–diaphragmatic structures during breathing over longer emission scans. They can be recognized and quantified on superimposed CT PET fusion images and corrected by cine CT PET protocols or by software for shifting the averaged cine CT data to coregister visually with the PET images.
Although slow helical CT scans during breathing have somewhat less-frequent artifactual defects than fast helical CT scans at end expiration, the layered attenuation data of the long helical CT during breathing distorts the PET images in a way that cannot be corrected by shifting the CT data to coregister with the PET data. Similarly, shifting the short helical CT data at end expiration to coregister with the PET data is also unsatisfactory because CT attenuation is greater during expiration and, therefore, causes attenuation overcorrection compared with the average attenuating structures during breathing as measured by cine CT during breathing.
Compared with our earlier study of PET attenuation misregistration using a rotating rod attenuation source during breathing, artifactual defects in helical CT PET are more frequent, more severe, and more complex. Preventing or correcting these artifactual defects in PET/CT requires cine CT and software for shifting the CT data to visually coregister with the PET data when needed.
Some early thoracic or cardiac studies on small numbers of patients reported satisfactory CT attenuation correction of PET emission data (16,19,22,23), whereas others reported problems of misregistration (17,18,24). A recent study on 28 patients reported substantial artifactual perfusion defects due to misregistration of PET/CT data in 21% of subjects (24). Visual realignment of PET/CT data to achieve coregistration eliminated the artifactual perfusion defects. However, our results indicate that a helical CT scan at one moment during the respiratory cycle may not fit the average attenuating structures during breathing of emission imaging even after visually matching the lateral heart borders.
Moreover, variable attenuation correction associated with respiratory motion causes marked heterogeneity in measurements of myocardial radionuclide uptake (22). Therefore, measurements of absolute myocardial perfusion in mL/min/g by PET/CT are appropriate only if the primary radionuclide update data are correctly obtained using cine or shifted cine CT attenuation correction that matches the average attenuation structures of emission data during breathing. We believe that the relatively poor specificity reported for PET/CT (13) is due to misregistration artifacts as no protocol for correcting misregistration of PET/CT data was described in that study.
One criticism of our study may be the lack of coronary arteriography to document the absence of stenosis. However, invasive coronary arteriography is not justified for a defect in a region of PET/CT misregistration that disappears after repeat reconstruction using correctly coregistrered CT attenuation data, particularly in view of well-documented inaccuracies of visually interpreted coronary arteriograms.
Our software implementation is applicable to all Discovery PET/CT scanners without any additional hardware. GE Healthcare provides an expensive hardware upgrade of their PET/CT console to the Dimension console that achieves some of the functions reported here. However, the Dimension console averages combined helical and cine CT data for attenuation correction, provides no average cine CT images for shifting to register with PET data, and is available only on the latest Discovery STE PET/CT. Other manufacturers do not have the interface for cine CT. Alternatively, a non-CT pure PET scanner with a 3-rod rotating attenuation source would acquire attenuation data very rapidly without the misregistration and relatively high radiation dose of PET/CT, thereby providing the basis for an inexpensive fast PET scanner for cardiac imaging.
CONCLUSION
Misregistration of helical CT attenuation and emission PET images is common in cardiac PET/CT, with associated artifactual PET defects causing falsely positive results that are identifiable on PET/CT fusion images. Artifactual defects due to PET/CT misregistration are eliminated by imaging protocols using cine CT data acquired during normal breathing and software for reconstructing PET images with averaged cine CT data or sifting averaged cine CT data to achieve visual coregistration. Properly coregistered PET/CT data provide definitive perfusion images demonstrated in this study and, as reported earlier, suitable for assessing severity of CAD, for following its regression or progression, and for identifying mild early nonobstructive coronary atherosclerosis as the basis for intense, life-long pharmacologic and lifestyle management (1–10).
Acknowledgments
No author has a conflict of interest or financial benefit related to this article.
Footnotes
-
COPYRIGHT © 2007 by the Society of Nuclear Medicine, Inc.
References
- Received for publication January 14, 2007.
- Accepted for publication April 17, 2007.


Jump to section
Related Articles
Cited By...
- Value of SiPM PET in myocardial perfusion imaging using Rubidium-82
- PET by MRI: Glucose Imaging by 13C-MRS without Dynamic Nuclear Polarization by Noise Suppression through Tensor Decomposition Rank Reduction
- Improving the Accuracy of Simultaneously Reconstructed Activity and Attenuation Maps Using Deep Learning
- Clinical Quantification of Myocardial Blood Flow Using PET: Joint Position Paper of the SNMMI Cardiovascular Council and the ASNC
- Routine Clinical Quantitative Rest Stress Myocardial Perfusion for Managing Coronary Artery Disease: Clinical Relevance of Test-Retest Variability
- Myocardial Blood Flow and Inflammatory Cardiac Sarcoidosis
- The Effect of Misregistration Between CT-Attenuation and PET-Emission Images in 13N-Ammonia Myocardial PET/CT
- Clinical Utility of Enhanced Relative Activity Recovery on Systolic Myocardial Perfusion SPECT: Lessons from PET
- Regadenoson Versus Dipyridamole Hyperemia for Cardiac PET Imaging
- SNMMI/ASNC/SCCT Guideline for Cardiac SPECT/CT and PET/CT 1.0
- Cardiac PET/CT Misregistration Causes Significant Changes in Estimated Myocardial Blood Flow
- Effective Dose of PET/CT in Informed Consent Forms
- Physiological Basis for Angina and ST-Segment Change: PET-Verified Thresholds of Quantitative Stress Myocardial Perfusion and Coronary Flow Reserve
- Impact of Unexpected Factors on Quantitative Myocardial Perfusion and Coronary Flow Reserve in Young, Asymptomatic Volunteers
- Cardiac Dedicated Ultrafast SPECT Cameras: New Designs and Clinical Implications
- Coronary Branch Steal: Experimental Validation and Clinical Implications of Interacting Stenosis in Branching Coronary Arteries
- Characterization of a Perirectal Artifact in 18F-FDG PET/CT
- Single-Phase CT Aligned to Gated PET for Respiratory Motion Correction in Cardiac PET/CT
- Nonrigid Versus Rigid Registration of Thoracic 18F-FDG PET and CT in Patients with Lung Cancer: An Intraindividual Comparison of Different Breathing Maneuvers
- Decreased Perfusion in the Lateral Wall of the Left Ventricle in PET/CT Studies with 13N-Ammonia: Evaluation in Healthy Adults
- Directions and Magnitudes of Misregistration of CT Attenuation-Corrected Myocardial Perfusion Studies: Incidence, Impact on Image Quality, and Guidance for Reregistration
- Integrated positron emission tomography/computed tomography (PET/CT) in coronary disease
- Does Coronary Flow Trump Coronary Anatomy?
- Cardiac Positron Emission Tomography
- Coronary Flow Reserve and Pharmacologic Stress Perfusion Imaging: Beginnings and Evolution
- Comparison of Myocardial Perfusion 82Rb PET Performed with CT- and Transmission CT-Based Attenuation Correction
- SPECT/CT
- Dual-Modality Imaging: Combining Anatomy and Function
- Reducing Radiation Dose in Rest-Stress Cardiac PET/CT by Single Poststress Cine CT for Attenuation Correction: Quantitative Validation
- Not All Randomized Trials Are Equal
- Attenuation Correction for Stress and Rest PET 82Rb Myocardial Perfusion Images
- Reply: Attenuation Correction for Stress and Rest PET 82Rb Myocardial Perfusion Images