


Abstract
The purpose of this study was to assess the feasibility and accuracy of quantifying subendocardial and subepicardial myocardial blood flow (MBF) and the relative coronary flow reserves (CFR) using 15O-labeled water (H215O) and 3-dimensional–only PET. Methods: Eight pigs were scanned with H215O and 15O-labeled carbon monoxide (C15O) after partially occluding the circumflex (n = 3) or the left anterior descending (n = 5) coronary artery, both at rest and during hyperemia induced by intravenous dipyridamole. Radioactive microspheres were injected during each of the H215O scans. Results: In a total of 256 paired measurements of MBF, ranging from 0.30 to 4.46 mL·g−1·min−1, microsphere and PET MBF were fairly well correlated. The mean difference between the 2 methods was −0.01 ± 0.52 mL·g−1·min−1 with 95% of the differences lying between the limits of agreement of −1.02 and 1.01 mL·g−1·min−1. CFR was significantly reduced (P < 0.05) in the ischemic subendocardium (PET = 1.12 ± 0.45; microspheres = 1.09 ± 0.50; P = 0.86) and subepicardium (PET = 1.2 ± 0.35; microspheres = 1.32 ± 0.5; P = 0.39) in comparison with remote subendocardium (PET = 1.7 ± 0.62; microspheres = 1.64 ± 0.61; P = 0.68) and subepicardium (PET = 1.79 ± 0.73; microspheres = 2.19 ± 0.86; P = 0.06). Conclusion: Dynamic measurements using H215O and a 3-dimensional–only PET tomograph allow regional estimates of the transmural distribution of MBF over a wide flow range, although transmural flow differences were underestimated because of the partial-volume effect. PET subendocardial and subepicardial CFR were in good agreement with the microsphere values.
An even distribution of flow across the left ventricular (LV) wall is crucial for an adequate oxygen supply to the subendocardium. The greater vulnerability of the subendocardium to ischemia is determined by several factors, such as heart rate, cardiac contraction, and LV chamber pressure, all affecting perfusion more in the subendocardium than in the subepicardium. Experimental results in animals by means of radioactive microspheres have indicated that, in the normal heart, myocardial blood flow (MBF) in the LV subepicardium and subendocardium is homogeneously distributed both at baseline and at maximal coronary dilation (1–3). Reduced subendocardial coronary flow reserve (CFR) in response to exercise (4) or pharmacologically induced maximal coronary vasodilation (5–7) is a hallmark of flow-limiting stenoses. Moreover, in the absence of coronary disease, this phenomenon has been demonstrated both in hypertrophied LV of conscious dogs using microspheres (8) and in patients with LV hypertrophy secondary to aortic stenosis using PET (9).
Using 15O-labeled water (H215O) and PET, we have recently demonstrated that MBF and CFR can be measured noninvasively using 3-dimensional (3D) data acquisition, thereby reducing the radiation dose delivered to the patient without degrading the quality of reconstructed images (9,10). To date, however, only average transmural (i.e., full thickness) MBF PET measurements have been compared with radioactive microspheres in animals. The purpose of this study was to ascertain whether more refined measurements of subendocardial and subepicardial MBF can be obtained. To this end, MBF measurements were performed in anesthetized pigs over a wide flow range using H215O and PET and results were compared with those obtained simultaneously using radioactive microspheres.
MATERIALS AND METHODS
Animal Preparation and Surgery
The principles of laboratory animal care and use in accordance with the Animals (Scientific Procedures) Act of 1986 and the Guide for the Care and Use of Laboratory Animals (NIH Publication No. 85-23, revised 1996) were followed. After a 12-h fast, 8 large white pigs (35 ± 4 kg) were premedicated with azaperone (2 mg·kg−1 intramuscularly) Anesthesia was induced with thiopentone (25 mg·kg−1) and maintained with propofol infusion (9–20 mg·kg−1·h−1). The animals were artificially ventilated (15 mL·min−1·kg−1) with room air supplemented with oxygen, as required, to maintain blood Po2 (partial pressure of oxygen), Pco2 (partial pressure of carbon dioxide), and pH within physiologic limits.
Teflon (DuPont) catheters were implanted in the femoral artery and vein, through an incision in the groin, to measure aortic pressure, sample blood, and administer radioactive tracers. The heart was exposed through an incision in the fourth left intercostal space. A solid-state pressure gauge (Konigsberg Instruments) was inserted into the LV. The circumflex (n = 3) or the left anterior descending (n = 5) coronary arteries were dissected 2 cm from their origin, and a transit-time flow meter (Triton Technology) and a hydraulic occluder were implanted. Ultrasonic crystals (Triton Technology) were placed into the inner third of the LV wall in the center of the area to be subtended by the stenosed artery to monitor circumferential fiber shortening. A catheter was inserted in the left atrial appendage for microsphere injection.
Mean arterial, LV peak systolic and end-diastolic pressures, LV contractility dP/dt, segmental shortening, coronary blood flow, and 3 electrocardiogram leads were continuously monitored and recorded on a multichannel recorder (DISS). Average values for individual parameters were calculated from digitized data sampled at the time of PET data acquisition.
Experimental Protocol
After baseline hemodynamic measurements, the occluder was inflated slowly through a motor-driven syringe to reduce mean coronary blood flow by ∼50%. Once the desired flow rate was achieved, flow was kept stable by adjusting the pressure in the hydraulic occluder for the duration of the 2 PET H215O acquisitions, that is, under resting and stress (dipyridamole) conditions. MBF was also measured using 15-μm plastic microspheres labeled with either 57Co (rest) or 46Sc (stress) to high specific radioactivity (NEN Research Products). The microspheres were suspended in 10% dextran (10). Approximately 1.6 × 10⁶ microspheres (0.5–2.5 MBq in 0.5–1.5 mL) were injected into the left atrium over 4 s. A reference blood sample was withdrawn from the femoral artery over 2 min at a rate of 7.5 mL·min−1, starting 10 s before the injection of microspheres.
PET Scanning
Scanning was performed using an ECAT EXACT3D (model 966; CTI/Siemens), a 3D-only tomograph with large axial field of view (FOV) and high spatial and temporal resolution (11).
Animals were positioned in the scanner lying on their right side and a transmission scan was recorded for 10 min using a single-photon point source (150 MBq of 137Cs), as described previously (12,13). To image the blood pool, 15O-labeled carbon monoxide (C15O; 1.5 MBq·mL−1) was administered through the endotracheal tube for 4 min at a rate of 500 mL·min−1. List-mode acquisition and serial blood sampling (3 mL arterial blood every minute) were started at the end of C15O inhalation for a total period of 18 min (10).
Subsequently, MBF was measured using H215O (110 MBq) injected intravenously over 20 s at an infusion rate of 10 mL·min−1. During each MBF measurement, radioactive microspheres were injected 40 s after start of H215O infusion. The total duration of the H215O scan was 10 min. In each animal MBF was measured twice with the occluder inflated: at baseline (ischemia) and after administration of dipyridamole (0.56 mg·kg−1) infused intravenously over 4 min (ischemia + hyperemia). During dipyridamole-induced hyperemia, H215O administration commenced 5 min after the start of dipyridamole infusion.
PET Data Analysis
PET data analysis was performed as reported previously (10). Briefly, each of the H215O list-mode acquisitions was sorted into 27 frames: a background frame, a 20-s frame to allow for circulation of activity, followed by 14 × 5-s, 3 × 10-s, 4 × 20-s, and 4 × 30-s frames to describe the kinetics of H215O. The background frame had a variable length from the start of acquisition to the arrival of activity in the FOV, minus 20 s.
A static C15O emission image was generated by integrating the list-mode data over a period of 480 s. To allow for equilibration of radioactivity within the cardiovascular system, this integration was started at least 1 min after the end of C15O inhalation.
Data Corrections and Reconstruction.
All data were normalized (11) and corrected for scatter using the model-based scatter-correction method (14), available in the standard scanner software. Transmission data were reconstructed using single-slice rebinning (15), segmented into “low” and “high” attenuating media (lung and soft tissue) regions, and then forward projected to form, the required attenuation correction files as described previously (16). The emission data were reconstructed with the reprojection algorithm (17,18), applying either Hann or Ramp filters (cutoff, 0.5 cycle/pixel) and a zoom factor of 2.29. This resulted in a dataset containing 95 planes of 128 × 128 voxels with a measured voxel size of 2.29 × 2.29 (transaxial) × 2.43 (axial) mm3. The reconstructed transaxial spatial resolution at 1 cm from the center of the FOV was 6.7 ± 0.1 and 4.8 ± 0.1 mm full width at half maximum (FWHM) for Hann and Ramp filters, respectively. The axial resolution at 1 cm from the center of the FOV was 5.6 ± 0.5 mm FWHM for both filters (11). In addition, H215O image data were rebinned into 2-dimensional (2D) sinograms using a Fourier rebinning (FORE) algorithm (19). All images and 2D sinograms were transferred to a Sun Ultra 10 workstation (Sun Microsystems) and analyzed with dedicated software running in the MATLAB programing language (The MathWorks Inc.).
Vascular Image.
A blood volume image (Vb; mLblood·mLROI−1) was obtained from the static C15O image (kBq·mLROI−1) (ROI = region of interest) by dividing the image counts, voxel by voxel, by the normalized integral of radioactivity in the sampled arterial blood (kBq·mLBLOOD−1). This integration was performed by first fitting a monoexponential function to the blood time–radioactivity curve. The extravascular tissue volume (VEV; mLanatomic tissue·mLROI−1) image was derived by subtracting the blood volume image from the normalized transmission image (20,21).
Myocardial Factor Images and MBF Calculation.
Myocardial images were generated directly from the dynamic H215O scans using a factor analysis technique as previously described (10). Briefly, cluster analysis was used to segment the dynamic images into regions with similar time–activity curves (22). Three clusters, representing mixed venous (right ventricular chamber), arterial (left atrium and LV chamber), and myocardial tissue, were chosen. Next, factor analysis, together with these 3 cluster time–activity curves, was used to generate 2 factor sinograms, representing tissue and blood distributions. The corresponding factor images were obtained by iterative reconstruction (23). Factor images were resliced into 5-mm-thick short-axis images (voxel size, 1.12 × 1.12 × 5.0 mm3) in an orientation perpendicular to the long axis of the LV. This transformation matrix was also used to reslice all transaxial images, including the dynamic water, blood volume, and extravascular volume images. Starting from the apex, 12 consecutive short-axis planes (each 2 planes corresponding to 1 slice of the anatomic sections of the heart used for the microsphere analysis) were determined visually for ROI definition. ROIs were placed manually on the factor images by defining the inner, middle, and outer LV wall and radially dividing the myocardium into 4 segments. The anterior interventricular groove, the point identifying the meridian plane of the anatomic cut, was defined as the separation line between septal and anterior regions. All segments were then grouped into 8 standard regions (anterior, lateral, inferior, and septum for apex and base of the heart) for both subepicardium and subendocardium and projected onto the dynamic 3D water images to extract tissue time–activity curves. Small circular ROIs (radius, 4–5 mm) were placed in the left atrium on 3–6 consecutive planes of the factor images to obtain the arterial input function. Similarly, a mixed venous blood time–activity curve was defined by placing ROIs in the right ventricular cavity. Arterial, venous, and tissue time–activity curves were fitted to a single-compartment model, giving values of regional MBF (mL·mL−1·min−1) and perfusable tissue fraction (PTF; mLexchangeable tissue·mLROI−1) as described previously (21,24). As spillover between subendocardial and subepicardial regions will affect calculated flow values, a simulation study was performed to assess the extent to which potential differences between subendo- and subepicardial flow would be “diluted” by their close proximity. This simulation study is given in the Appendix. For comparison with microsphere flow data, MBF PET results were divided by the density of myocardial tissue (1.04 g·mL−1) to express MBF in mL·g−1·min−1. CFR was calculated as the ratio between hyperemic and baseline MBF.
Calculation of MBF with Radiolabeled Microspheres.
After PET and sacrifice, the heart was excised and cut into 6 or seven 10-mm-thick slices perpendicular to the long axis of the LV. Each slice was further cut into 8 equally sized wedges using the interventricular groove as a marker point for the meridian cut between the anterior and septal regions. Tissue and arterial blood samples were counted in an automated γ-counter (CompuGamma 1282; LKB Pharmacia), and blood flow per gram of myocardium was calculated by dividing the sample radioactivity by sample weight using a standard reference technique (25). To allow comparison with regional PET flow values (26), microsphere MBF data were grouped into the corresponding PET regions.
Statistics
Results are expressed as mean ± SD. Hemodynamic measurements were compared by means of ANOVA for repeated measures and the post hoc Fisher PLSD (Protected Least Significant Difference) test. Paired data were tested by means of the Student t test. Equality of variance between data series filtered with Ramp or Hann filters was tested using the F test. The absolute differences between the 2 series of PET and microsphere MBF and their averages were tested for homoscedasticity by means of regression. The plot showed an increase of variance with increasing mean MBF values. To account for heteroscedasticity, Deming regression was performed with microsphere MBF as the independent variable against PET MBF to test the deviation from the line of identity. With Deming regression, intercept and slope were calculated according to Cornbleet and Gochman (27), and SE and confidence intervals were estimated using the jackknife method (28). This method finds a line of best fit for a set of related data and accounts for errors in both abscissa and ordinate. The ratios of the mean differences of paired measurements over their averages (microsphere and PET MBF) were calculated to test the agreement between the 2 measurements according to Bland and Altman (29). A value of P < 0.05 was considered statistically significant.
RESULTS
Hemodynamics
The baseline hemodynamic parameters and their changes during the different study phases are reported in Table 1. During ischemia mean coronary blood flow was reduced by ∼40% and, as a consequence, segmental shortening in the ischemic territory decreased by ∼50% without significant changes in systemic blood pressure or global LV contractility (LV dP/dt). The systemic vasodilation induced by dipyridamole significantly reduced aortic systolic and diastolic blood pressure. Mean coronary blood flow in the constricted coronary artery increased after dypiridamole infusion.
Hemodynamic Parameters at Baseline, After Inflation of Hydraulic Occluder (Ischemia), and During Dipyridamole Infusion
Image Filtering Comparison
The F test applied to the MBF values obtained with Ramp and Hann filtering of the H215O images resulted in equality of variance for both sets of data. Paired comparison showed a statistically significant difference in the subepicardium both at rest (mean difference, 0.017; P = 0.015) and during hyperemia (mean difference, −0.038; P = 0.003) that was equal to ∼1%. This difference was considered to be physiologically negligible and, therefore, MBF calculated from Hann-filtered images (less noisy) was used for subsequent statistical analysis.
MBF, CFR, and PTF
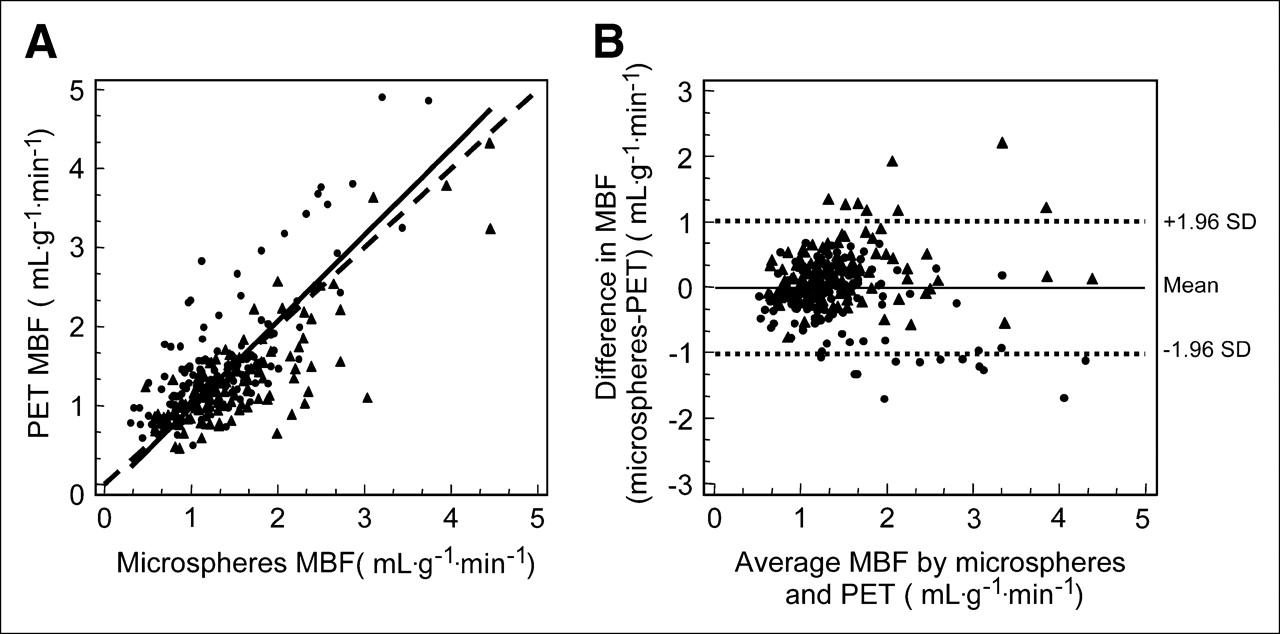
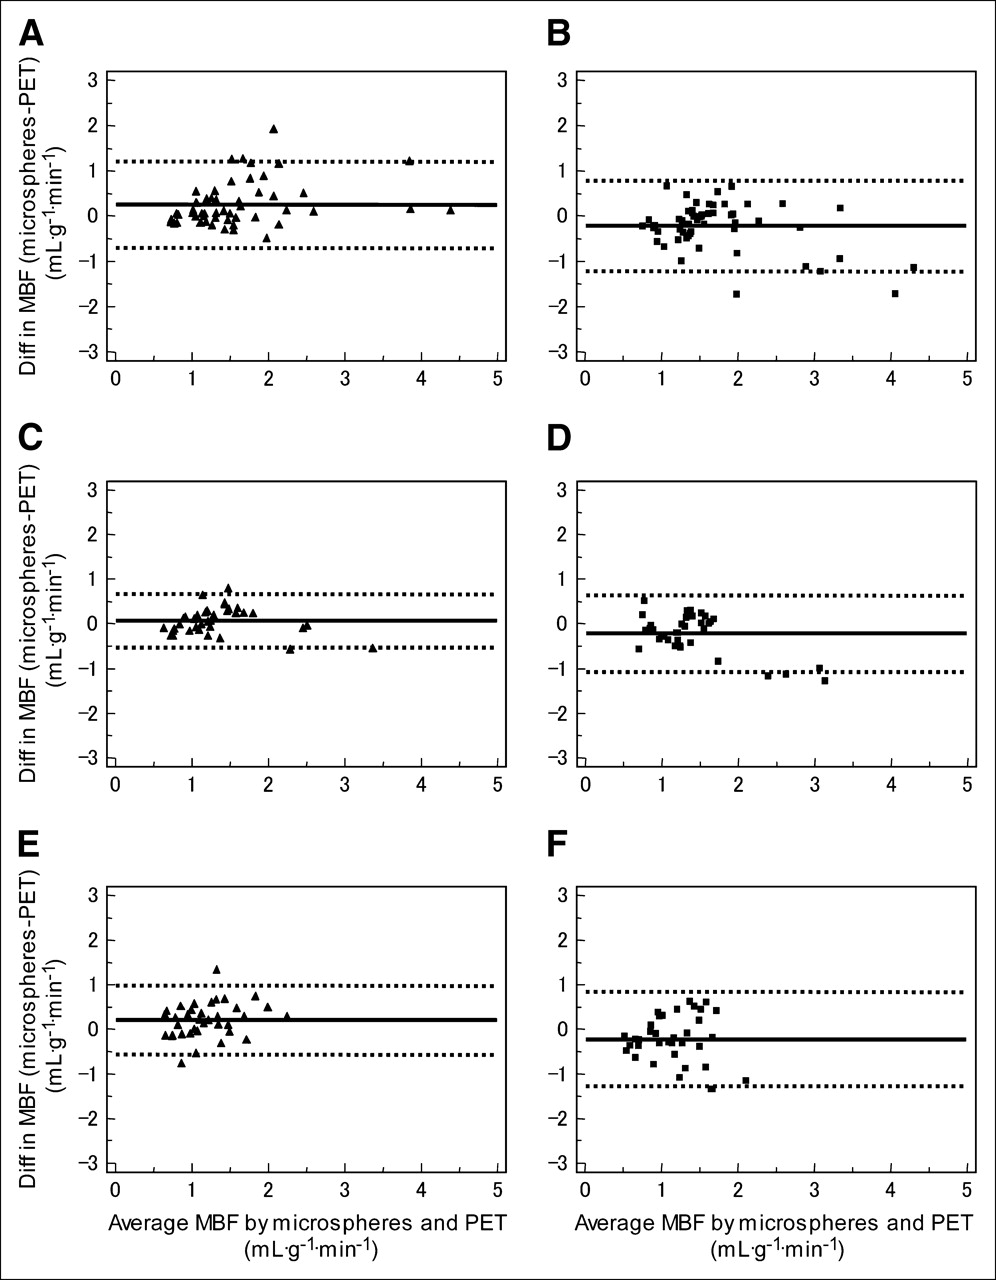
A total of 256 paired microsphere and PET measurements were obtained in the 8 pigs, with microsphere flows ranging from 0.30 to 4.46 mL·g−1·min−1. The results of the comparison between the whole set of PET and microsphere measurements are shown in Figure 1. The slope of the Deming regression, including all subendocardial and subepicardial data (Fig. 1A; y = −0.05 + 1.04x, 95% confidence interval (CI) for intercept −0.33 to 0.22, 95% CI for slope 0.83 to 1.25), was close to unity and the intercept was close to zero. The CI for the intercept indicates that the methods do not differ by a constant amount; the CI for the slope included the line of identity, thus showing good agreement between microspheres and PET over the measured range of MBF values. The Bland–Altman plot of the differences between the 2 measurements against their average value is shown in Fig. 1B. The mean difference between microsphere and PET MBF was −0.01 ± 0.52 mL·g−1·min−1, with 95% of the differences lying between the limits of agreement of −1.02 and 1.01 mL·g−1·min−1. The agreement between the 2 methods was similar in subepicardium (mean difference, 0.20 ± 0.46 mL·g−1·min−1; limits of agreement, −0.7 and 1.1 mL·g−1·min−1; Fig. 2A) and subendocardium (mean difference, −0.22 ± 0.50 mL·g−1·min−1; limits of agreement, −1.2 and 0.8 mL·g−1·min−1; Fig. 2B). The agreement between microsphere and PET MBF in different territories is illustrated in Figure 3. The agreement in the remote nonischemic territory (Figs. 3A and 3B) was similar in both layers, although there was a trend to underestimation with PET in the subepicardium (Fig. 3A: mean difference, 0.25 ± 0.50 mL·g−1·min−1; limits of agreement, −0.74 and 1.25 mL·g−1·min−1) and a trend to overestimation in the subendocardium (Fig. 3B: mean difference, −0.22 ± 0.51 mL·g−1·min−1; limits of agreement, −1.22 and 0.79 mL·g−1·min−1). Good agreement was also found in regions with less severe ischemia and greater heterogeneity, at the border between remote and ischemic territory (Fig. 3C: subepicardium mean difference, 0.07 ± 0.30 mL·g−1·min−1; limits of agreement, −0.52 and 0.66 mL·g−1·min−1; Fig. 3D: subendocardium mean difference, −0.22 ± 0.43 mL·g−1·min−1; limits of agreement, −1.06 and 0.63 mL·g−1·min−1). In the ischemic regions, the limits of agreement were broader in the subendocardium (Fig. 3F: mean difference, −0.22 ± 0.54 mL·g−1·min−1; limits of agreement, −1.28 and 0.84 mL·g−1·min−1) than in the subepicardium (Fig. 3E: mean difference, 0.21 ± 0.39 mL·g−1·min−1; limits of agreement, −0.56 and 0.98 mL·g−1·min−1). Table 2 summarizes the comparison of the accuracy of MBF measurements in the various regions of the LV. During hyperemia there was an increase in variance, especially in the septal regions of both layers. The apical subepicardial regions showed larger variances in the differences between PET and microsphere measurements than the corresponding basal segments.

Deming scatter plot (A) and Bland–Altman plot (B) of variation of MBF (•, subendocardial; ▴, subepicardial) obtained from microspheres and PET in all ROIs. Deming regression: dashed line = line of identity; solid line = slope of Deming regression Bland–Altman plot: Dotted lines ± 1.96 SD; solid line = mean difference.
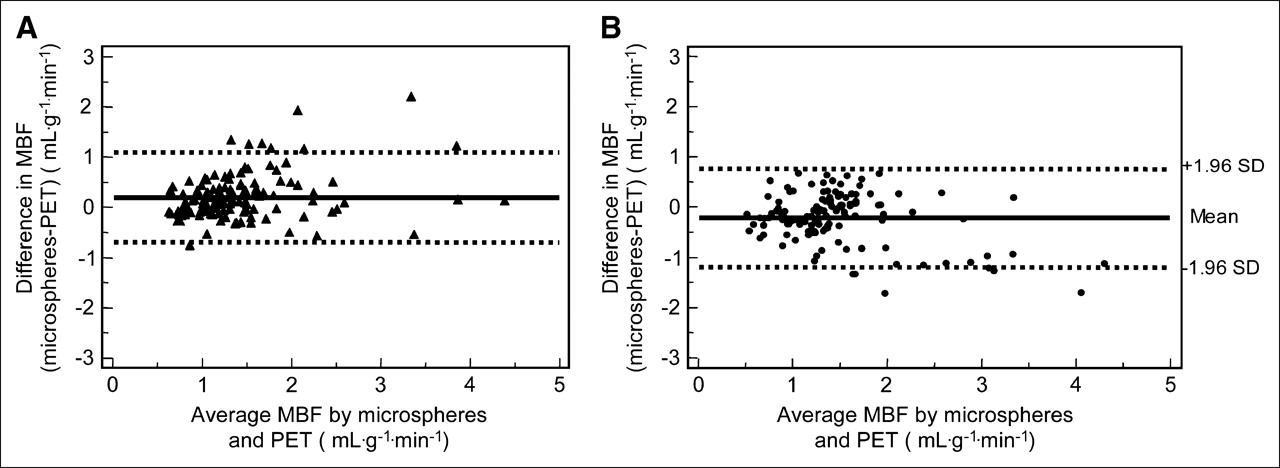
Bland–Altman plots show agreement of MBF obtained from microspheres and PET in subepicardium (A) and in subendocardium (B). Dotted lines ± 1.96 SD; solid line = mean difference.

Bland–Altman plots show agreement of MBF obtained from microspheres and PET in 3 regions separated according to proximity to stenosis. Normally perfused remote subepicardium (A) and subendocardium (B); mixed border subepicardium (C) and subendocardium (D); ischemic subepicardium (E) and subendocardium (F). Dotted lines ± 1.96 SD; solid line = mean difference; Diff = difference.
Comparison of Variance of Difference of MBF Measurement Between Microspheres and PET in Different Regions of LV
The different values of CFR in the 3 territories are depicted in Figure 4. Overall there was no difference between the 2 methods; the CFR in the ischemic territory was significantly lower than that in the remote territory in both layers, whereas there was a significant difference between mixed border and ischemic regions only for CFR calculated with microspheres.
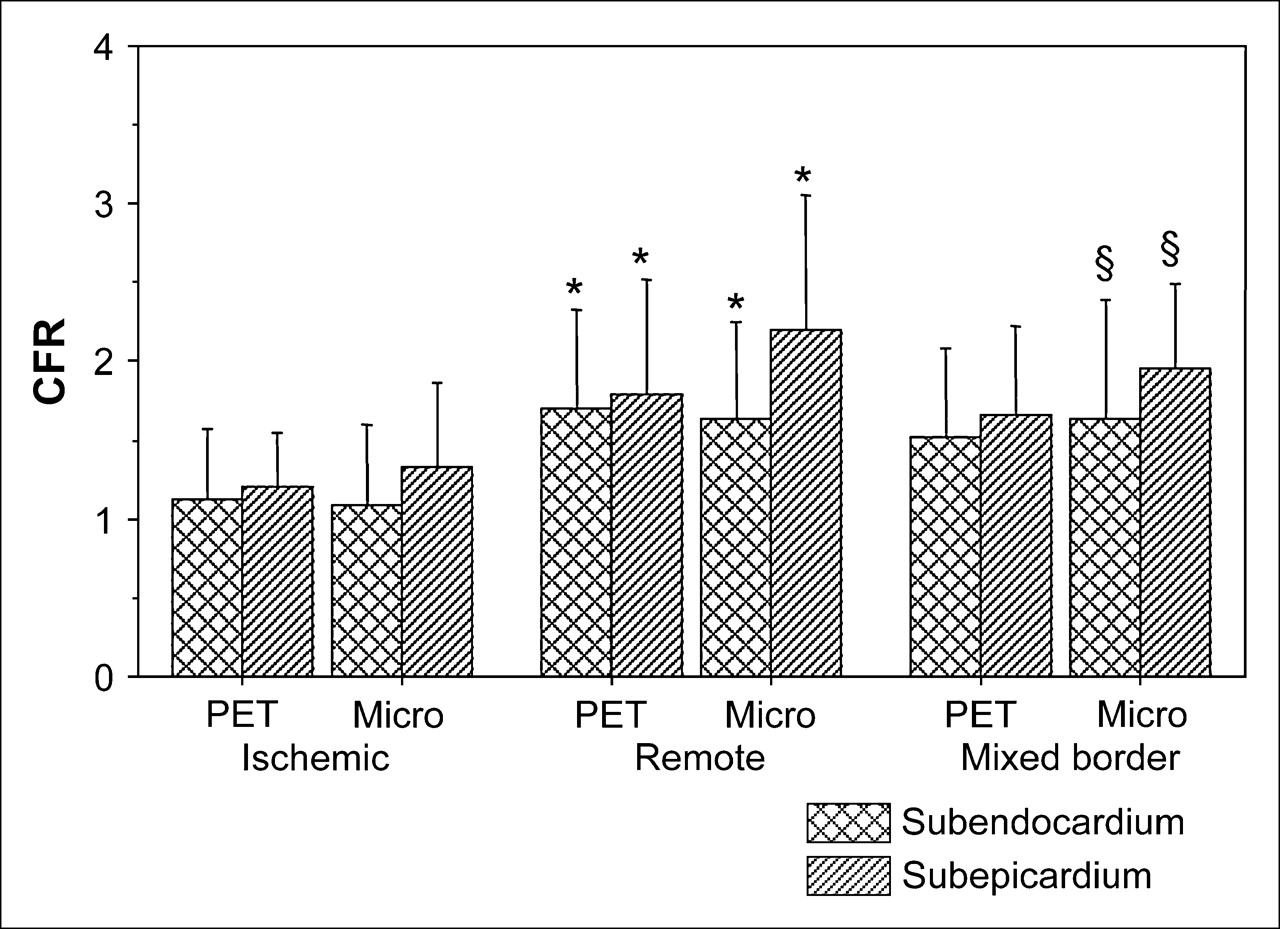
Bar graph shows comparison of CFR between subepicardium and subendocardium in 3 territories (ischemic, remote, mixed border) of LV. *P < 0.05: remote vs. ischemic; §P < 0.05: mixed border vs. ischemic. Micro = microspheres.
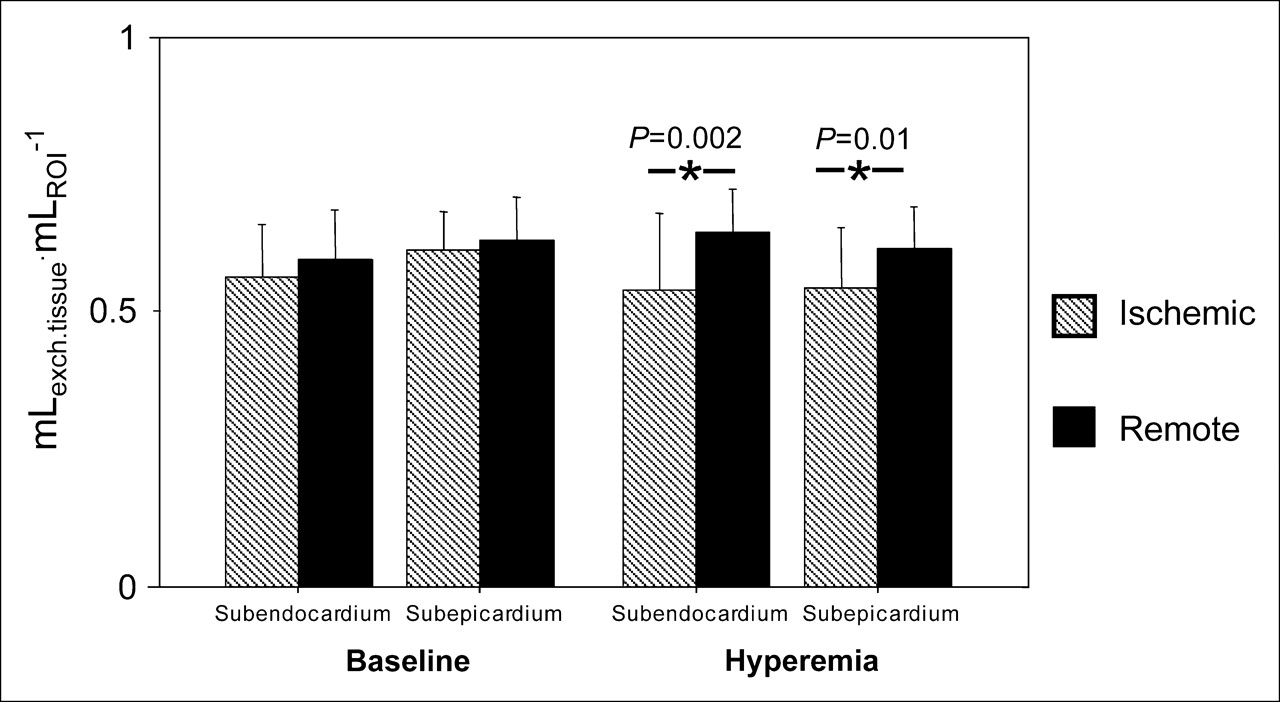
The changes of PTF in remote control and ischemic regions both at rest and during dipyridamole-induced hyperemia are depicted in Figure 5. Similarly to what was observed for transmural PTF, both subendocardial and subepicardial PTF were reduced significantly during hyperemia in the ischemic regions.

Bar graph compares PTF in normally perfused (control, solid bars) and ischemic myocardium (hatched bars). Value of PTF is reduced during dipyridamole-induced stress in both subendocardial and subepicardial layers. exch.tissue = exchangeable tissue.
DISCUSSION
The results of the present study demonstrate the feasibility of estimating MBF and CFR in the LV subepicardium and subendocardium using PET and H215O over a wide range of flow values encompassing physiologic and pathophysiologic conditions. This study was performed in normal pigs whose LV thickness was ∼10 mm and in whom the partial-volume effect was likely to affect these measurements because of the spatial resolution of the PET scanner used (11). In our opinion, this is an important step forward since, so far, PET measurements of subendocardial and subepicardial MBF were performed exclusively in patients with LV hypertrophy and wall thicknesses ranging from 12 to ∼40 mm (9,30–32).
In our earlier study, in which average transmural MBF was measured using 3D PET and H215O (10), the mean difference between microsphere and PET MBF was −0.11 ± 0.36 mL·g−1·min−1, with 95% of the differences lying between the limits of agreement of −0.83 and 0.61 mL·g−1·min−1. In the present study, a greater mean difference was found between microsphere and both subepicardial and subendocardial PET MBF, as well as broader limits of agreement. This larger variance (and corresponding bias due to nonlinearity of the flow model, especially at high-flow values) is attributed to increased noise levels resulting from the selection of smaller ROIs. The small systematic difference in the agreement with microspheres between subendocardial and subepicardial flow could be due to differences in the composition of the different tissues surrounding these 2 regions (blood vs. chest wall and lung tissue). The model contains an intrinsic correction for spillover from arterial blood activity, but not for that from adjacent tissue activity; therefore, the slight underestimation in subepicardium relative to that in subendocardium was predictable by the simulation described in the Appendix.
The main goal of the present study was to test the hypothesis that PET measurement of MBF allows the identification of transmural MBF distribution during pharmacologic stress in LV of normal thickness. The use of a fully quantitative perfusion assessment is of potential clinical relevance as it circumvents the necessity of establishing a normal reference ROI, which is particularly cumbersome in patients with multivessel disease and in all conditions where there is an increased heterogeneity in myocardial perfusion.
In a previous study of patients with aortic stenosis and LV hypertrophy, we demonstrated that, although no difference in transmural perfusion could be detected under resting conditions, a more severe exhaustion of CFR in the subendocardium was observed during stress that was significantly related to the aortic valve area (9). In the present study, we have moved forward by demonstrating that CFR measured with PET in ischemic myocardium is comparable to that measured with radioactive microspheres, despite a 50% reduction in segmental shortening and the corresponding higher partial-volume effect (Fig. 4). This indicates that, using PET, CFR can be estimated in the subendocardium of ventricles with wall thicknesses comparable to those of human myocardium and that this technique can be applied to the study of transmural MBF distribution in patients with coronary artery disease. It should be noted, however, that the sensitivity for detecting changes in CFR is reduced as a result of partial-volume effect due to the limited resolution of the scanner. This is described in the Appendix and also illustrated in Figure 4, where, at variance with the microsphere data, no significant differences between mixed border and ischemic regions were found in the PET data. Nevertheless, the most important finding was the significant difference in CFR between remote and ischemic regions that could be detected by PET. Our data are in agreement with the findings of Bin et al. (33) in dogs with coronary stenosis during stress with dipyridamole. The best predictor of the change in myocardial contractility ensuing during stress was subendocardial CFR, whereas the endocardial-to-epicardial MBF ratio was a poor predictor of inducible systolic dysfunction, with only 35% of segments with a ratio of <0.8 showing this phenomenon. In the presence of CAD and hibernating myocardium, the average transmural MBF is within normal limits in most patients and the reduction of resting wall motion is likely to be the consequence of a severely blunted CFR (34). In the present study, we observed a slightly lower CFR in the subendocardium and it is conceivable that a similar phenomenon is present in the setting of chronic ischemia in patients and could contribute to persistent LV dysfunction. It is worth noting that the PTF was significantly reduced in ischemic compared with remote myocardium only during hyperemia. This could be due to increased partial-volume effect during hyperemia as a result of 2 possible factors: myocardial thinning and different average position and shape of the myocardium during hyperemia.
In our previous paper we delineated several factors that could affect the scatter of the differences between microsphere and PET measurements (10). Briefly, there are factors inherent to the physical characteristics of microspheres and H215O and their uptake or retention by myocardial tissue: free diffusion in the case of H215O and a value averaged over 2–3 min versus first-pass instantaneous extraction for microspheres. As expected, broader limits of agreement were observed in regions with MBF >2 mL·g−1·min−1. The length of the arterioles penetrating from the subepicardium to the subendocardium and the fractal distribution of their branching could cause skimming and separation of the microspheres, thus reducing the deposition in the more ischemic subendocardium (35)—a limitation that does not apply to H215O (36). Discrepancy in blood flow values has been reported by Hale et al. (37) using radioactive and colored microspheres in dogs. For flows in the physiologic range up to 2 mL·g−1·min−1, MBF calculated with colored microspheres was ∼8% higher than that calculated with radioactive microspheres and this difference increased to ∼39% for MBF values of >2 mL·g−1·min−1. The density of radioactive microspheres is 1.4 mg·mL−1, whereas colored microspheres have a density of 1.05 mg·mL−1, which is closer to that of red blood cells and to freely diffusible H215O. Regional misalignment between the anatomic specimen ex vivo and the averaged PET image of the beating heart in vivo is still a major source of variability in the comparison of the 2 methods, in spite of the great care taken in aligning the interventricular groove, which represents the reference point. Moreover, an additional source of variability is the manual cutting of the LV wall and the arbitrary division in 2 halves of the inner and outer contour of the tissue image of the myocardium. This discrepancy is enhanced by the lack of correction of PET images for cardiac and respiratory motions, which are known to affect the scanner's efficiency and limit its spatial resolution (38). Our study was designed to minimize noise due to motion: the animals were maintained at a surgical stage of anesthesia; thus, random movements were avoided. During acquisitions, ventilation rate as well as heart rate were kept constant. Nevertheless, the latter motion remains a limitation during hyperemic stress when the heart rate and LV contractility in the nonischemic regions are increased. Accordingly, we observed broader limits of agreement between microsphere and PET measurements at flows higher than 2 mL·mL−1·min−1. Over the past 2 decades, the spatial resolution of PET scanners has significantly improved (from >16 to <5 mm FWHM) and the impact of patient movement on quantification becomes more critical as the resolution increases. This is expected to be an area of active development in future years, and the advent of fusion imaging—for example, PET/CT—will facilitate the development of adequate solutions for this long-standing issue (39). Despite these improvements, the limited spatial resolution remains an important drawback for accurate measurements (i.e., without bias) of subendocardial and subepicardial MBF using PET. As expected, the simulation studies reported in the Appendix demonstrate that spillover, from subendocardium to subepicardium and vice versa, remains a problem blunting transmural flow differences. It is also clear, however, that resolution is not the only limiting factor. The fact that Hann and Ramp filters provided essentially the same results implies that an improvement in spatial resolution from ∼7 to ∼5 mm had no impact. This indicates that cardiac and respiratory movements pose a limitation on the effective resolution achievable. Improving sensitivity and, in particular, reducing the level of (out of field) scattered events would provide better noise characteristics. This is especially important for high-flow situations, where nonlinearity of the flow model results in noise amplification.
CONCLUSION
This study demonstrates the feasibility of estimating MBF and CFR in the subendocardium and subepicardium in LV of normal thickness using PET and H215O. This technique may prove useful in patients with coronary artery disease for advancing our pathophysiologic understanding of myocardial ischemia in humans.
APPENDIX
A simulation study was performed to evaluate the feasibility of assessing differences in subendocardial and subepicardial flow. Because of the relatively limited resolution of the PET scanner, ∼7 mm FWHM in all directions, the spillover from and to subendocardium and subepicardium is likely to be significant. The model for the calculation of MBF includes correction terms for spillover contributions from both LV and right ventricular (RV) cavities to the myocardial time–activity curves. However, the spillover from neighboring tissue regions is not accounted for.
The simulation was carried out using the following steps:
Spillover fractions from LV and, for septal regions, RV into subepicardial and subendocardial regions were calculated, assuming a total myocardial wall thickness of 10 mm, a scanner resolution of 7 mm FWHM, and a gaussian-shaped point spread function. In addition, spillover fractions between subepicardial and subendocardial regions (each assumed to be 5-mm thick) were calculated.
Using a typical measured LV curve, noiseless time–activity curves were generated for 3 average transmural MBF values (of 1, 2, and 4 mL·g−1·min−1), representing the range of flow values observed under resting and stress conditions. The endocardial-to-epicardial flow ratio was set to 0.75 on the basis of the microsphere measurements during stress in the ischemic territories. In other words, for an average transmural MBF of 1 mL·g−1·min−1, subendocardial MBF was set to 0.875 and subepicardial MBF was set to 1.125 mL·g−1·min−1. A similar procedure was followed for the other 2 average transmural MBF values. Finally, spillover from LV and RV and spillover between the 2 myocardial layers were finally added to these noiseless time–activity curves using the calculated spillover fractions together with typical LV and RV curves.
Noise was added to the noiseless subepicardial and subendocardial time–activity curves calculated above. Noise levels from 0% to 25%, with increments of 5%, were used for each noise level, and for each noise level and 1,000 noisy time–activity curves were generated.
For each noise level, all 1,000 time–activity curves were fitted to the kinetic model of Hermansen et al., in which septal regions are fitted for spillover contributions from both LV and RV, while the remaining regions of the free wall are corrected only for LV spillover (24).
Bias, defined as the difference between the average MBF value for all 1,000 fits and the true simulated MBF, was used as a measure of accuracy. Reproducibility, calculated as the SD of the 1,000 individual MBF values, was used as a measure of precision.
For all simulated MBF values and for all applied noise levels, subendocardial and subepicardial MBF were over- and underestimated, respectively. In general, observed endocardial-to-epicardial flow ratios were close to 0.90 ± 0.02 rather than the applied value of 0.75. Figures 1A, panels A and B, show fitted subendocardial and subepicardial MBF, respectively, as a function of noise for lateral wall time–activity curves (no RV spillover) and a simulated transmural MBF of 1 mL·g−1·min−1. Similar results were obtained for the septum and at higher flow values. In Figures 1A, panels C and D, fitted subendocardial and subepicardial MBF are presented for septum and a simulated transmural MBF of 2 mL·g−1·min−1.
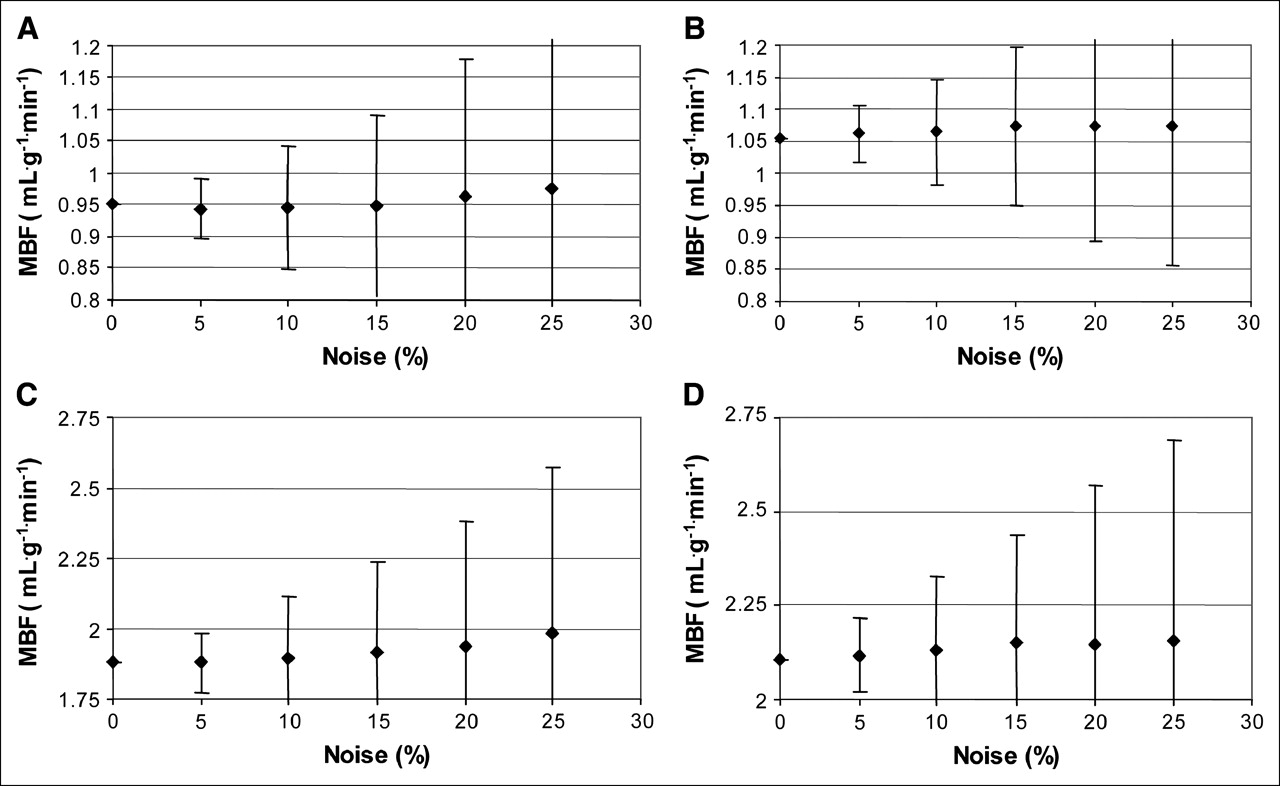
(A) MBF for subendocardial lateral wall as function of noise. SDs of observed values are indicated as error bars. A simulated transmural MBF value of 1 mL·g−1·min−1 was used, that is, subendocardial MBF = 0.875 and subepicardial MBF = 1.125 mL·g−1·min−1, respectively. (B) MBF for subepicardial lateral wall as function of noise. SDs of observed values are indicated as error bars. A simulated transmural MBF value of 1 mL/min/mL was used, that is, subendocardial MBF = 0.875 and subepicardial MBF = 1.125 mL·g−1·min−1, respectively. (C) MBF for subendocardial septum as function of noise. SDs of observed values are indicated as error bars. A simulated MBF value of 2 mL·g−1·min−1 was used, that is, subendocardial MBF = 1.75 and subepicardial MBF = 2.25 mL·g−1·min−1, respectively. (D) MBF for subepicardial septum as function of noise. SDs of observed values are indicated as error bars. A simulated transmural MBF value of 2 mL/min/mL was used, that is, subendocardial MBF = 1.75 and subepicardial MBF = 2.25 mL·g−1·min−1, respectively.
In summary, for a true ratio of 0.75 between subendocardial and subepicardial flow, these simulations demonstrate that for a myocardial thickness of 10 mm and a spatial resolution of 7 mm FWHM, in practice, a difference of around 10% will be observed between subendocardial and subepicardial flow, which is almost independent of the actual mean MBF value. For PET data obtained using ROIs, a noise level of 5% or less may be considered realistic, resulting in a coefficient of variation for MBF of ∼6% (Figs. 1A, panels A–D). Given this noise level in MBF and the differences in subendocardial and subepicardial flow of 10% observed in the present simulation study, it may be concluded that transmural flow differences can be partially assessed using a spatial resolution of 7 mm FWHM. It should be noted, however, that observed endocardial-to-epicardial flow ratios will be overestimations of true ratios because of the large spillover component between both myocardial layers.
Acknowledgments
The authors thank the staff of GE Healthcare, Imanet Hammersmith, for their interest and support, especially radiographers Andy Blyth and Hope McDevitt for their invaluable technical assistance. Dr. Schäfers was supported by the Innovative Medizinische Forschung (grant Sc-1-5-II/96-20) of the University of Münster.
References
- Received for publication July 13, 2005.
- Accepted for publication October 5, 2005.


