


Abstract
The purpose of this study was to investigate the quantitative properties and effects of ordered-subset expectation maximization (OSEM) on kinetic modeling compared with filtered backprojection (FBP) in dynamic PET studies. Both phantom and patient studies were performed. Methods: For phantom studies dynamic two-dimensional emission scans with 10-min frames and 20-min scan intervals were acquired over a 14-h period using an HR+ PET scanner. Various phantoms were scanned: 2-, 5-, 10-, and 20-cm-diameter phantoms filled with an 18F solution (300 kBq/mL) and a NEMA phantom filled with an 18F background (40 kBq/mL) and a cold or 11C insert (450 kBq/mL). Transmission (Tx) scans of 5–60 min were acquired. Data were reconstructed using FBP Hanning 0.5 and OSEM with 2–12 iterations and 12 or 24 subsets. Quantitative accuracy and noise characteristics were assessed. For patient studies, five cardiac, three oncologic, and three brain dynamic 18F-FDG scans were used. Five reconstructions were performed: FBP Hanning 0.5, and OSEM 2 × 12 and OSEM 4 × 16 with and without 5-mm full width at half maximum smoothing. Time–activity curves were calculated using volumes of interest. The input function was derived from arterial sampling. Metabolic rate of glucose (MRglu) was calculated with a standard two-tissue compartment model and Patlak analysis. Results: Contribution of Tx noise to the reconstructed image was smaller for OSEM than for FBP. Differences in signal-to-noise ratio between FBP and OSEM depended on number of iterations and phantom size. Bias with OSEM was observed for regions enclosed within a 5- to 10-fold hotter background. For cardiac studies OSEM 2 × 12 and OSEM 4 × 16 resulted in 13% and 21% higher pixel values and 9% and 15% higher MRglu values compared with FBP. Smoothing decreased all these values to 2%. Similar results were found for most tumor studies. For brain studies MRglu of FBP and OSEM 4 × 16 agreed within 2%. Use of OSEM image-derived input functions for cardiac PET studies resulted in a decrease in calculated MRglu of about 15%. Conclusion: For most PET studies OSEM has equal quantitative accuracy as FBP. The higher pixel and MRglu values are explained by the better resolution of OSEM. However, OSEM does not provide accurate image-derived input functions for FDG cardiac PET studies because of bias in regions located within a hotter background.
To date reconstruction of dynamic PET studies is performed primarily using filtered backprojection (FBP). This algorithm is fast and yields reliable quantitative results. However, for data with poor statistics, such as PET data, FBP results in poor image quality because of streak artifacts and low signal-to-noise ratio (SNR). These effects are even more pronounced when attenuation correction is based on transmission (Tx) scans. Iterative reconstruction algorithms can be used to overcome these limitations.
Maximum likelihood expectation maximization (MLEM) iterative reconstruction for emission tomography was first developed by Shepp and Vardi (1). Hudson and Larkin (2) proposed an ordered-subset expectation maximization (OSEM) implementation of the algorithm. Introduction of the latter algorithm decreased the reconstruction time considerably and made it feasible to apply OSEM in daily clinical routine.
Several studies have evaluated the characteristics of the expectation maximization algorithm for use in PET (3–12). Miller and Wallis (8) performed phantom studies to assess the effect of MLEM on PET and SPECT image contrast, resolution, and noise as a function of the number of iterations. The studies showed that MLEM resulted in improved image contrast and SNR depending on the number of iterations. Liow et al. (6) showed that, for three-dimensional PET, MLEM reconstructions resulted in better resolution than did FBP. Reader et al. (9) compared several three-dimensional reconstruction techniques for PET, showing that, compared with FBP, three-dimensional OSEM gave the best contrast at the cost of increased noise. Disadvantages of OSEM, however, included its relatively slow convergence, amplification of noise with increasing number of iterations, and the dependence of its characteristics on source distribution. The number of iterations required to achieve reliable quantitative results while keeping noise within acceptable levels should be carefully selected, as described by Wang et al. (11) and de Jonge and Blokland (13). A clinical evaluation of OSEM for attenuation-corrected whole-body PET studies was performed by Lonneux et al. (7). This study revealed that AC-OSEM images were less noisy and easier to interpret than FBP images.
Although the characteristics of OSEM have been investigated extensively and its superior image quality compared with FBP is well documented (7), most studies have focused on image quality of OSEM for static diagnostic whole-body PET studies. Data on the performance of OSEM for dynamic quantitative PET studies are limited. Katoh et al. (5) observed higher reproducibility and lower variability in the metabolic parameters obtained from iterative median root prior reconstructed images compared with those obtained from FBP images. They recommended use of median root prior reconstructions for quantitative myocardial 15O PET studies. The application of iterative reconstruction techniques for dynamic PET studies of different organs, however, still needs to be evaluated.
Recently, an OSEM algorithm has become widely available as part of commercial software for the ECAT HR+ PET scanner (CTI/Siemens, Knoxville, TN). Consequently, increased use of OSEM can be expected. Therefore, an analysis of the performance of OSEM is needed to warrant its use in quantitative dynamic PET studies. In this study, the quantitative accuracy and SNR of this commercially available OSEM algorithm will be compared with those of FBP. First, phantom studies were performed to assess the quantitative accuracy and SNR of reconstructed emission scans as a function of noise equivalent counts (14) of emission and transmission scans, phantom size, and source distribution. Next, effects of OSEM versus FBP on tissue activity concentration and kinetic modeling were evaluated for a variety of 18F-FDG studies. Finally, use of image-derived input functions obtained from OSEM reconstructed data were addressed.
MATERIALS AND METHODS
Scans were acquired on an ECAT HR+ PET scanner (CTI/Siemens), the characteristics of which are well documented (15,16). Acquisitions can be performed in two-dimensional and three-dimensional modes. In this study all acquisitions were performed in two-dimensional mode. Randoms correction, using a delayed-window technique, and deconvolution-based scatter correction (17) are implemented as precorrections of the emission sinogram.
Phantom Studies
Acquisitions.
Dynamic phantom studies were acquired in two-dimensional mode as dynamic emission (Ex) scans with 10-min frames and 20-min intervals over a 14-h period. Emission scans were performed for the following phantoms: homogeneous phantoms of 2-, 5-, 10-, and 20-cm diameter, initially filled with an 18F solution of high concentration (300 kBq/mL); NEMA phantom (20-cm diameter) filled with an 18F solution (300 kBq/mL) and cold 5-cm-diameter inserts; and NEMA phantom filled with a moderate 18F background (40 kBq/mL) and a high-activity 11C insert (450 kBq/mL). Because of the 20-min half-life of 11C, an emission scan was acquired for 5 h only for the last phantom. All phantoms were positioned at 1 cm from the center of the field of view. After activity had decayed to background level, Tx scans of 2, 5, 10, 15, 30, and 60 min were acquired.
In addition to these phantom measurements, line spread functions (LSFs) were obtained by scanning a line source of 1-mm thickness positioned at 1 cm from the center of the field of view. These latter measurements were performed for comparison with apparent resolution measured with the NEMA phantom insert studies, as it has been shown that that resolution convergence is object dependent and that, therefore, the line spread function may not represent the resolution in more realistic emission distributions (18,19).
Reconstructions.
All Ex data were reconstructed with measured attenuation using FBP with a Hanning filter at 0.5 of the Nyquist frequency and OSEM reconstructions (CTI version 7.1.1) with various numbers of iterations and subsets (2 × 12, 3 × 24, and occasionally 5 × 12, 5 × 24, and 12 × 24). OSEM with 2 × 12 iterations was used as default. With OSEM reconstruction a nonnegativity constraint is applied, which means that negative line of response (LOR) values (because of randoms correction) and negative pixel values are set to zero. The 60-min Tx scan was used for all reconstructions except when analyzing the contribution of Ex and Tx noise equivalent counts (NECs) to image noise, which were reconstructed using all measured Tx scans. Attenuation correction was performed by multiplying the emission sinograms with attenuation correction factors before reconstruction. To improve statistics of the attenuation correction, transmission scan data were smoothed with an 8-mm full width at half maximum (FWHM) Gaussian filter, as implemented by the manufacturer (CTI/Siemens).
Analyses.
For each dynamic scan, image noise or pixel heterogeneity and quantitative accuracy were derived from region-of- interest (ROI) analysis. Image noise was defined as the coefficient of variation (COV, 100 × SD/mean [%]) of the pixel values within a homogeneous ROI. Bias was defined as the deviation of the mean pixel value within an ROI from the actual activity concentration. The actual activity concentration was obtained by taking samples from the phantom and measuring these in a cross-calibrated well counter, which had an estimated accuracy within 2%. For the homogeneous phantoms a circular ROI with half the diameter of the phantom was positioned centrally in the phantom. A potential drawback of using large ROIs could be that small low-frequency nonuniformities in the phantom could contribute to the COV, thereby overestimating image noise. An evaluation using the mean COV of several smaller ROIs, however, illustrated that the effects of nonuniformities were negligible (<2%). For the NEMA phantoms (with both cold and 11C inserts) an ROI of 5-cm diameter was positioned centrally within the background area and 2-cm-diameter ROIs were positioned centrally within the inserts. ROIs were placed in planes 6–57, excluding the first and last five planes at the edges of the axial field of view, because of the larger variation in scanner sensitivity in the first and last five planes. For all scans, logfiles of the acquisition were generated, listing the number of counts (both random and true) for each frame, thus enabling calculation of whole-scanner NEC. Data were analyzed as a function of whole-scanner NEC or activity concentration. The relationship between image noise and the NEC of Ex and Tx scans can be described by:
 Eq. 1
where C1 and C2 are fit parameters representing the contribution of the emission (NECEx) and transmission (NECTx) scan NEC to the image noise (20). NECEx is given by:
Eq. 1
where C1 and C2 are fit parameters representing the contribution of the emission (NECEx) and transmission (NECTx) scan NEC to the image noise (20). NECEx is given by:
 Eq. 2
where T is the number of true coincidences, S is the number of scattered coincidences, R is the number of random coincidences, and f is the fraction of the field of view occupied by the phantom. The scatter fraction was estimated from a reconstruction with and without scatter correction. NECTx is given by:
Eq. 2
where T is the number of true coincidences, S is the number of scattered coincidences, R is the number of random coincidences, and f is the fraction of the field of view occupied by the phantom. The scatter fraction was estimated from a reconstruction with and without scatter correction. NECTx is given by:
 Eq. 3
Eq. 3
For NECTx the contribution of scattered coincidences was assumed to be negligible because rod windowing was used during transmission scanning. In addition, the relationship between image noise and NECEx as a function of the number of iterations of OSEM was studied. For the latter analysis a 60-min transmission scan was used for which the NEC contribution to the image noise is negligible. The relationship between image noise and emission NEC can now be described by:
 Eq. 4
which for power law coefficient (PL) = 0.5 corresponds to Equation 1. Instead of assuming a square root dependence of image noise on NEC, however, the PL was allowed to vary. Deviation from a square root dependence might be caused by the nonnegativity constraint of OSEM, as will be discussed later. The variation of C1 and PL was analyzed as a function of the number of iterations.
Eq. 4
which for power law coefficient (PL) = 0.5 corresponds to Equation 1. Instead of assuming a square root dependence of image noise on NEC, however, the PL was allowed to vary. Deviation from a square root dependence might be caused by the nonnegativity constraint of OSEM, as will be discussed later. The variation of C1 and PL was analyzed as a function of the number of iterations.
In addition to noise and bias analyses, activity profiles across the edge of insert and background of the NEMA phantom were generated. The shapes of these activity profiles were analyzed as functions of the number of iterations of OSEM and compared with the FBP data. This latter analysis was performed for comparison with resolutions measured with the LSF studies.
Patient Studies
Acquisitions.
Two-dimensional FDG dynamic emission scans for five cardiac, three lung tumor, and three brain studies were used. For the lung tumor studies three separate lesions were imaged on average, thus allowing an OSEM–FBP comparison for a total of nine separate tumors of different shape and size. After the patient was positioned, a 15-min Tx scan was acquired for the purpose of attenuation correction of the subsequent Ex scan. This two-dimensional dynamic emission scan was started simultaneously with injection of 370 MBq FDG and consisted of 39 frames with durations ranging from 5 s at the beginning to 300 s at the end of the scan. For heart and brain studies, input functions were measured using a continuous flow-through automatic blood sampling device (21).
Reconstructions.
Patient data were reconstructed using FBP with a Hanning filter at 0.5 of the Nyquist frequency, OSEM with 2 iterations of 12 subsets and 4 iterations of 16 subsets, and the same OSEM reconstructions but with 5-mm FWHM Gaussian postsmoothing of the reconstructed image. Smoothing was performed to reduce the image resolution from about 5-mm to about 7-mm FWHM, thereby matching it to that of the image resolution obtained with FBP Hanning 0.5. Resolution matching was required to assess the extent to which differences between reconstructions could be explained by resolution effects, as shown by Carson et al. (22). The size of the kernel was determined by smoothing the OSEM images of the last frame of each dynamic scan with 3-, 4-, 5-, 6-, and 7-mm FWHM Gaussian filters. ROI values (provided in the following paragraph) derived from smoothed OSEM and FBP images for all studied patients showed best agreement when a 5-mm FWHM Gaussian filter was used. The 5-mm FWHM filter was applied for all studies, though slightly smaller or larger filter sizes may have been more appropriate for individual cases, because resolution is not uniform throughout the image (16) and is object dependent for OSEM reconstructions (9,19). In practice, however, use of a varying postsmoothing filter is not feasible. For the lung tumor studies only OSEM with 2 × 12 iterations was used, because image quality was too poor for 4 × 16 iterations.
Analyses.
Tissue time–activity curves and activity concentrations were derived from manually positioned ROIs. For cardiac studies a template consisting of 13 ROIs (6 for the basal part, 6 for the distal part, and 1 for the apex) was positioned on short-axis slices. In addition, ROIs for septum, apex, and lateral wall of the myocardium were defined on transaxial slices. For the lung tumor studies 50% isocontours were applied. All isocontours of one tumor across multiple axial slices were grouped to obtain a volume of interest (VOI). This VOI was used to derive the tumor time–activity curve. In total, nine tumor VOIs were defined in three patient studies. Finally, for the brain studies 1-cm circular ROIs were defined in representative areas of gray matter. In addition to arterial blood sampling, image-derived input functions were obtained for the cardiac studies. For lung studies only image-derived input functions were used. For cardiac studies VOIs were drawn on the aorta ascendens and left ventricle, which are the most commonly used structures for deriving input function, and for lung tumor studies VOIs were drawn as described elsewhere (23). The size of these VOIs was at most half the size of the dimensions of the vascular structure to minimize partial-volume and spillover effects.
First, OSEM-reconstructed activity concentrations were evaluated for data with high NEC values by comparing mean ROI values obtained with FBP with those obtained during the last 15 min of the PET scan (45–60 min; last three sinograms were added before reconstruction). To evaluate the agreement of the reconstructed data for the entire PET scan, tissue time–activity curves in combination with a measured arterial plasma curve (input function) were used to calculate the metabolic rate of glucose (MRglu) using both a standard two-tissue compartment model with blood volume parameter and Patlak analysis. Finally, the agreement of image-derived input functions using OSEM and FBP was evaluated. First, the area under the curve (AUC) was calculated for each image-derived input function. Second, the average ratio of activity concentration between OSEM and FBP for 20–60 min of the PET scan was determined.
RESULTS
Phantom Studies
Figure 1A shows the relationship between image noise and NECEx for a 20-cm-diameter homogeneous phantom as obtained with FBP reconstructions. Results are given for three different Tx scans. The corresponding relationship for OSEM reconstructions is given in Figure 1B. Qualitatively it can be seen that the relative contribution of NECTx was smaller for OSEM than for FBP. Quantitatively this is illustrated in Table 1, where values of the fit parameters C1 and C2 using Equation 1 are listed. The fit parameters were determined on the basis of all measured Tx scans. The ratio C2/C1, representing the relative contribution of NECTx to the image noise compared with NECEx, was smaller for OSEM than for FBP. The SE of the fitted ratio C2/C1 was around 20% of the values reported in Table 1. Although this uncertainty is relatively large, it is small compared with the difference in C2/C1 ratio obtained for different OSEM reconstructions.

Image noise (COV) as function of emission scan NEC (NECEx) for Tx of 2, 5, and 30 min for FBP reconstruction (A) and OSEM 2 × 12 reconstruction (B). Results obtained with other transmission scan durations have been omitted for clarity.
Values for C1, C2, and Ratio C2/C1 for Various Reconstruction Methods
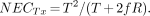
Figure 2 shows the dependence of image noise on the number of iterations for OSEM. To exclude the effects of transmission scan noise, all data were obtained with a transmission scan of 60 min. As expected, image noise increases with an increasing number of iterations (6,8–12,24). In addition, the curves become less steep with an increasing number of iterations, indicating a deviation from a square root dependency (note the logarithmic scale of the vertical axis). Parameters C1 and PL fitted according to Equation 4 are presented in Table 2, illustrating a clear deviation of the PL value from 0.5 (corresponding with a square root relationship).
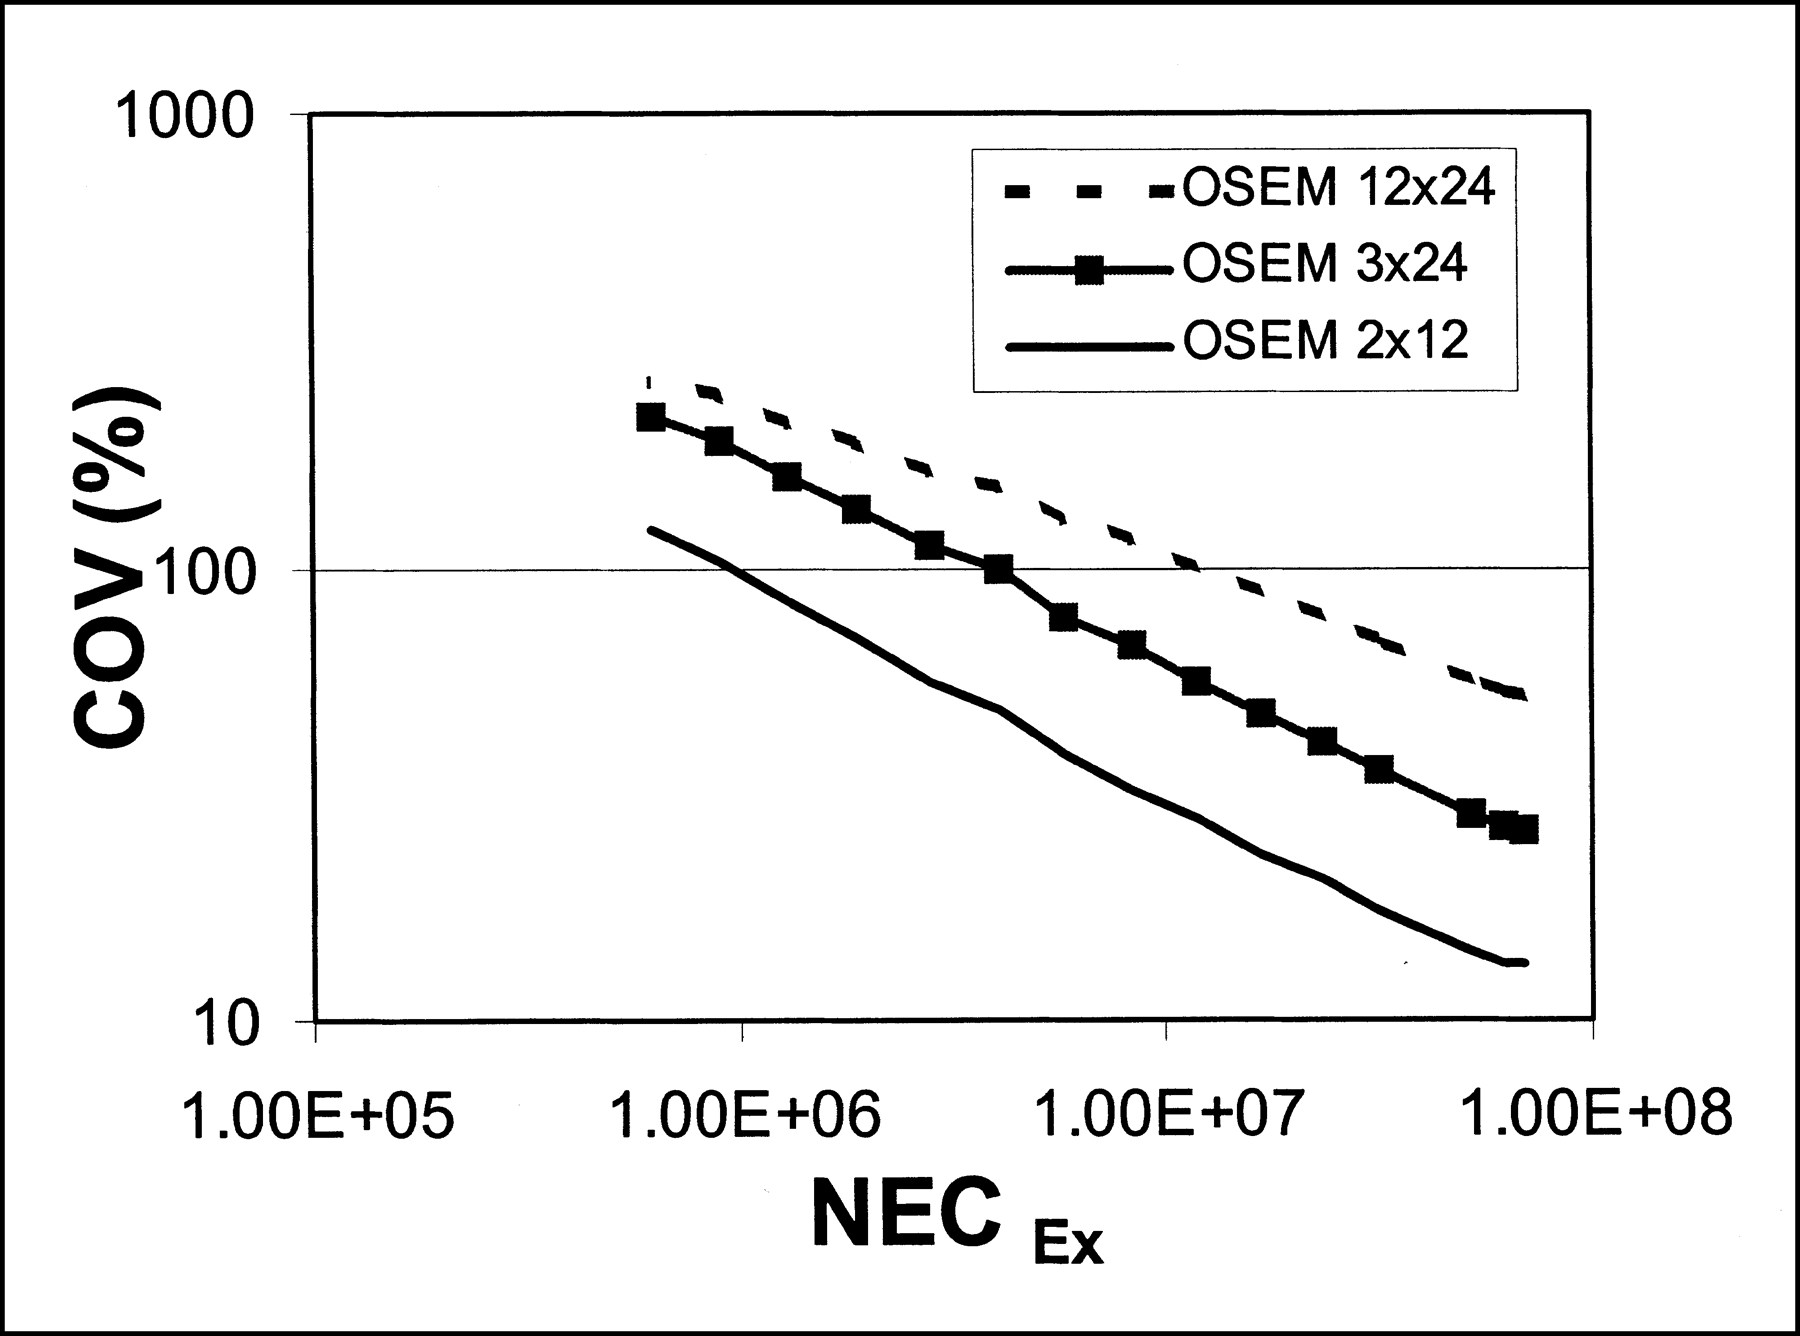
Image noise (COV) as function of emission scan NEC (NECEx) obtained with 2 × 12, 3 × 24, and 12 × 24 iterations of OSEM.
Values of C1 and PL of Equation 4 for Various OSEM Iterations
The relationship between image noise and NECEx as a function of phantom size is presented in Figure 3A. For clarity, only data for 5-cm- and 20-cm-diameter phantoms are shown. It can be seen that for a large object (20-cm diameter) image noise of OSEM 2 × 12 reconstructed data was lower than that of FBP. For small objects (10-cm diameter or smaller) image noise of OSEM 2 × 12, however, was larger than that of FBP. These results indicate that the geometric dependency of image noise is different for OSEM and FBP. This is even more apparent in Figure 3B, where the ratio of image noise for OSEM and FBP as function of image contrast is presented. It can be seen that for relative hot regions image noise of OSEM was larger than that of FBP, whereas for relative cold regions the opposite was observed.

(A) Image noise (COV) as function of emission scan NEC (NECEx) obtained with 5-cm-diameter and 20-cm-diameter phantoms. (B) Ratio of image noise within insert region (COVinsert) of NEMA phantom between OSEM 2 × 12 and FBP as function of image contrast, defined as ratio of activity concentration (AC) between insert and background (BG) regions.
For homogeneous phantoms of 5- to 20-cm diameter, reconstructed activity concentrations were within 3% (with a 1% SD) of the activity concentrations derived from samples for all applied reconstructions. Linearity with activity was within 2% for NECEx of 106–108 counts. For clinical studies NECEx is usually between 106 and 107 counts. Because images of a 2-cm-diameter phantom suffer from resolution recovery, a large ROI was positioned around the phantom to obtain the total number of counts. Linearity of the total counts was within 4% for all OSEM reconstructions and within 3% for FBP for an activity concentration range of 20–300 kBq/mL. A maximum deviation of 4% between OSEM and FBP reconstructed total counts was found.
Data of the NEMA phantom with the hot 11C insert were used to assess the quantitative accuracy as a function of image contrast. During this study the NECEx varied from about 107–108 counts, which is better than normally encountered in clinical practice. The randoms/trues fraction ranged from 0.06 to 0.81. In Figure 4 the ratio of reconstructed and actual activity concentration is given for various OSEM reconstructions and FBP as a function of image contrast (ratio of true activity concentration between insert and background). For image contrasts <0.3, that is, for insert activity concentration < one-third of the background activity concentration, an increasing bias (up to a factor of 3) was observed. With an increasing number of iterations, bias decreased from a factor of 3 to a factor of 1.5 (for OSEM 2 × 12 and OSEM 5 × 24, respectively). No improvement of bias was observed with further increases of the number of iterations. In fact, occasionally bias increased with more iterations. The randoms/trues fraction was <0.12 for data with image contrast <0.3.

Bias as function of image contrast, defined as ratio of activity concentration (AC) between insert and background regions (BG). Note that image contrast <1 corresponds to cold spots in hot background.
In Figures 5A and B, LSF and activity profiles across the edge of cold insert and hot background, respectively, in the NEMA phantom are shown. Figure 5A illustrates that all OSEM reconstructions result in a spatial resolution of about 5 mm FWHM. This is close to the resolution of FBP with a ramp filter (16). For FBP with a Hanning filter a resolution of about 7 mm FWHM was observed. Figure 5B shows that for the same OSEM reconstructions, edge activity profiles are less sharp than those obtained with FBP Hanning 0.5. Only for OSEM using 3 × 24 or more iterations do these edge activity profiles seem to be as sharp as those of FBP Hanning 0.5.
(A) Line spread functions for FBP, OSEM 1 × 16, OSEM 2 × 12, and OSEM 3 × 24. (B) Activity profiles across edge of cold insert and warm background of NEMA phantom for FBP, OSEM 1 × 16, OSEM 2 × 12, and OSEM 3 × 24.
Patient Studies
The agreement between OSEM and FBP reconstructed activity concentrations was assessed using the last 15 min of the emission scans. On average, NECEx for the last three frames of 5 min was 5 × 10⁶ counts; thus, the NECEx of the summed sinogram equaled 1.5 × 10⁷ counts. In Table 3 the ratio between OSEM and FBP ROI values is given for each OSEM reconstruction and for all patient studies performed. For cardiac studies using a template ROI on short-axis slices OSEM 2 × 12 and 4 × 16 yielded values 10% and 8% higher than those of FBP, respectively. Smoothing decreased the difference between FBP and OSEM ROI values only slightly. However, for ROIs defined on axial slices, OSEM 2 × 12 and 4 × 16 yielded values 13% and 21% higher than those of FBP, respectively; after smoothing, results obtained with OSEM were not significantly different from those of FBP. For tumor and brain studies, results were similar to those obtained with the cardiac studies and axial ROIs. For brain studies, OSEM 2 × 12 with and without smoothing yielded 2% and 6%, respectively, lower ROI values than for FBP. OSEM 4 × 16 data agreed well with FBP. For all studies a good proportionality between FBP and OSEM reconstruction methods was found, yielding Pearson’s correlation coefficients >0.98.
Ratio of ROI Values (OSEM/FBP) for Interval 45–60 Minutes of FDG Scan
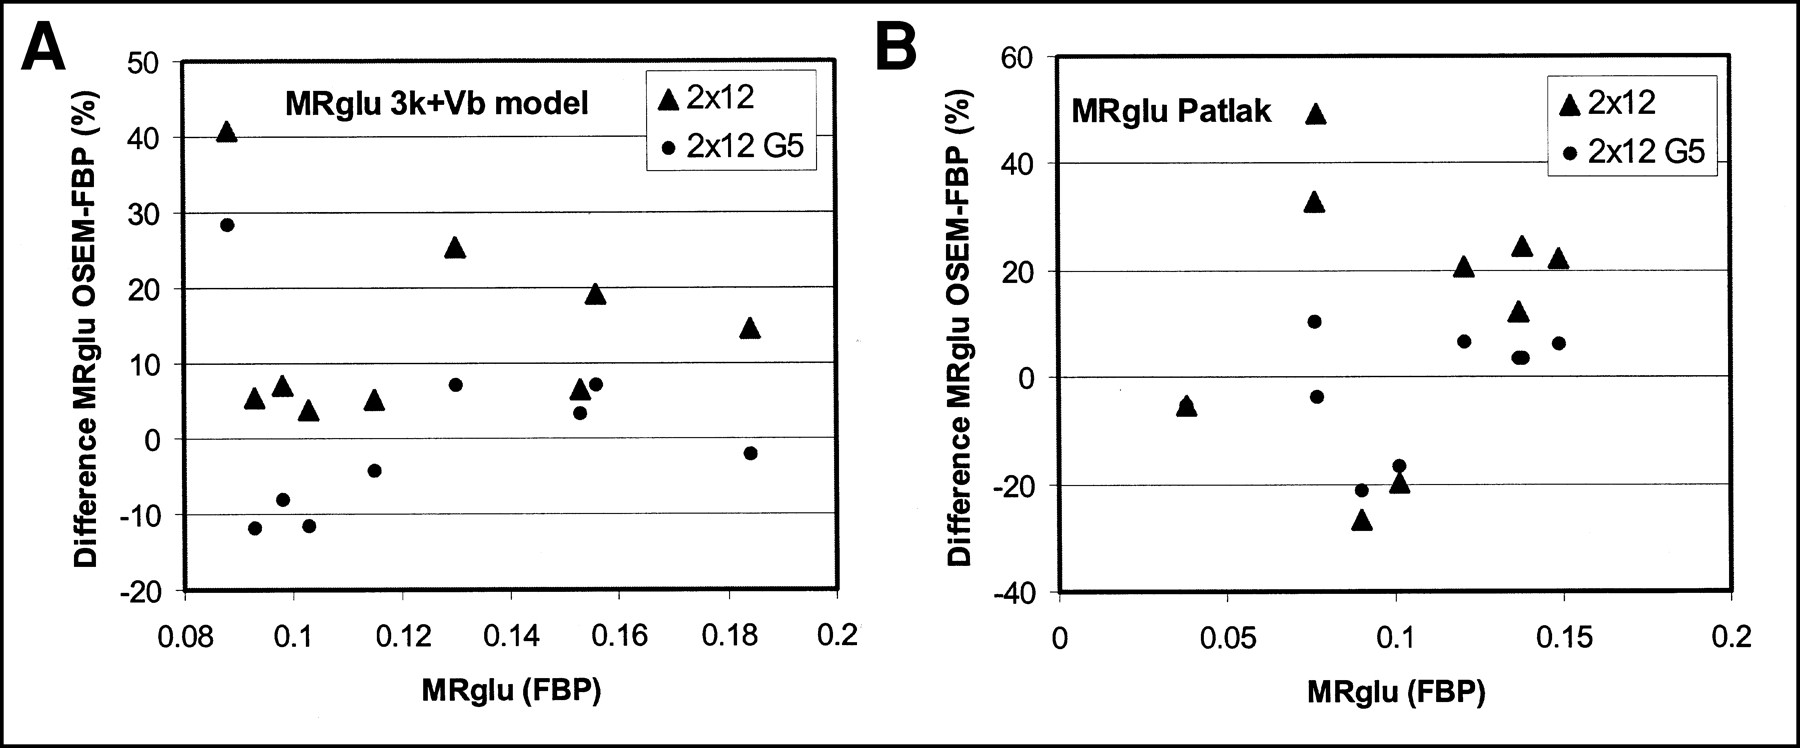
Tissue time–activity curves were used in combination with arterial input functions to calculate the metabolic rate of glucose. In Figures 6A and B, MRglu values obtained for nine lung tumors are presented. In these figures the percentage difference in MRglu derived from OSEM data compared with FBP data is plotted against MRglu based on FBP data using a standard two-tissue compartment model and Patlak analysis. Data presented in Figures 6A and B show that large differences between MRglu OSEM and MRglu FBP exist for tumor studies but that average differences decreased when resolution matching was applied. These differences were smaller for cardiac and brain studies because of the better statistics of the ROI values as a result of larger ROI or higher uptake. Furthermore, a good proportionality between MRglu OSEM and MRglu FBP was observed for all performed studies. Pearson’s correlation coefficients were >0.98 (lowest value for lung tumor studies). In Table 4 average ratios of MRglu OSEM and MRglu FBP, obtained with a two-tissue compartment model, are presented for all patient scans. These data indicate that, without smoothing, OSEM provided higher MRglu values than did FBP and that resolution matching reduced differences.

Percentage difference of lung tumor MRglu values (μmol/mL/min) between OSEM and FBP data as function of MRglu values derived from FBP data using standard two-tissue compartment model with blood volume (Vb) parameter (A) and Patlak analysis (B). Data were obtained for nine lung tumors.
Ratio of MRglu (OSEM/FBP) for Various OSEM Reconstruction Techniques
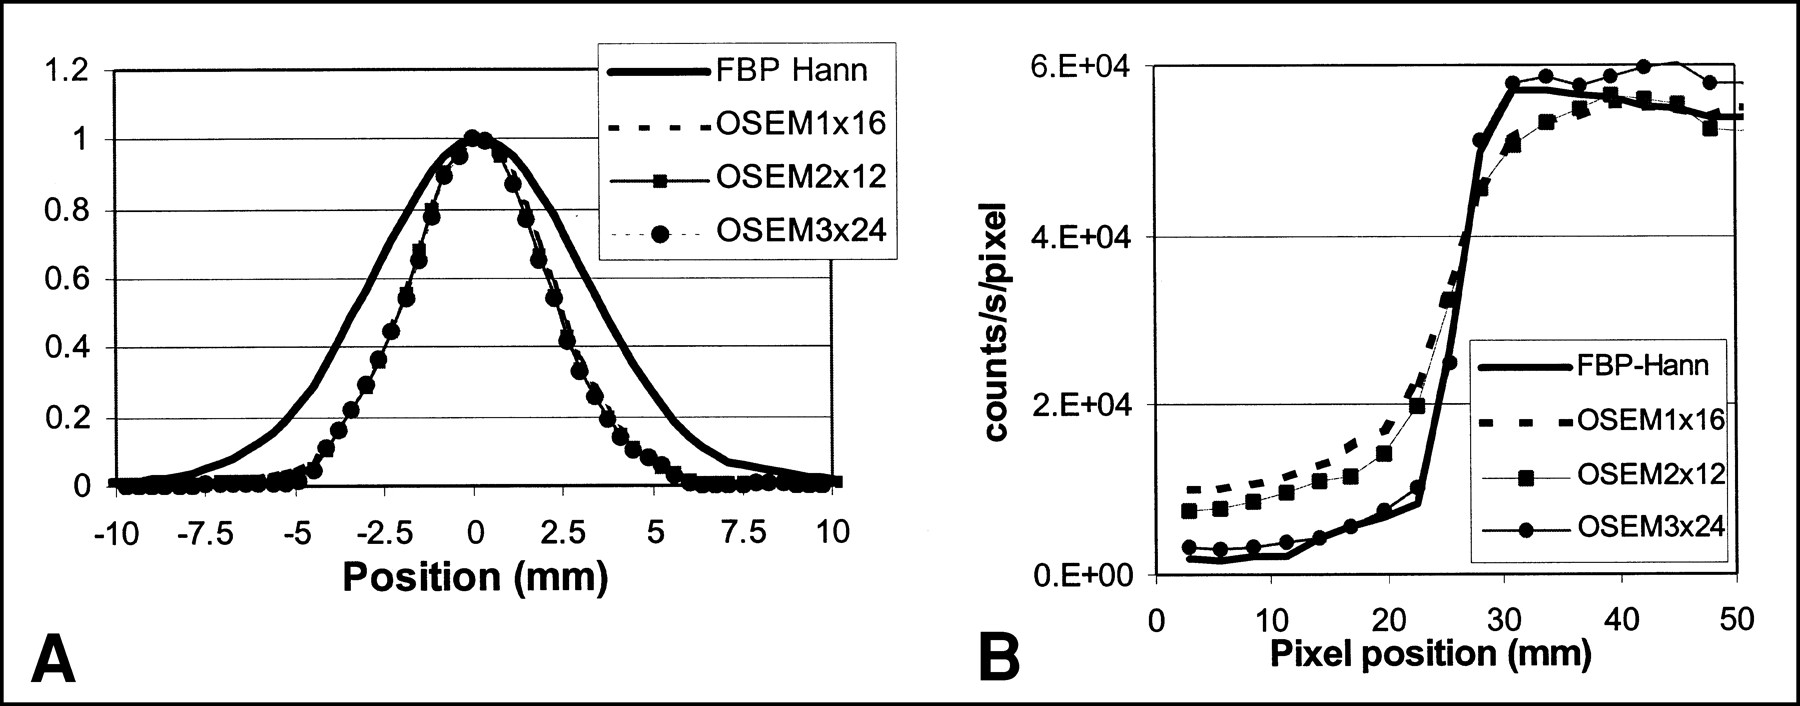
Finally, the use of image-derived input functions based on ROIs of the aorta ascendens and left ventricle was evaluated. Good agreement within 5% between the activity concentration values of the input functions derived from FBP and OSEM for the first 5 min of the scan was found. For the last 30 min of the scan, however, OSEM-derived input functions for the aorta ascendens yielded 15% or higher activity values than those obtained with FBP, as shown in Figure 7A. This difference was observed for all studies. For the aorta ascendens the ratio of AUC between OSEM and FBP ranged from 1.03 to 1.09 (mean, 1.06), with only minor differences between different OSEM reconstruction methods. Values of these ratios were not affected by smoothing. For the left ventricle this ratio ranged from 1.03 to 1.13 (mean, 1.06) for all OSEM reconstruction methods. The average ratio of activity concentrations for the interval of 20–60 min between the OSEM reconstructions and FBP showed larger deviations. For the aorta ascendens this ratio equaled 1.32 and 1.27 for OSEM 2 × 12 and 4 × 16, respectively. For the left ventricle it was 1.29 and 1.27 for OSEM 2 × 12 and 4 × 16, respectively. Smoothing did not affect these ratios. In Figure 7B the ratio of activity concentration between OSEM and FBP for the left ventricle ROI is given as a function of image contrast, which is defined as the ratio of average activity concentration between left ventricle and myocardium. The figure indicates an increasing bias with image contrast.
(A) Example of time–activity curve from ROI on aorta ascendens for last 35 min of FDG scan. (B) Bias of left ventricular (LV) activity concentration (AC) as function of image contrast for OSEM 2 × 12 with and without smoothing and OSEM 4 × 16 with and without smoothing.
DISCUSSION
Phantom Studies
The relationship between image noise and NECEx and NECTx has been extensively studied for FBP reconstruction (25–28). Budinger (25) found that this relationship could be described by COV (%) = 120 × N3/4/T1/2, where N is the number of resolution elements and T is the number of events. Huang et al. (27) further developed this relationship by replacing T with the effective number of events, which incorporated the contribution of noise in Tx and blank scans. Strother et al. (14) showed that image noise has a square root dependence with the NEC rate, which includes the effects of randoms and scatter correction. Using NEC, Holm et al. (26) and Beyer et al. (20) developed relationships between image noise and NEC of both emission and transmission scans. All these studies showed a square root dependence of image noise on NEC for FBP. Here, Equations 1 and 4 were derived from the relationship given by Beyer et al. (20). In this study the square root dependence between image noise and NEC of Ex and Tx scans remained valid for OSEM with a moderate number of iterations (2 × 12).
The data given in Table 1 reveal that the contribution of NECTx to noise COV was smaller for OSEM than for FBP, which is in close agreement with clinical data reported by Lonneux et al. (7). One can conclude that OSEM leads to improved image quality with respect to SNR for attenuation-corrected PET scans compared with FBP. Recently, weighted attenuation schemes for OSEM reconstruction have been developed (29) that incorporate the attenuation correction within the OSEM reconstruction. In this study, attenuation correction factors were applied before reconstruction. With the new weighted OSEM schemes, a further reduction of the contribution of noise in the Tx scan NEC to the image noise can be expected, which would further improve image quality for attenuation-corrected whole-body studies, potentially allowing shorter Tx scans. Further studies are required to quantify this potential improvement.
When the number of iterations was increased, the relationship between image noise and NECEx could no longer be described by a square root relation, as the PL coefficient of Equation 4 progressively deviated from 0.5. This effect indicates that noise amplification with increasing number of iterations is not equal for all NECEX but increases with decreasing NEC. This observation might be explained by the positivity constraint applied in OSEM; that is, the cutoff of negative values will limit the increase in COV, as explained by Qi and Leahy (30). This observation is in contradiction with that of Budinger (25). This may be caused by differences in NEC range because of the use of different PET scanners. In this study data were acquired with the ECAT HR+, which features small crystals that result in high resolution, but which also has a limited number of counts per LOR. Bayesian iterative reconstruction methods have been developed to avoid noise amplification with increasing iteration numbers. This may result in better convergence of reconstructed data while keeping image noise within acceptable levels (5,12,31–37). Investigation of the usefulness of these new algorithms, however, is beyond the scope of this study.
Holm et al. (26) and Pajevic et al. (28) showed that image noise depends on source distribution or phantom size for FBP reconstructions. In this study the geometric dependency of the relationship between image noise and NEC found for OSEM was different from that found for FBP. For small hot spot regions or phantoms OSEM resulted in higher image noise, whereas for large regions or phantoms OSEM resulted in lower image noise, as shown in Figure 3. This relationship between image noise and phantom size for OSEM might be explained by variation of resolution with phantom size or object-dependent resolution recovery, as shown by Yao et al. (19), Liow and Strother (18), and Pan et al. (38). The resolution experiment showed that OSEM has higher resolution for a line source (very small object), whereas it has poorer resolution for larger phantoms, as will be discussed later. The clinical relevance of this observation is that the improved image quality seen in whole-body studies is caused mainly by the improved noise reduction in the (large) background regions.
Quantitative accuracy for OSEM reconstruction was similar to that for FBP for most phantom studies. In general, accurate activity concentrations or ROI values within 3% were obtained. Furthermore, quantitative accuracy of hot spots of both OSEM and FBP did not depend on phantom size and NECEx. Large bias, however, was found for regions enclosed within a 5- to 10-fold hotter background. Part of this bias is explained by lack of convergence for a smaller number of iterations, as shown in Figure 4. Note also that for hot regions within a colder background, convergence is obtained earlier than for a cold region within a hotter background. The remaining bias for a large number of iterations might stem from the implementation of randoms correction as a precorrection in sinogram space. LORs intersecting the cold region have a limited number of prompts, whereas the hot background induces a relatively high randoms rate. Online correction of the randoms may then result in negative “trues” for these LORs. With OSEM these negative values are set to zero, resulting in bias specifically for regions enclosed within hotter backgrounds. In clinical studies OSEM should be used with care for cold regions enclosed within hotter areas, such as white matter regions in brain studies and the left ventricle in myocardial studies. New OSEM algorithms such as the shifted Poisson model (32), which can take the effects of randoms corrections into account, are currently under development. At present, these new algorithms are not yet widely available and their use has not been fully validated for PET studies.
Differences in resolution between data obtained with a rod source (LSF) and the NEMA phantom again indicate the difference in speed of convergence for small hot regions within a colder background compared with regions enclosed within a hotter background. Generally, it is assumed that improved resolution can be obtained with OSEM. The current data suggest that careful assessment of image noise versus convergence trade-off as a function of the number of iterations should be performed for each object or organ being scanned. This conclusion agrees with that of Reader et al. (9) and Yao et al. (19), who observed that the performance characteristics of OSEM depended on source distribution. However, in the study of Reader et al. (9), neither resolution nor the application of OSEM to dynamic studies was considered.
Patient Studies
For most studies, ROI value (45–60 min), time–activity curve, and MRglu analyses indicated that FBP and OSEM reconstructions after resolution matching resulted in essentially identical tissue ROIs, provided that sufficient iterations were applied. Use of template ROIs on short-axis slices for myocardial PET studies showed a somewhat different result. For these studies the effects of smoothing and number of iterations were very small because use of short-axis slices reduces resolution during the reorientation process and because use of template ROIs includes areas with high and low activity concentrations. Especially, partial inclusion of left ventricle voxels and spillover effects may mask the effects of resolution differences among various OSEM reconstructions. For brain studies OSEM with 4 × 16 iterations was required to obtain images with sufficient accuracy, that is, with full convergence. This result is in close agreement with the data obtained during the phantom study indicating that for heterogeneous activity distributions, such as cold regions within a hotter background, convergence is slower than for small hot regions within a colder background, such as tumors and myocardium. It can therefore be concluded that, for tissue ROIs, OSEM and FBP provide similar results and that OSEM without smoothing provides an opportunity to achieve higher resolution resulting in fewer partial-volume effects. Optimization of the number of iterations is, however, required for each organ being scanned, as previously shown by Yao et al. (19).
In contrast, use of image-derived input functions based on OSEM reconstructions seemed more problematic over the interval of 20–60 min after injection. Input functions derived from the aorta ascendens and left ventricle showed 30% higher activity concentrations than in corresponding FBP data. The bias in activity concentration would cause a similar large effect on MRglu calculations. Van der Weerdt et al. (39) showed good agreement (within 5%) between image-derived input functions and arterial sampling using FBP. With OSEM this agreement would deteriorate to a difference of about 35%. Data presented in Figure 4 suggest that part of this bias can be explained by image contrast. These results indicate the limitation of the current OSEM method to obtain accurate quantitative results in the presence of high image contrasts. Other OSEM methods, such as the newly developed shifted Poisson model (32), that take the effects of randoms correction into account might improve the quantitative accuracy of OSEM reconstructions.
CONCLUSION
Contribution of Tx scan noise into the SNR of the reconstructed image is smaller for OSEM than for FBP. After resolution matching, SNR of OSEM images is better than that of FBP images. OSEM and FBP have different relationships between image noise and NEC depending on phantom size and source distribution. For most situations OSEM provides accurate quantitative results within 3%, but a large bias (up to 50%) can be expected for regions within a 5- to 10-fold hotter background. Patient data indicated that for brain, myocardium, and tumor ROIs, OSEM and FBP provide equivalent results and that OSEM without smoothing provides an opportunity to achieve higher resolution resulting in fewer partial-volume effects. Use of image-derived input functions with OSEM may result in incorrect MRglu values because of significant bias of the input function. Both phantom and clinical data showed that this bias is related to image contrast and may be caused by the nonnegativity constraint of OSEM.
Acknowledgments
Jan-Jaap Blok, Martijn Kluizenaar, Arno van der Weerdt, and Lucas Klein are gratefully acknowledged for their help with ROI definitions.
Footnotes
Received Aug. 14, 2000; revision accepted Dec. 28, 2000.
For correspondence or reprints contact: Ronald Boellaard, MD, Clinical PET Center, University Hospital Vrije Universiteit, P.O. Box 7057, 1007 MB Amsterdam, The Netherlands.
REFERENCES
In this issue


Jump to section
Related Articles
Cited By...
- Consensus Recommendations on the Use of 18F-FDG PET/CT in Lung Disease
- Forward to the Past: The Case for Quantitative PET Imaging
- A Monte Carlo Study of the Dependence of Early Frame Sampling on Uncertainty and Bias in Pharmacokinetic Parameters from Dynamic PET
- Effects of Image Characteristics on Performance of Tumor Delineation Methods: A Test-Retest Assessment
- Using the NEMA NU 4 PET Image Quality Phantom in Multipinhole Small-Animal SPECT
- Optimization of the Injected Activity in Dynamic 3D PET: A Generalized Approach Using Patient-Specific NECs as Demonstrated by a Series of 15O-H2O Scans
- HRRT Versus HR+ Human Brain PET Studies: An Interscanner Test-Retest Study
- Accuracy of 3-Dimensional Reconstruction Algorithms for the High-Resolution Research Tomograph
- Effect of Reconstruction Algorithms on Myocardial Blood Flow Measurement with 13N-Ammonia PET
- 18F-Labeled Bombesin Analogs for Targeting GRP Receptor-Expressing Prostate Cancer
- Prognostic Relevance of Response Evaluation Using [18F]-2-Fluoro-2-Deoxy-D-Glucose Positron Emission Tomography in Patients With Locally Advanced Non-Small-Cell Lung Cancer
- PET/CT: Challenge for Nuclear Cardiology
- Delayed Contrast Enhancement and Perfusable Tissue Index in Hypertrophic Cardiomyopathy: Comparison Between Cardiac MRI and PET
- Influence of Reconstruction Iterations on 18F-FDG PET/CT Standardized Uptake Values
- Number of Iterations When Comparing MLEM/OSEM with FBP
- Quantitative Comparison of Analytic and Iterative Reconstruction Methods in 2- and 3-Dimensional Dynamic Cardiac 18F-FDG PET
- Effects of Noise, Image Resolution, and ROI Definition on the Accuracy of Standard Uptake Values: A Simulation Study
- Perfusable Tissue Index as a Potential Marker of Fibrosis in Patients with Idiopathic Dilated Cardiomyopathy
- Clinical Implications of Different Image Reconstruction Parameters for Interpretation of Whole-Body PET Studies in Cancer Patients
- CT Attenuation Correction for Myocardial Perfusion Quantification Using a PET/CT Hybrid Scanner
- Postinjection Transmission Scanning in Myocardial 18F-FDG PET Studies Using Both Filtered Backprojection and Iterative Reconstruction
- PET Instrumentation and Reconstruction Algorithms in Whole-Body Applications
- Methods to Monitor Response to Chemotherapy in Non-Small Cell Lung Cancer with 18F-FDG PET
- Measurement of Perfusion in Stage IIIA-N2 Non-Small Cell Lung Cancer Using H215O and Positron Emission Tomography