


Abstract
The aim of the present study was to evaluate the effect of postinjection transmission scanning (Post-Tx) on both the qualitative interpretation and the quantitative analysis of cardiac 18F-FDG PET images. Furthermore, the accuracy of 2 different methods to correct for emission contamination was studied. An additional aim of this study was to compare images reconstructed with both standard filtered backprojection (FBP) and an iterative reconstruction algorithm (ordered-subset maximization expectation [OSEM]). Methods: Sixteen patients underwent dynamic 18F-FDG imaging. Both before injection of 18F-FDG and after completing the emission scan, a 10-min transmission scan was performed (Pre-Tx and Post-Tx, respectively). Images were reconstructed using both FBP and OSEM. The emission study reconstructed with Pre-Tx was considered to be the gold standard. Emission studies were also reconstructed with Post-Tx, with and without correction for emission contamination. Correction for emission contamination was performed with either transmission image segmentation (TIS) or by estimating the emission bias from the last emission frame (dwell profile [DP] method). All images were then compared by calculating ratios of 18F-FDG activity between corresponding myocardial segments in each patient. Furthermore, qualitative grading of 18F-FDG uptake was compared between the studies. Results: The mean ratio of 18F-FDG activity between segments from FBP-Post and FBP-Pre was 0.78 ± 0.08. When TIS and DP were used, the mean ratios were 0.80 ± 0.07 and 0.94 ± 0.06, respectively. The use of OSEM resulted in, on average, 2% lower values for 18F-FDG activity as compared with FBP. The mean normalized 18F-FDG uptake was higher in FBP-Post, especially in segments with decreased 18F-FDG activity. Only in the case of DP were no significant differences observed as compared with FBP-Pre. In general, qualitative analysis of the images showed that the agreement between the reconstruction methods was comparable with the reproducibility of FBP-Pre. Conclusion: Post-Tx for attenuation correction in cardiac 18F-FDG PET scans resulted in substantial underestimation of 18F-FDG activity. More accurate results were obtained with correction for emission contamination using DP. Differences in visual assessment of 18F-FDG images were small. Finally, iterative reconstruction could be used as an alternative to FBP in static 18F-FDG imaging of the heart.
One important property of PET scanning is the possibility of accurate correction for attenuation. Attenuation correction factors can be obtained from a transmission scan that, ideally, is acquired before the tracer is administered (Pre-Tx). PET using 18F-FDG is a clinically accepted and validated technique for the detection of myocardial viability (1–6). Most clinical studies have used qualitative interpretation of 18F-FDG images or a normalized value for 18F-FDG uptake to assess the presence of preserved glucose metabolism in hypoperfused segments. In such approaches, static 18F-FDG PET imaging is sufficient. Static imaging is commonly performed approximately 45 min after injection of 18F-FDG. This indicates that after Pre-Tx and 18F-FDG injection, patients need to stay in the PET scanner for a considerable time before the actual emission scan can be performed. To shorten study protocols, postinjection transmission scanning (Post-Tx) can be performed (7–9). A short study protocol not only is more efficient but it also reduces motion artifacts. With Post-Tx, the transmission scan is performed after administration of the tracer and, in cardiac studies, when 18F-FDG has already accumulated in the myocardium (usually 45–60 min after injection). Since high 18F-FDG levels can be reached in the myocardium, Post-Tx may be accompanied by substantial emission contamination. There is only limited information, however, about the qualitative and quantitative accuracy of 18F-FDG PET with Post-Tx in clinical studies (10). To our knowledge, no data are available concerning this issue in cardiac studies.
Correction for emission contamination in Post-Tx is possible by directly estimating emission spillover from emission data acquired just before or after the Post-Tx and subtracting this spillover from the Post-Tx (7,11) (dwell profile [DP] method) or by transmission image segmentation (TIS), in which theoretic values of attenuation coefficients (μ) are assigned to corresponding anatomic regions after segmentation of the transmission image into lung, soft tissue, and bone (12).
The aim of the present study was to evaluate the effect of Post-Tx on both the qualitative interpretation and the quantitative analysis of cardiac 18F-FDG PET images. Furthermore, the accuracy of 2 different methods (DP and TIS) to correct for emission contamination was studied.
An additional aim of this study was to compare images reconstructed with both standard filtered backprojection (FBP) and an iterative reconstruction algorithm based on ordered-subset expectation maximization (OSEM). Iterative reconstruction (13,14) of PET images has been shown to improve the resolution, image contrast, and signal-to-noise ratio (15,16) compared with FBP with at least equal quantitative accuracy in some clinical studies (17–19). Moreover, OSEM algorithms have recently been implemented in standard scanner software, which may lead to more frequent use in future PET studies. Data relating to the accuracy of OSEM in cardiac PET studies, however, are still limited.
MATERIALS AND METHODS
Patients
Sixteen consecutive patients with ischemic heart disease were included in this study. All patients had impaired left ventricular function due to previous myocardial infarction and were referred for assessment of myocardial viability. They were allowed to continue their medication but intake of diuretics was delayed until after the study. Patients had a light breakfast >4 h before 18F-FDG injection. None of the patients had clinical signs of decompensated heart failure. The study was approved by the Medical Ethics Committee of the VU University Medical Center and informed consent was obtained from each patient.
Clamping Procedure
All patients underwent a hyperinsulinemic, euglycemic clamp, as described by DeFronzo et al. (20), to enhance myocardial 18F-FDG uptake and ensure a metabolic steady state. The clamp was started approximately 2 h before injection of 18F-FDG and continued until the end of the scanning protocol. An antecubital cannula was used for infusion of insulin (human Velosulin, 100 U/mL; Novo Nordisk) and glucose (500 mL 20% glucose with 10 mL 14.9% KCl). A cannula in the contralateral arm was used to withdraw blood samples for monitoring blood glucose levels. A variable amount of IU insulin (15 times the body surface area of the patient in m2) was added to 50 mL 0.65% NaCl. This solution was infused at a constant rate of 13 mL/h after an initial priming dose of 60 mL/h followed by 30 mL/h, both lasting for 4 min. Blood glucose levels were determined every 10 min using a GlucoTouch (Lifescan) apparatus. To maintain normoglycemia (4–6 mmol/L, 72–108 mg/dL), the glucose infusion rate was adjusted after each blood glucose measurement, when needed.
Preparation of 18F-FDG
18F-FDG was synthesized by the BV Cyclotron VU (Amsterdam, The Netherlands) according to a modified method previously described by Hamacher et al. (21), using Nuclear Interface equipment. The radiochemical purity was >97%.
Scanning Protocol
All scans were performed in 2-dimensional mode, using an ECAT EXACT HR+ (Siemens/CTI) (22,23). This scanner acquires 63 planes of data over an axial field of view of 15 cm.
A 10-min transmission scan, using rotating 68Ge line sources together with sinogram windowing, was performed after a short transmission scan for patient positioning. Subsequently, 18F-FDG (370 MBq dissolved in 5 mL saline) was injected intravenously (followed by a 47-mL saline flush at a rate of 2 mL/s). A dynamic scan was performed consisting of 39 frames with variable frame length for a total duration of 60 min. Immediately after obtaining the dynamic scan, a second 10-min transmission scan was performed.
Emission data were corrected for physical decay of 18F and for dead time, scatter, and randoms. The last 3 frames of the dynamic scan were summed (i.e., 45–60 min after injection) to create a single-frame emission sinogram with high-count statistics. Reconstructions of this emission sinogram were performed using both FBP with a Hanning filter at 0.5 of the Nyquist frequency and OSEM (CTI version 7.1.1) with 2 iterations of 12 subsets. OSEM images underwent 5-mm full width at half maximum (FWHM) gaussian postsmoothing to obtain a transaxial spatial resolution of 7-mm FWHM, equal to that of FBP images (18). Attenuation correction was applied using 4 different transmission scans: (a) Pre-Tx, (b) Post-Tx, (c) Post-Tx corrected for emission contamination using TIS, and (d) Post-Tx corrected for emission contamination using DP.
In this way, 8 different images (FBP-Pre, FBP-Post, FBP-PostTIS, FBP-PostDP, OSEM-Pre, OSEM-Post, OSEM-PostTIS, OSEM-PostDP) were generated from the single-frame emission sinogram for each patient.
Correction Methods for Post-Tx
TIS implies the use of theoretic μ-values for segmented anatomic regions (12). The μ-values used in the present study were 0.028, 0.095, and 0.107 cm−1 for lung, soft tissue, and bone, respectively. Combination with the original (measured) μ-values was performed in a weighted fashion. Weighting factors were 0.4 (lung), 0.85 (soft tissue), and 0.7 (bone).
Another correction method, based on a DP, has been described elsewhere (11). In short, this method describes the spillover fraction of emission counts into the transmission scan per line of response. The transmission scan can be corrected for emission contamination using Corrected Post-Tx = Post-Tx − Ex × DP × CF, where Ex = emission scan, DP = dwell profile, and CF = overall correction factor, which includes corrections for decay, frame length, and differences in normalization between emission and transmission data.
Data Analysis
Data were transferred to a SUN workstation (SUN Microsystems, Inc.) and were analyzed using Siemens/CTI software. Transaxial images of the left ventricle were reoriented according to the anatomic axis of the heart and subsequently displayed as short-axis slices. For each study, reslicing was first performed with FBP-Pre. The same reslicing parameters were automatically applied to the remaining 7 transaxial images. Regions of interest (ROIs) were defined manually on each slice of the FBP-Pre short-axis image and copied to the remaining 7 short-axis images, to ensure equal ROI definition on each reconstruction. At the basal and distal levels of the left ventricle, these ROIs divided each short-axis slice into 6 regions. At the apex, 1 ROI was defined on each short-axis slice. Corresponding ROIs from a variable number of slices were grouped in each patient to compose 13 volumes of interest, representing 13 myocardial segments (6 basal, 6 distal, and 1 apex). For each segment, the mean 18F-FDG activity was calculated.
All images were compared with FBP-Pre by calculating ratios of 18F-FDG activity between the corresponding segments in each patient. Furthermore, for each image, every segment was normalized to the segment with the highest mean activity. Normalized data of all images were compared with those of FBP-Pre.
For qualitative analysis, all images were graded, according to the 13-segment model described above, by 2 experienced observers on a 4-point scale from 1 to 4: 1 = normal tracer uptake (>75%), 2 = mildly reduced tracer uptake (50%−75%), 3 = moderately reduced tracer uptake (25%–50%), and 4 = severely reduced or absent tracer uptake (<25%). Differences were resolved by consensus. The consensus gradings of FBP-Pre were repeated afterward to assess reproducibility. Both interobserver agreement and consensus gradings were compared between the 8 different reconstruction methods.
Statistical Analysis
All data are expressed as mean ± SD. Statistical analyses were performed using the 2-tailed paired t test and least-squares regression analysis. Interobserver agreement and agreement between individual reconstruction methods were assessed using κ-statistics.
For the normalized 18F-FDG uptake, the limits of agreement were assessed by means of the analysis described by Bland and Altman (24). P < 0.05 was considered statistically significant.
RESULTS
Sixteen patients (11 male, 5 female) with a mean age of 63 ± 12 y were studied. Four had a history of diabetes mellitus. For each patient, 8 different images were reconstructed, resulting in a total of 128 myocardial images. Each image was divided into 13 myocardial segments. Consequently, a total of 1,664 segments were analyzed
Quantitative Analysis
18F-FDG activity in the myocardial segments of FBP-Pre was 38.9 ± 17.4 kBq/mL and ranged from 6.9 to 83.8 kBq/mL. The good correlation between FBP-Pre and FBP-Post, both with and without correction for emission contamination, is shown in Figures 1A–1C. FBP-Pre and OSEM-Pre had an extremely good correlation (Fig. 1D).

Scatter plots of the correlation between FBP-Pre and FBP-Post (A), FBP-Pre and FBP-PostTIS (B), FBP-Pre and FBP-PostDP (C), and FBP-Pre and OSEM-Pre (D). R2 = 0.94, 0.94, 0.98, and 0.99, respectively. The solid line in the figures represents the line of unity.
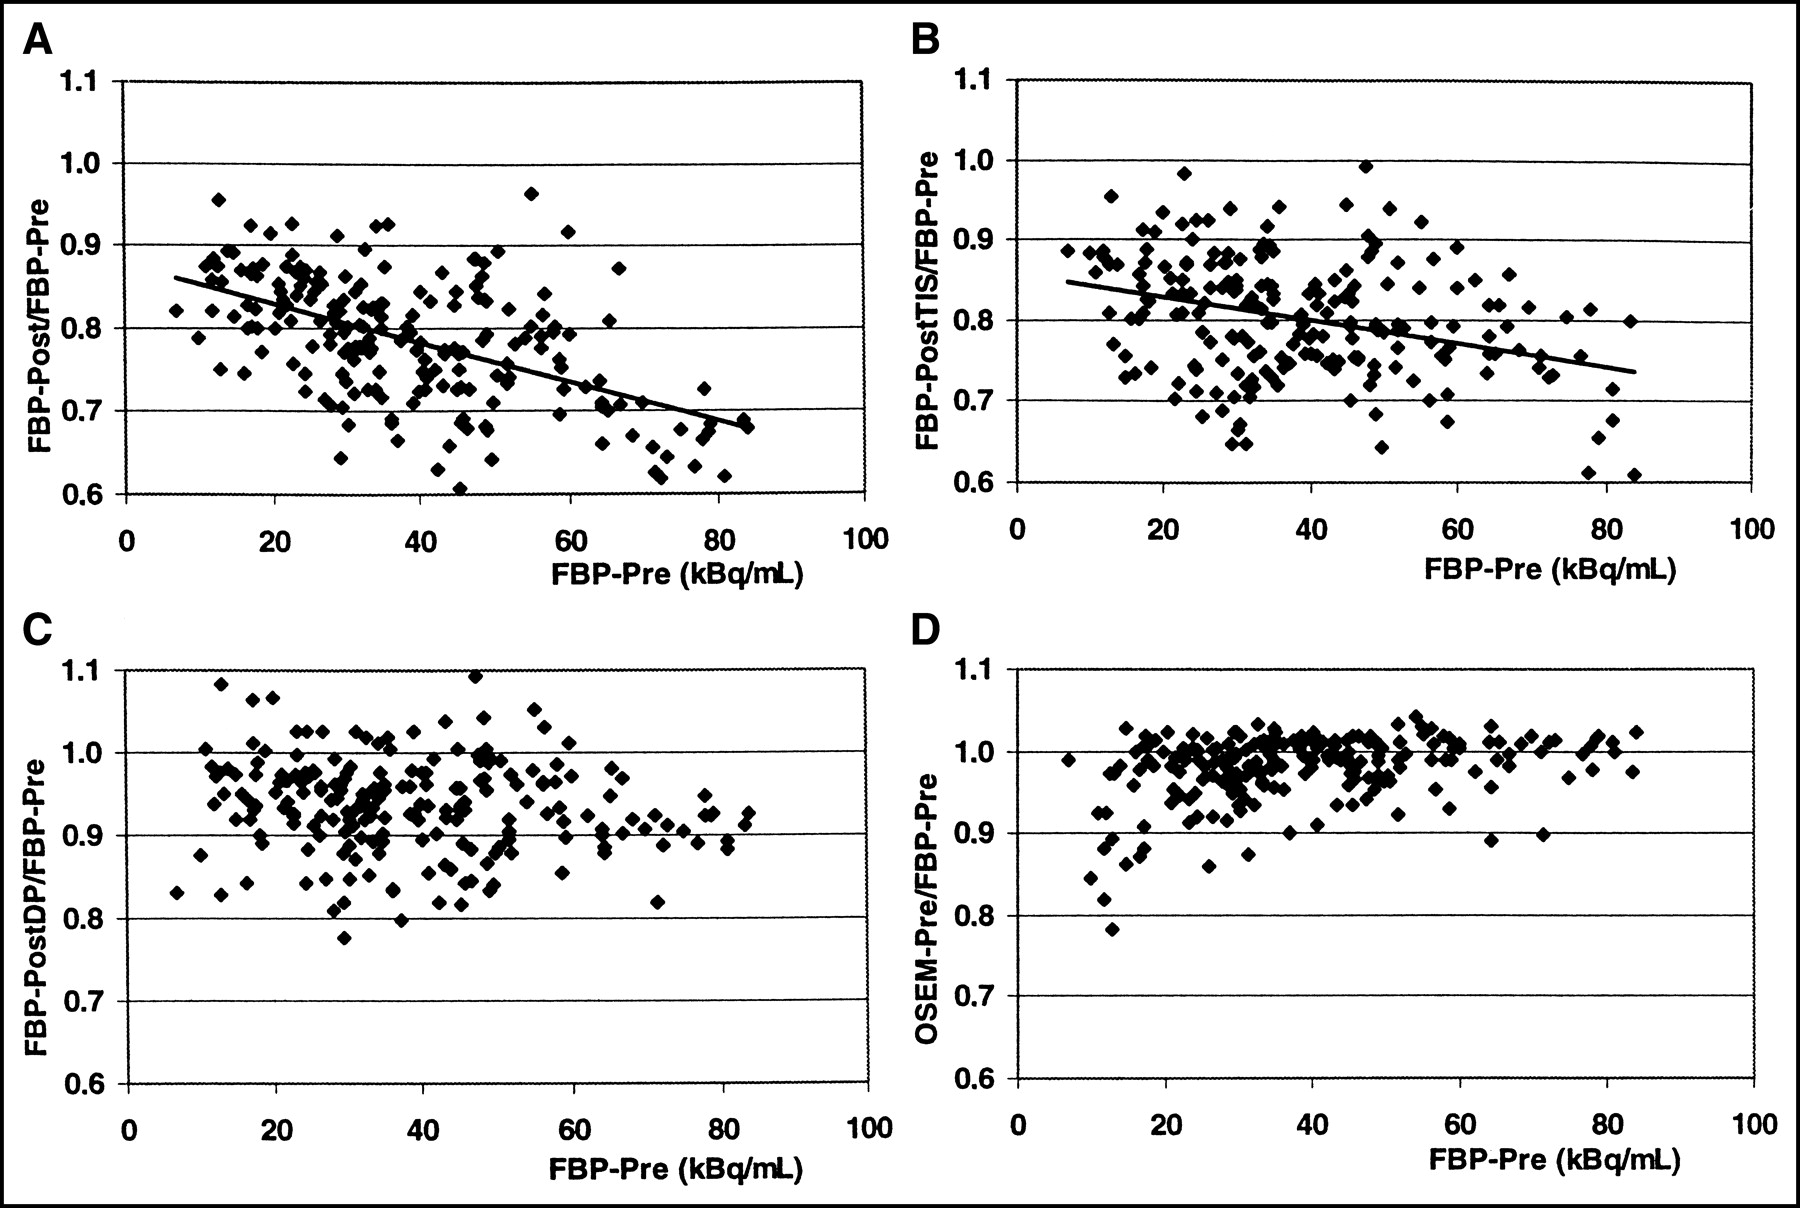
The mean ratio of segmental 18F-FDG activity of FBP-Post/FBP-Pre was 0.78 ± 0.08 (Table 1). Figure 2A shows this ratio as a function of the level of activity in FBP-Pre(r2 = 0.29, P < 0.001). When TIS was used for correction of emission contamination, the mean ratio of FBP-PostTIS/FBP-Pre was 0.80 ± 0.07. Correlation with the level of activity in FBP-Pre was considerable weaker (r2 = 0.11, P < 0.001; Fig. 2B). The mean ratio was 0.94 ± 0.06 when DP was used and no correlation with the level of activity in FBP-Pre was found (Fig. 2C).

Mean ratio of 18F-FDG activity between corresponding segments from FBP-Post (A), FBP-PostTIS (B), FBP-PostDP (C), and OSEM-Pre (D) and those of FBP-Pre.
Mean Ratio of 18F-FDG Activity
Comparable results were observed with iterative reconstruction, when OSEM-Pre was used as reference (Table 1). These ratios could also be correlated with the level of activity in OSEM-Pre (OSEM-Post: r2 = 0.33, P < 0.001; OSEM-PostTIS: r2 = 0.10, P < 0.001; OSEM-PostDP: P = not significant [NS]).
The use of OSEM resulted in, on average, 2% lower values for 18F-FDG activity as compared with FBP (Table 1). No correlation with the level of activity in FBP-Pre was found (Fig. 2D).
When segmental 18F-FDG activity was expressed as a percentage of the highest activity, the mean normalized 18F-FDG uptake was 75% ± 21% and was almost equal between all reconstruction methods. For the 30 segments with normalized 18F-FDG activity of <50%, the mean value in FBP-Pre was 35% ± 8%. The corresponding segments, however, in both FBP-Post and FBP-PostTIS demonstrated a higher mean value (Table 2). In FBP-PostDP, no statistical significant difference was observed. In OSEM-Pre, the mean value was slightly lower.
Mean Normalized 18F-FDG Activity
For the 48 segments with normalized 18F-FDG activity between 50% and 75%, FBP-Pre resulted in a mean value of 63% ± 7%. Again, corresponding segments in both FBP-Post and FBP-PostTIS yielded higher values (Table 2). The mean normalized 18F-FDG activity in segments from FBP-PostDP did not differ significantly. In OSEM-Pre, the mean value was again slightly lower.
For the 130 segments with normalized 18F-FDG activity > 75%, the mean value was 89% ± 8% with no significant differences between all reconstruction methods (Table 2).
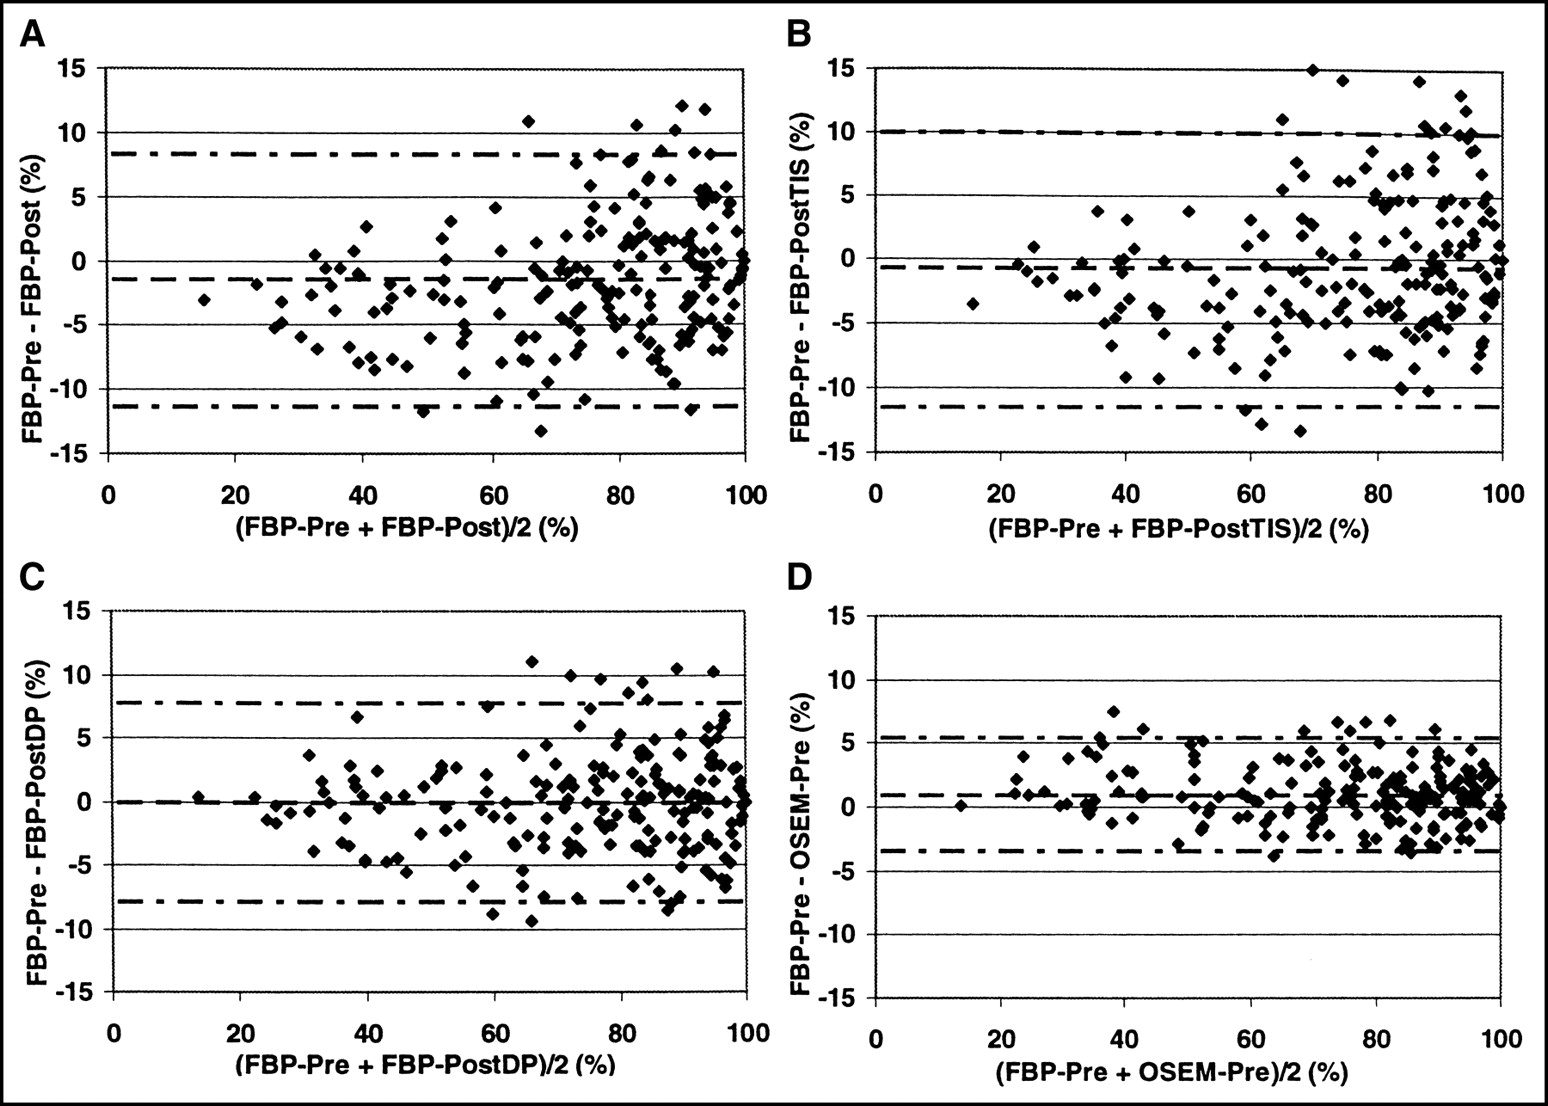
Limits of agreement of the normalized segmental 18F-FDG activity in FBP-Pre and the other images are shown in Figure 3. Using Post-Tx for attenuation correction (Figs. 3A–3C), the highest agreement with FBP-Pre is achieved by FBP-PostDP (Fig. 3C). Almost identical results were observed with the iterative reconstructed images and OSEM-Pre as reference (data not shown).

Limits of agreement for normalized segmental 18F-FDG uptake in FBP-Pre and FBP-Post (A), FBP-PostTIS (B), FBP-PostDP (C), and OSEM-Pre (D). Horizontal lines represent the mean difference and mean ± 2 SD. (A) Mean = −1%; 2 SD = 10%. (B) Mean = −1%; 2 SD = 11%. (C) Mean = 0%; 2 SD = 8%. (D) Mean = 1%; 2 SD = 4%.
Qualitative Analysis
Thirteen hundred fifteen of 1,664 segments (79%) were scored similar by both observers (κ = 0.69). Interobserver agreement was comparable between the images from the 8 reconstruction methods and ranged from 77% to 82% (P = NS compared with FBP-Pre). Reproducibility of the consensus grading of FBP-Pre was 88% (κ = 0.83).
Of the 208 segments in FBP-Pre (16 patients × 13 segments), by consensus, 80, 73, 41, and 14 segments were graded 1, 2, 3, and 4, respectively. From these consensus gradings, it appeared that most reconstruction methods resulted in a comparable agreement with FBP-Pre as the reproducibility of FBP-Pre itself (Table 3). Only for OSEM-PostTIS was agreement lower.
Agreement Compared with FBP-Pre
Almost identical results were obtained when OSEM-Post, OSEM-PostTIS, and OSEM-PostDP were compared using OSEM-Pre as reference (agreement: 86%, 82%, and 86%, respectively).
DISCUSSION
Although an attractive and frequently practiced procedure, there is only limited information about the qualitative and quantitative accuracy of 18F-FDG PET with Post-Tx in clinical studies (10). With Post-Tx, the transmission scan is performed after the tracer is administered and, in cardiac studies, when 18F-FDG has already accumulated in the myocardium. Especially during glucose loading—or even more pronounced, euglycemic hyperinsulinemic clamping—18F-FDG reaches high activity levels in the myocardium. Post-Tx may, therefore, be accompanied by substantial emission contamination.
In this study, it was demonstrated that the emission contamination in PostTx resulted in approximately 20% lower values of estimated 18F-FDG activity in the emission image, and this underestimation could be correlated with the local concentration. Although TIS is appealing with respect to a shorter acquisition time together with noise reduction in the transmission image, correction for emission contamination with TIS appeared to be quantitatively inadequate. Xu et al. (12) reported accurate measurements using TIS as long as the activity concentration was <13 kBq/mL. In the present study, however, the mean 18F-FDG activity in the myocardial segments was almost 40 kBq/mL. Knuuti et al. (25) reported comparable values for segmental 18F-FDG activity concentration during hyperinsulinemic clamping. Although a glucose loading procedure will result in about 20% lower 18F-FDG activity concentration as compared with hyperinsulinemic clamping (25), it may still be too high to allow for accurate correction of emission contamination with TIS.
When data from the last emission frame were used to correct for emission contamination in PostTx, values of 18F-FDG activity were, on average, 6% lower than PreTx, representing a small undercorrection. This undercorrection might be caused by (a) a small underestimation of the dwell profile values, (b) small inaccuracies within the normalization for inhomogeneous (patient) activity distributions, or (c) redistribution of activity during the time interval between emission and transmission acquisition. Although emission subtraction increases statistical noise, this method did not result in a higher variation in the results compared with images without such correction.
Since it is common practice in cardiac studies to use data of 18F-FDG uptake normalized to the segment with highest tracer uptake, the effect of these quantitative differences was also evaluated using a normalized dataset. FBP-Post appeared to overestimate 18F-FDG uptake especially in segments with low 18F-FDG activity. For example, segments with normalized 18F-FDG activity of <50% were, on average, 4% overestimated (a relative overestimation of 11%). In contrast, no significant differences were observed between all reconstruction methods in segments with normalized 18F-FDG activity of >75%. Overestimation of 18F-FDG activity in segments with normalized activity up to 75% was also observed in FBP-PostTIS. In contrast, with FBP-PostDP, no difference was observed compared with FBP-Pre. Correction for emission contamination, thus, results in more accurate data only when DP is used. The observed differences in 18F-FDG activity in the normalized dataset, however, are rather small and are unlikely to influence clinical decision making. Nevertheless, as data for a DP correction will always be available, it seems good practice to perform such a correction on a routine basis.
All images were of good quality, and qualitative analysis of the images showed no difference in interobserver agreement between reconstruction methods. In general, the agreement between the reconstruction methods was comparable with reproducibility of FBP-Pre itself.
Iterative reconstruction has proven to be a robust alternative to FBP in static 18F-FDG imaging of the heart. Both quantitative and qualitative data closely resembled the corresponding FBP data. Although images looked smoother than with FBP, a real advantage of iterative reconstruction was not observed in this patient population undergoing hyperinsulinemic euglycemic clamping, where FBP also resulted in high-quality images
Patient movement is a potential confounder in this study comparing Pre-Tx and Post-Tx for attenuation correction, as the preinjection transmission scan would not be the gold standard in this situation. Patient movement, however, was minimized by using arm supports and strips around the body of the patient. Furthermore, pre- and postinjection transmission scans were compared to assess the magnitude of patient movement in each study. Using this analysis, for the present series of patients, these movements were considered to be small. Finally, with large myocardial ROIs, the effects of movement will be less.
CONCLUSION
Post-Tx for attenuation correction in cardiac 18F-FDG PET scans results in substantial underestimation of 18F-FDG activity. The small effects in normalized datasets will probably have only minor consequences in clinical decision making. More accurate results, however, are obtained with correction for emission contamination using DP, and there is no reason not to implement this method on a routine basis. No differences are observed in qualitative interpretation of 18F-FDG images. Finally, iterative reconstruction can be used as an alternative to FBP in static 18F-FDG imaging of the heart.
Footnotes
Received Apr. 28, 2003; revision accepted Oct. 23, 2003.
For correspondence contact: Arno P. van der Weerdt, MD, Department of Cardiology, Room 6N120, VU University Medical Center, De Boelelaan 1117, 1081 HV Amsterdam, The Netherlands.
E-mail: a.vdweerdt{at}vumc.nl


