


Abstract
The standardized uptake value (SUV) is the most commonly used parameter to quantify the intensity of radiotracer uptake in tumors. Previous studies suggested that measurements of 18F-FDG accumulation in tissue might be affected by the image reconstruction method, but the clinical relevance of these findings has not been assessed. Methods: Phantom studies were performed and clinical whole-body 18F-FDG PET images of 85 cancer patients were analyzed. All images were reconstructed using either filtered backprojection (FBP) with measured attenuation correction (MAC) or iterative reconstruction (IR) with segmented attenuation correction (SAC). In a subset of 15 patients, images were reconstructed using all 4 combinations of IR+SAC, IR+MAC, FBP+SAC, and FBP+MAC. For phantom studies, a sphere containing 18F-FDG was placed in a water-filled cylinder and the activity concentration of that sphere was measured in FBP and IR reconstructed images using all 4 combinations. Clinical studies were displayed simultaneously and identical regions of interest (ROIs, 50 pixels) were placed in liver, urinary bladder, and tumor tissue in both image sets. SUV max (maximal counts per pixel in ROI) and SUV avg (average counts per pixel) were measured. Results: In phantom studies, measurements from FBP images underestimated the true activity concentration to a greater degree than those from IR images (20% vs. 5% underestimation). In patient studies, SUV derived from FBP images were consistently lower than those from IR images in both normal and tumor tissue: Tumor SUV max with IR+SAC was 9.6 ± 4.5, with IR+MAC it was 7.7 ± 3.5, with FBP+MAC it was 6.9 ± 3.0, and with FBP+SAC it was 8.6 ± 4.1 (all P < 0.01 vs. IR+SAC). Compared with IR+SAC, SUV from FBP+MAC images were 25%–30% lower. Similar discrepancies were noted for liver and bladder. Discrepancies between measurements became more apparent with increasing 18F-FDG concentration in tissue. Conclusion: SUV measurements in whole-body PET studies are affected by the applied methods for both image reconstruction and attenuation correction. This should be considered when serial PET studies are done in cancer patients. Moreover, if SUV is used for tissue characterization, different cutoff values should be applied, depending on the chosen method for image reconstruction and attenuation correction.
Whole-body PET imaging with 18F-FDG is increasingly used for the staging and evaluation of response to therapy in patients with cancer (1,2). High image quality is an unconditional prerequisite for accurate and unequivocal interpretation of whole-body PET studies. PET images can be reconstructed using filtered backprojection (FBP) or iterative image reconstruction (IR) algorithms. The IR algorithm, which is now used increasingly, reduces image artifacts and improves image quality without sacrificing image resolution (3–5). Because of the improved quality of IR emission images, less smoothing of the transmission dataset is required. At least theoretically, this should also permit more accurate quantification of tissue activity concentrations in clinical studies.
The standardized uptake value (SUV) is a commonly used parameter in clinical practice to assess semiquantitatively the intensity of 18F-FDG uptake in tumors (6–8). However, Ramos et al. (9) suggested that SUVs derived from FBP images underestimate the true activity concentration in tissues. In normal tissues, SUVs for various organs were on average 20% lower when measured on FBP images as compared with IR images. Boellaard et al. (10) reported similar findings in 3 patients with lung cancer. They found quantitative measurements of glucose uptake to be 5%–40% higher when derived from iterative reconstructed images as compared with FBP images. Similarly, Visvikis et al. (11) reported differences of 5%–20% between SUVs derived from IR images compared with those from FBP images. However, none of these previous studies performed a systematic comparison of SUV measurements between IR and FBP reconstructed images and, to our knowledge, no study has focused on the potential clinical implications of this phenomenon. For instance, changes in SUV over time are frequently used to evaluate the response to therapy in cancer patients (7,12). In addition, an SUV of 2.5 is commonly used to differentiate between 18F-FDG uptake in benign versus potentially malignant lesions (13,14). However, this number is (almost) exclusively based on FBP reconstructed PET studies, whereas IR is now being used increasingly in many institutions. The aim of this study was, therefore, to evaluate the accuracy of SUV measurements from FBP and IR images in phantom studies and to assess the magnitude and potential clinical implications of differences in SUV measurements between FBP images and IR images in cancer patients.
MATERIALS AND METHODS
Phantom Study
A phantom study was performed to assess the differences in activity quantitation between the 2 reconstruction algorithms, which were also used for clinical studies, under optimal conditions. A cylindric lucite Jaszczak phantom with 20-cm diameter and length was filled with water and an 11.8-mL sphere was placed within the phantom. The size of the sphere was chosen to eliminate any partial-volume effects (15). The sphere was filled with an activity of 0.28 MBq (7.5 μCi) 18F-FDG per milliliter. During the activity decay, the phantom was imaged at every half-life time for 5 half-lives. The cold water background was used as a scatter medium.
Patient Studies
We analyzed (data analysis approved by the Institutional Review Board) whole-body 18F-FDG PET studies of 85 consecutive cancer patients (51 males, 34 females), with a mean age of 60 ± 17 y (range, 14–83 y). Imaging was done for primary staging or treatment evaluation. Malignancies included lymphoma, melanoma, lung cancer, colorectal cancer, esophageal cancer, breast cancer, head and neck cancer, mesothelioma, and neuroblastoma. Patients were injected intravenously with 370–555 MBq (10–15 mCi) 18F-FDG, depending on body weight and habitus, and images were acquired 45–60 min after infusion. Before tracer injection, patients fasted for at least 6 h, although liberal water intake was encouraged.
PET
All studies were performed in 2-dimensional (2D) mode using an Advance whole-body tomograph (General Electric Medical Systems). This tomograph has a transaxial field of view of 15.2 cm and an axial field of view of 55 cm. The spatial resolution is 4.3 mm (full width at half maximum [FWHM]) at the center of the field of view, deteriorating to 7.5 mm at 20 cm off axis. Emission images were acquired first for 4–5 min per bed position, followed by transmission images for 3 min per bed position, using 68Ge rod sources.
Image Reconstruction
Comparison of Standard Clinical Image Sets.
In a first step, we compared image sets that were reconstructed using our standard clinical parameters, which were chosen previously because they provide images of good diagnostic quality.
For FBP image reconstruction, the FBP+MAC algorithm (filtered backprojection with measured attenuation correction) was used. FBP images were reconstructed at a 128 × 128 matrix using a Hanning filter with a cutoff frequency of 2.0 cycles/cm (8.5 mm). A nonquantitative filter with 3.5 cycles/cm (15 mm) was used for smoothing of the transmission data. This filter was chosen because the 3-min transmission images are rather noisy and considerable smoothing is necessary to obtain attenuation-corrected images of optimal quality (9). With rod-based transmission scans, some pixels may register negative values, which are caused by the real-time randoms correction (i.e., by subtracting delayed channel from the prompt channel). Since these negative values do not represent valid data, they have to be replaced before applying any correction. For the nonquantitative filtering applied here, negative values were therefore replaced with the lowest possible positive number of counts (1.0 count) before smoothing. This replacing of negative values with 1.0 will bias the transmission attenuation value and will lead to an unavoidable underestimation of the activity in the reconstructed emission image.
For the IR, the IR+SAC (iterative reconstruction with segmented attenuation correction) algorithm was used as described previously (9), applying the expectation maximization (EM) algorithm as described by Shepp and Vardi (16) with ordered subsets (OS) (17). OSEM was first defined as a single pass through all subsets and iterated for the second time because the algorithm is optimal for convergence and reconstruction time for 2 iterations. OSEM parameters of 28 subsets and 2 iterations, with a loop filter of 1 cycle/cm (4.3 mm) and a postfilter of 1.4 cycles/cm (6 mm), appeared optimal in terms of image quality, as agreed on by a consensus of 4 experienced nuclear medicine physicians at our institution (9). A gaussian filter with a cutoff of 1.9 cycles/mm (8 mm) was chosen for smoothing of the transmission data. Further details of SAC used for this study were described previously (9). The final reconstructed slice thickness was 4.25 mm for both image sets.
SUV Calculation.
Coronal images reconstructed with either FBP or IR were displayed simultaneously on the monitor. For phantom images, a circular region of interest (ROI) was placed within the sphere. For each clinical study, circular ROIs were placed in the normal tissue of the right lobe of the liver, in the urinary bladder, and in tumor lesions in the chest, abdomen, or pelvis. The ROIs had a size of 50 pixels, where the pixel size is 4.3 × 4.3 mm. Hence, the ROI size is approximately 9.25 cm2 with a diameter = 3.4 cm. Liver and urinary bladder were chosen because they represent 2 extremes regarding the intensity of 18F-FDG uptake in whole-body studies: The liver normally shows homogeneous tracer uptake of low intensity, whereas the urinary bladder is usually the location of highest activity. A tumor lesion was defined as abnormal focal 18F-FDG uptake above background level and outside of normal anatomic structures. The SUV was calculated as follows:
 SUV max and SUV avg (maximal and average SUV in the ROI) were calculated for each ROI.
Additional Comparison Using MAC and SAC for Attenuation Correction.
To evaluate specifically to what degree differences in SUV are related to image reconstruction (IR vs. FBP) as compared with the differences in the processing of transmission data for the attenuation correction (SAC vs. MAC), additional analysis was performed in a subset of 15 patients with 24 tumor lesions. Images were reconstructed using the following 4 combinations: FBP+MAC, FBP+SAC, IR+SAC, and IR+MAC. In this subgroup of patients, circular ROIs (50 pixels) were again placed in tumor lesions, liver, and urinary bladder, and SUVs were calculated as described above.
Statistical Analysis.
SUV max and SUV avg for liver, urinary bladder, and tumor lesions were tabulated; all data are shown as mean ± SD. A paired t test was used to compare SUV max and SUV avg derived from FBP images versus IR images using our clinical standard parameters IR+SAC and FBP+MAC. Least-squares regression analysis was used to evaluate for correlations between SUV measurements and the correlation between SUV measurements versus true activity concentrations in the phantom study.
To further address the effect of different methods of attenuation correction (MAC vs. SAC), in a subset of 15 patients SUVs were compared for all possible pairs of IR+SAC, IR+MAC, FBP+MAC, and FBP+SAC using a paired t test, and P values were adjusted for multiplicity (18). This analysis was repeated for each organ site (tumor, bladder, and liver) as well as for SUV max and SUV avg separately. For all analyses, a P value of <0.05 was considered significant.
RESULTS
Phantom Studies
The correlation between true activity concentrations in the sphere and measured activity concentrations in FBP and IR images is shown in Figure 1. As expected, measurements of both maximum and average activity correlated closely with the true activity concentration, regardless of the reconstruction algorithm. However, measured activities from FBP images were consistently lower than those from IR images. For average activity concentrations, measurements from FBP images showed an underestimation of the true activity concentration in the sphere by approximately 18%, whereas the underestimation was only 5% for measurements from IR images.

Phantom studies. Correlation between true activity concentration in sphere and measured activity using IR or FBP. (A) Average activity concentration in ROI. (B) Maximum activity concentration. Solid line indicates the line of identity.
Patient Studies
Clinical Standard Parameters.
Using our clinical standard parameters (IR+SAC and FBP+MAC), the SUVs were calculated for liver and urinary bladder in all 85 patients and for a total of 51 tumor lesions (the remaining studies in patients who were referred for reevaluation after therapy did not reveal any areas with abnormal 18F-FDG uptake).
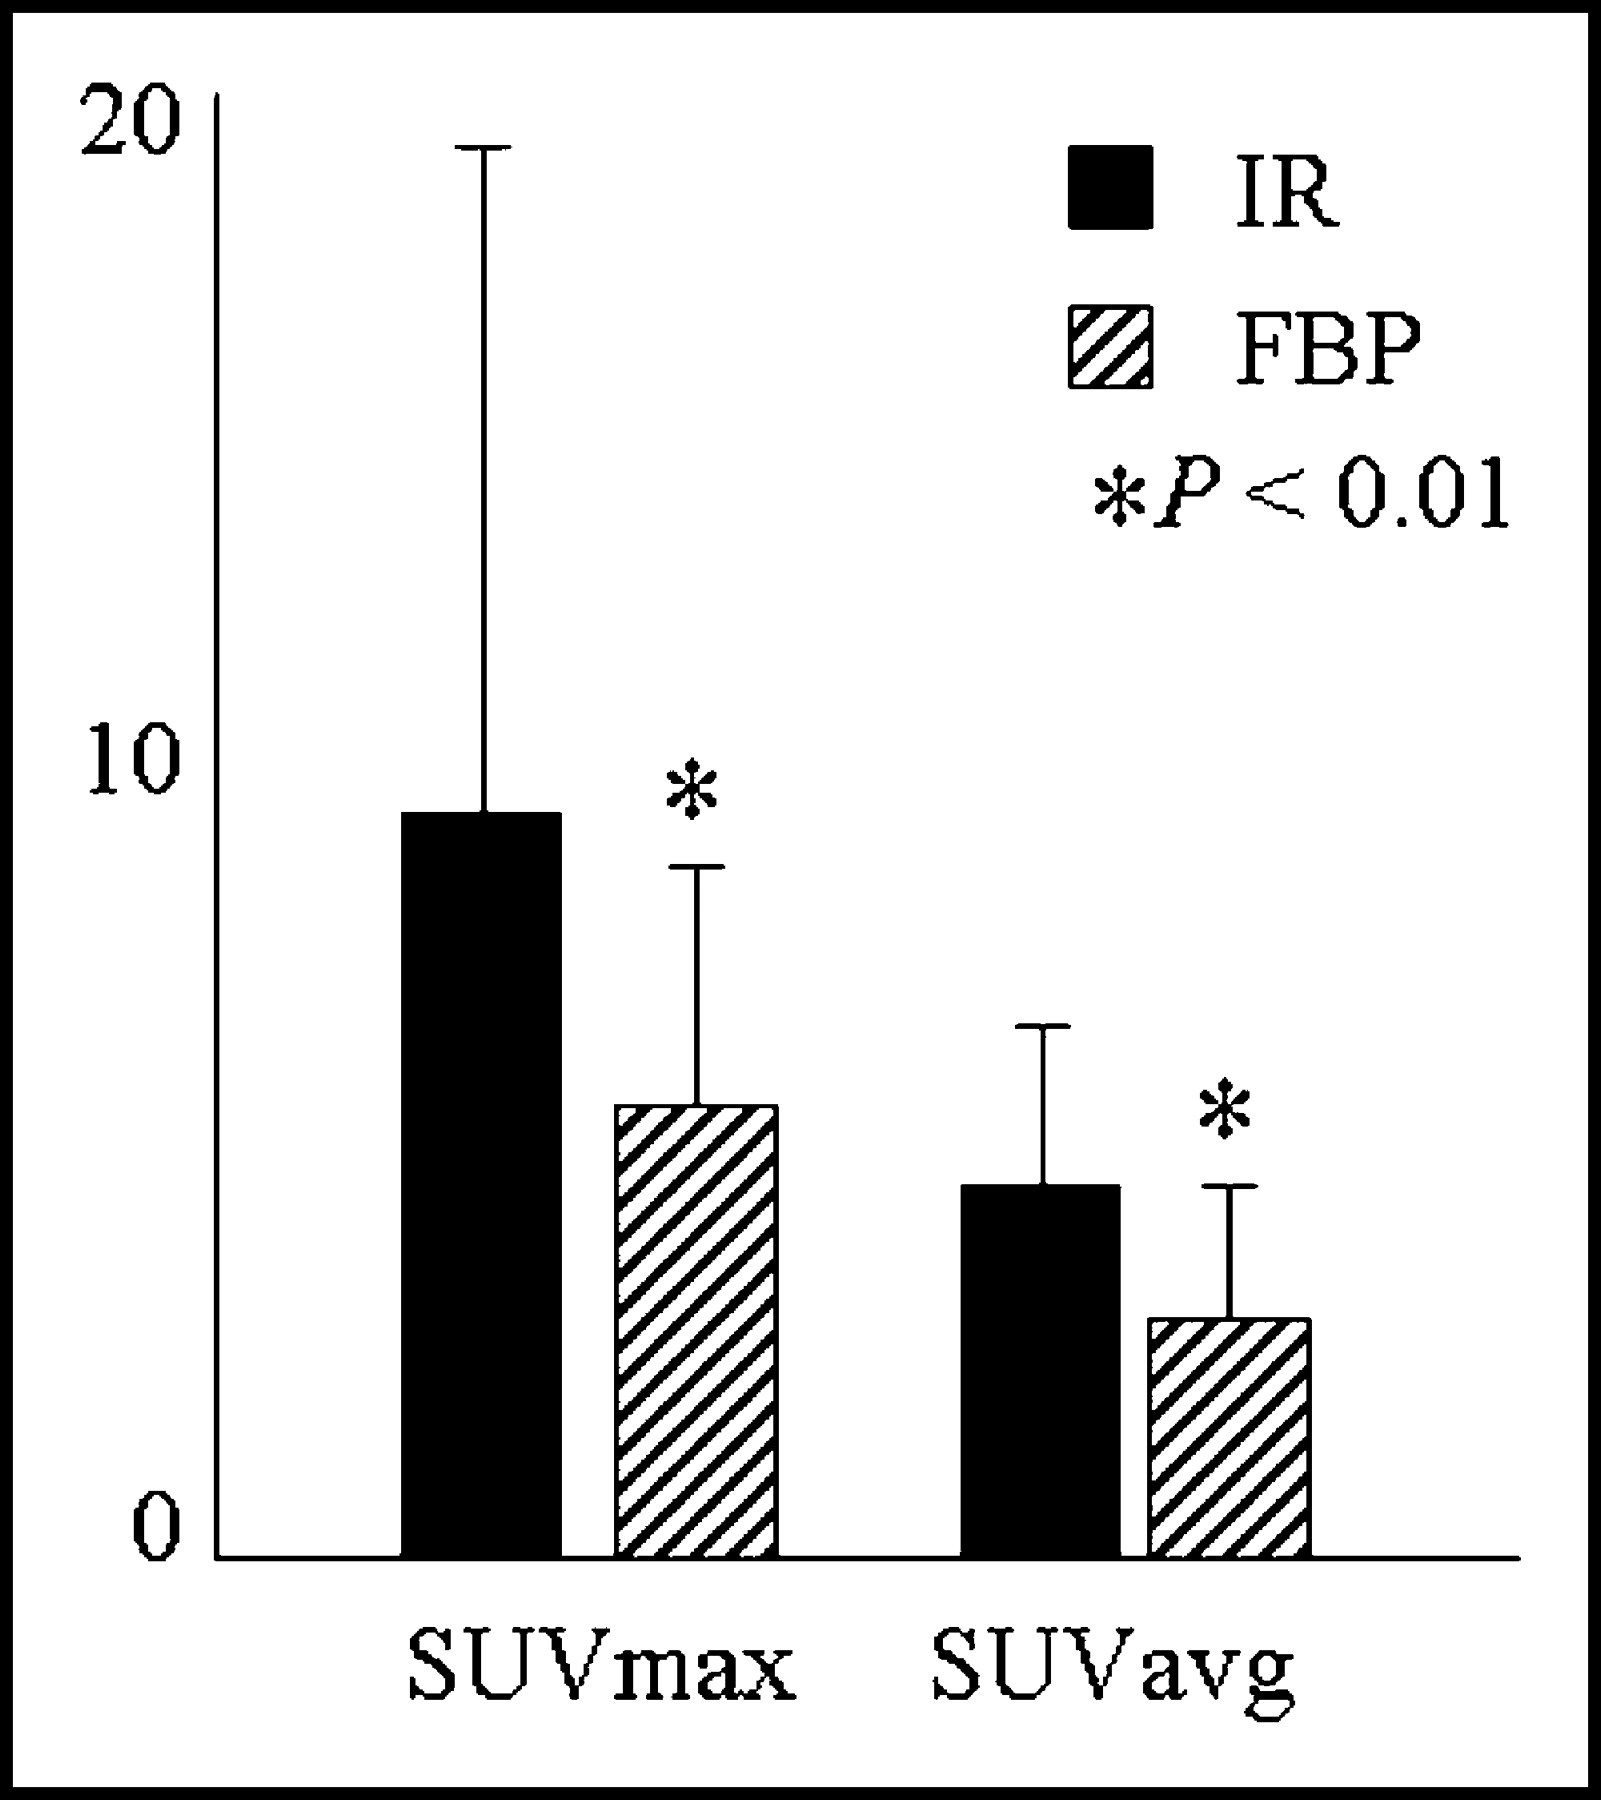
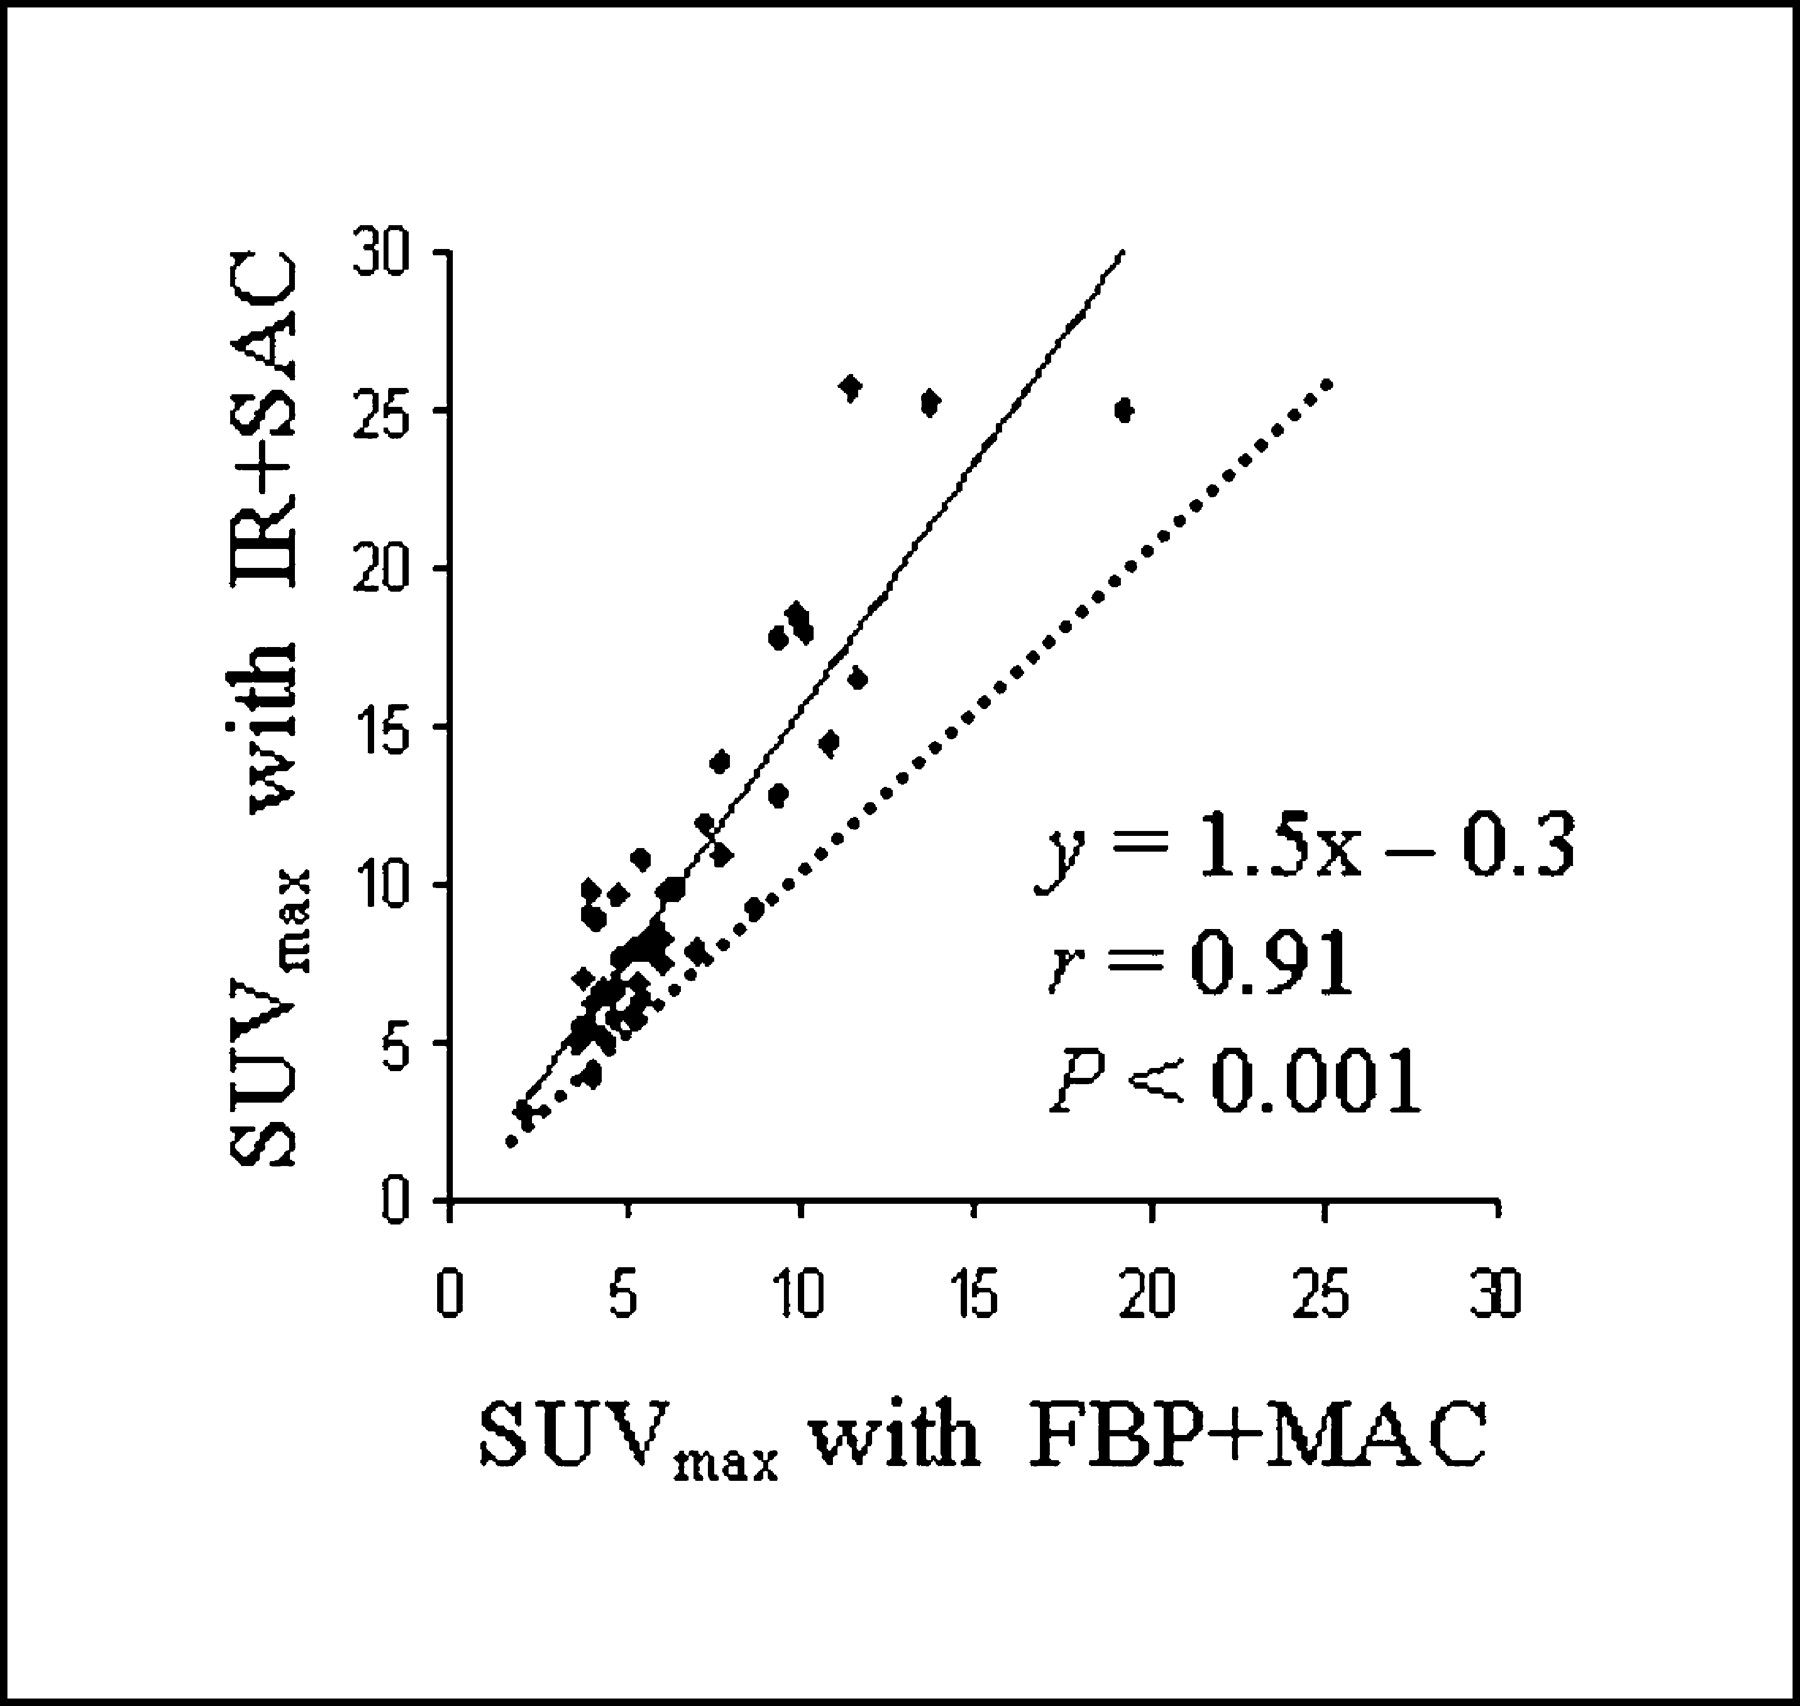
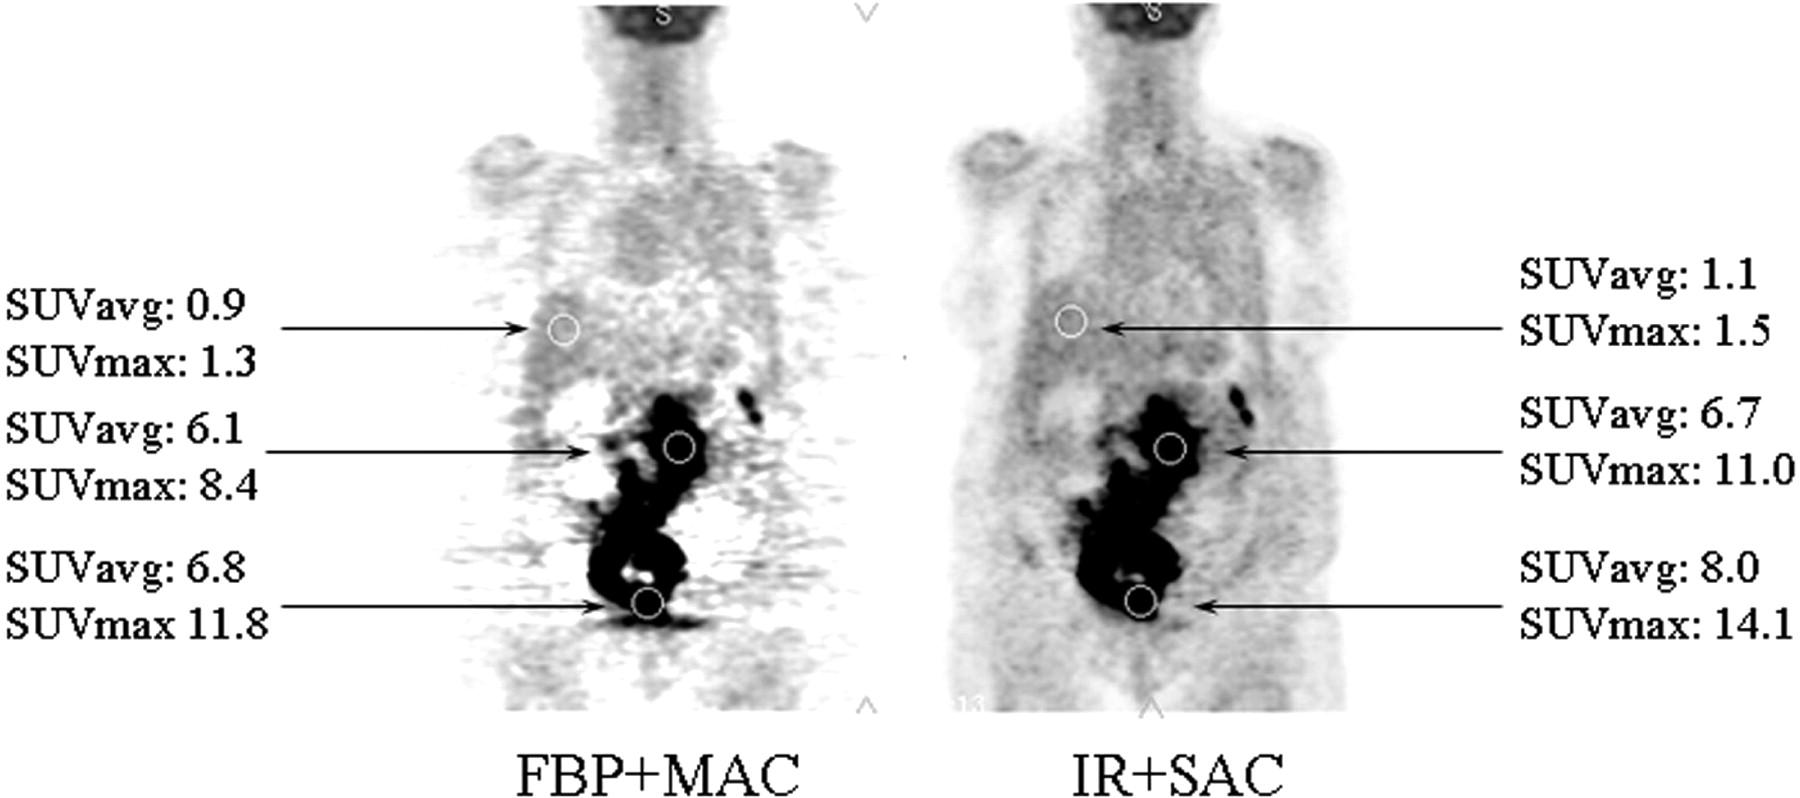
Values of SUV max and SUV avg for liver tissue, urinary bladder, and tumor lesions are shown in Figures 2 and 3. Regardless of the location, SUV derived from FBP images were significantly lower than those derived from IR images (SUV avg for liver = 1.5 ± 0.3 vs. 2.1 ± 0.4 g/mL; SUV avg for urinary bladder = 23 ± 14 vs. 35 ± 23 g/mL; SUV max for liver = 3.0 ± 0.6 vs. 3.6 ± 0.9 g/mL; SUV max for urinary bladder = 45.9 ± 43.1 vs. 67.4 ± 49.4 g/mL; all P < 0.01). A similar discrepancy was noted for tumor lesions (SUV avg = 4.4 ± 2.5 vs. 6.1 ± 3.7 g/mL and SUV max = 7.1 ± 5.3 vs. 10.7 ± 8.1 g/mL; both P < 0.01). This difference between SUV derived from FBP versus IR images was consistently observed for every single lesion in all patients. Discrepancies between measurements became more apparent with increasing activity concentration and, in some cases, were as high as 55% (Fig. 4). An example of a patient with diffuse large B-cell lymphoma in the abdomen is shown in Figure 5.
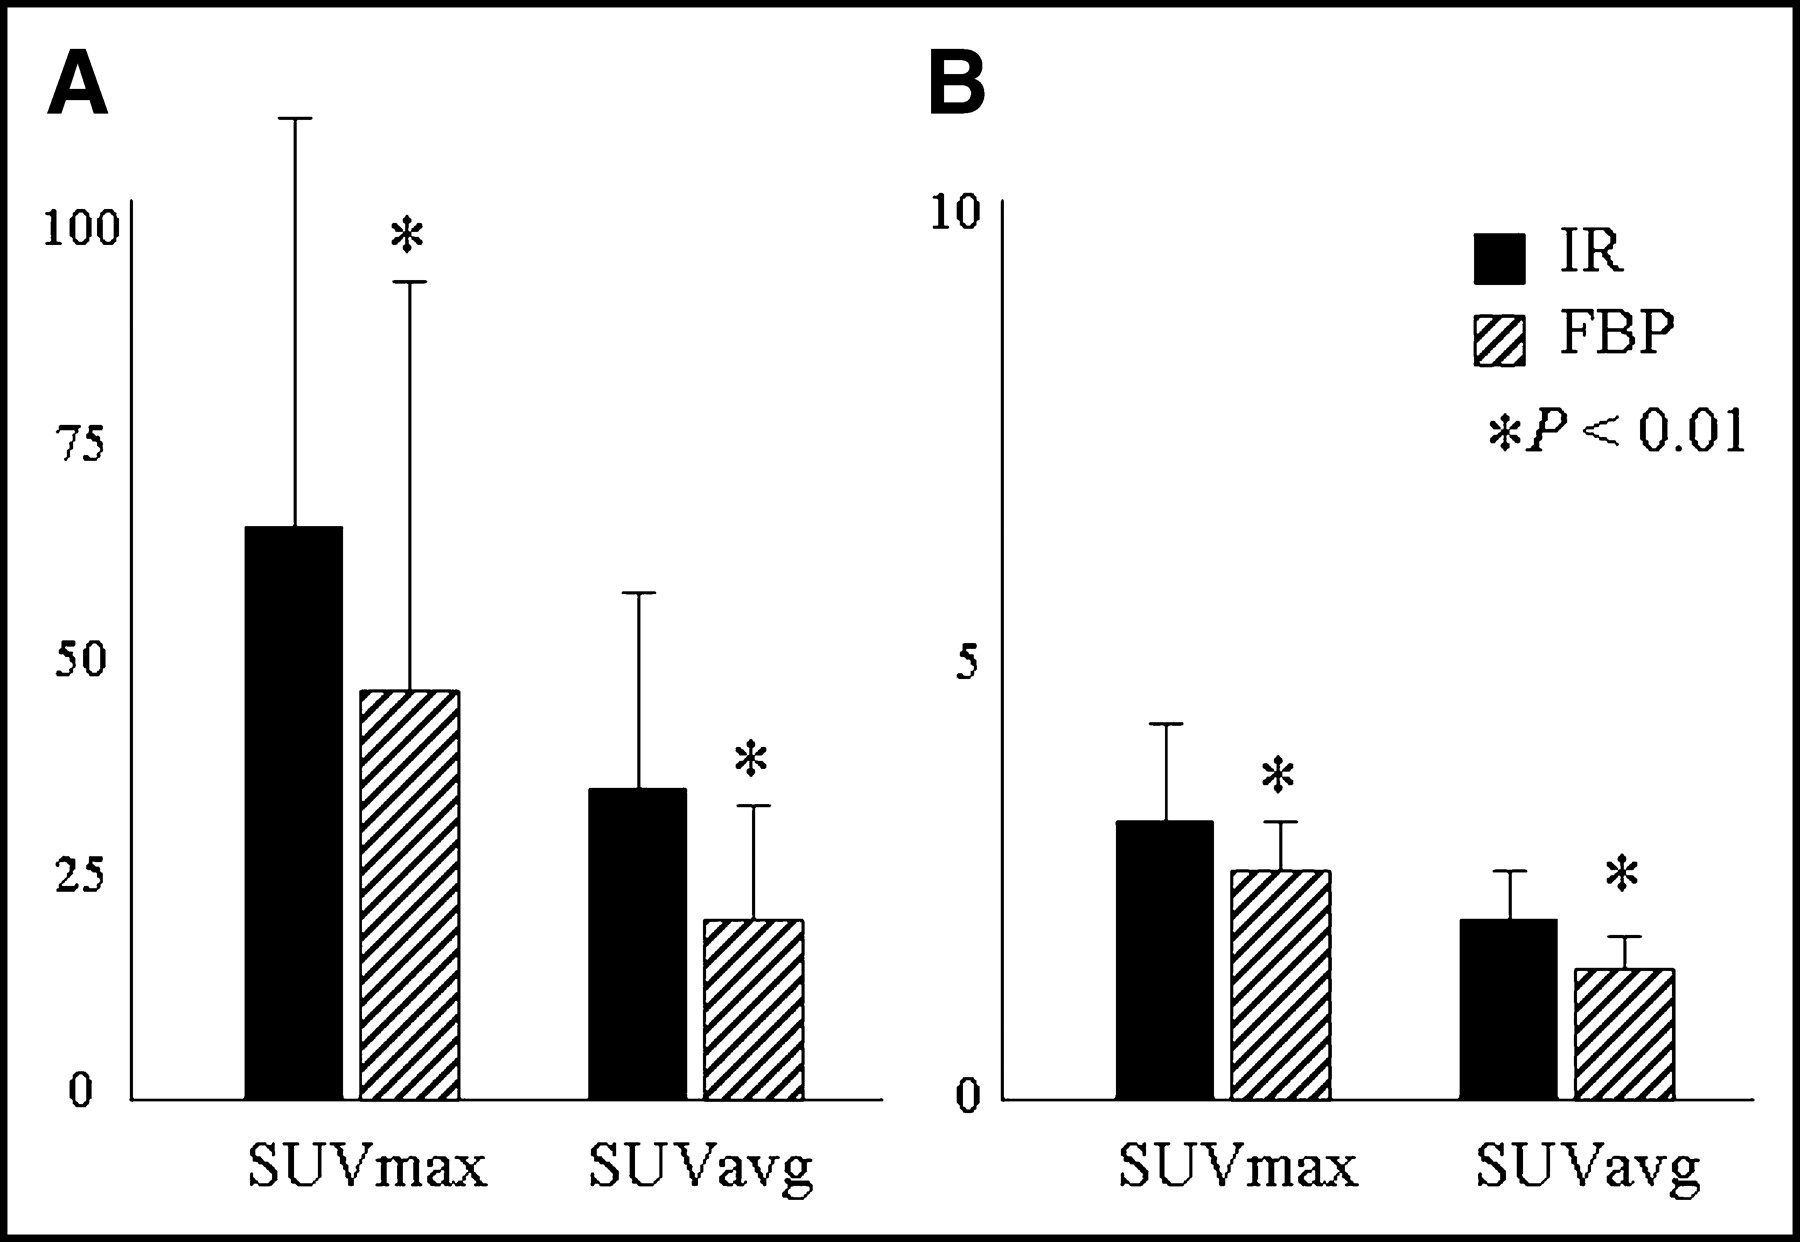
SUV measurements in urinary bladder (A) and liver (B). SUV max and SUV avg derived form FBP+MAC images were significantly lower than those from IR+SAC images.

SUV max and SUV avg for tumor lesions. Values derived from FBP+MAC images were consistently and significantly lower than those measured on IR+SAC images.

Comparison of SUV measurements from FBP+MAC images and IR+SAC images; dotted line indicates line of identity. There is systematic underestimation of activity concentrations measured on FBP images as compared with IR images.

Patient example: Coronal PET images of 65-y-old female with diffuse large B-cell lymphoma in abdomen. ROIs are placed in liver, urinary bladder, and tumor. SUV max and SUV avg are lower for all 3 locations when derived from FBP+MAC images as compared with IR+SAC images. Arrows point to ROIs in liver, tumor in abdomen, and urinary bladder.
Influence of Reconstruction Method Versus Attenuation Correction Methods on SUV.
SUVs were calculated in a subset of 15 patients with 24 tumor lesions. Results are shown in Table 1. For a given reconstruction algorithm (FBP or IR), SUVs were consistently lower when MAC was used, as compared with SAC. In comparison with SUV derived from IR+SAC images, values were lower by 9% ± 12% with IR+MAC, by 25% ± 12% with FBP+MAC, and by 10% ± 10% with FBP+SAC (all P < 0.01). In addition, however, even with the same method of attenuation correction (MAC or SAC), SUVs from FBP images were significantly lower than those from IR images. SUVs measured with IR+SAC in these 24 tumor lesions ranged from 5.0 to 20.8. Compared with IR+SAC, the algorithm of FBP+SAC underestimated the SUV by 10% ± 10% (range of underestimation, 0%–22%). SUVs measured with IR+MAC ranged from 3.0 to 17.2. Compared with IR+MAC, the algorithm of FBP+MAC underestimated the SUV by 8% ± 12% (range of underestimation, 0%–24%); P < 0.01 for all. Similar discrepancies were also noted for SUVs measured in urinary bladder and liver, although differences for the bladder (location of highest activity) were generally greater than those for the liver (location of low and homogeneous 18F-FDG activity).
Influence of Image Reconstruction and Attenuation Correction Methods on SUV
DISCUSSION
The SUV is the most commonly used parameter to quantify the intensity of abnormal 18F-FDG uptake in tumor lesions in clinical practice. In this study we have shown that differences in SUV measurements can be related to both the chosen image reconstruction algorithm (FBP vs. IR) and the processing of the transmission data for the attenuation correction (MAC vs. SAC). Discrepancies between SUV were observed consistently in every single patient, were independent of the anatomic location within the body, and became more apparent with higher activity concentrations. Using our standard clinical parameters (FBP+MAC and IR+SAC), an approximately 30% difference was observed for SUV measurements from the same lesion.
Methodologic Considerations
For this study, we have used the same clinical imaging parameters that we have been using for the past 8 y. Therefore, our findings truly reflect daily clinical practice. These parameters generate images of acceptable diagnostic quality in most cases. It is conceivable that reconstruction parameters would have to be altered for certain patient groups (e.g., small children or obese patients) to improve image quality. However, any such alteration of reconstruction parameters would introduce additional uncertainty; since we frequently use the SUV for treatment evaluation and for all patients enrolled in clinical research protocols, we prefer a standardized approach to PET imaging.
Reconstruction Method
In addition to method-inherent differences in reconstruction algorithms for the emission image, differences in activity quantification between FBP and IR might be affected by the filter selection. The reconstruction filter is the single most important factor determining the final image resolution. However, this is a variable effect that can be changed by selecting a filter with a smaller FWHM. In comparison, the combined effect of energy of the positron and noncolinearity on the resolution of a clinical (gantry opening, 60–70 cm) PET scanner is about 1.8 mm. The effect of scatter is about 1.5 mm. So, if we combine the effect of positron energy, noncolinearity, and scatter, the cumulative effect for the resolution is 3–3.5 mm, which is a major effect for the overall system resolution. In any event, this use of different filters for FBP and IR reconstructions was based on the attempt to produce images of good diagnostic quality, but this may have led to differences in image resolution (smoother images have a lower spatial resolution) and may have contributed to the observed differences in SUV measurements.
With IR, SUV measurements are sensitive to changes in the number of iterations and subsets. Our parameters of 28 subsets and 2 iterations were based on extensive phantom studies to determine the most suitable default parameters for OSEM reconstructions to generate PET images of superior diagnostic quality (19).
Attenuation Correction
In this study, the change of the method for reconstructing the emission image (FBP vs. IR) caused smaller changes in measured activity concentration than changing the method of attenuation correction (MAC vs. SAC) while keeping the reconstruction of the emission image identical (Table 1). The following provides some explanation for discrepancies in SUV measurements that are related to the preferred method for attenuation correction. Transmission data need to be smoothed before they can be applied for the attenuation correction of PET emission images. When attenuation-corrected FBP images are generated, we routinely use a nonquantitative filter for the smoothing of transmission data to reduce image noise that could interfere with the study interpretation. Nonquantitative filtering consists of putting 1 count into transmission sinogram elements with zero or negative counts. This is very effective in reducing streaks in the image that are induced by transmission noise. However, each of these replacements contributes to an underestimation of transmission attenuation by the patient’s body. With an increasing number of such corrections or replacements, measurements of true activity concentration on the attenuation-corrected emission image may be overestimated. The gaussian smoothing of transmission data eliminates this “replace with ones” step for the negative values in the transmission scan. Therefore, the bias for underestimation in the transmission data is reduced but, at the same time, the probability for streaks in the attenuation-corrected emission image increases. In contrast, when SAC is applied as part of IR (i.e., IR+SAC algorithm), a nonquantitative filter cannot be used because SAC processing is based on creating histograms and organizing pixel values into 3 compartments: soft tissue, lung, and bone. If a nonquantitative filter were to be applied, as for the FBP images, negative values would have to be replaced with 1.0 count. In the case of IR, such deliberate alteration of counts per pixel may cause misclassification of certain pixels as belonging into one of the other tissue compartments. This misclassification would introduce a bias into the processing of the transmission data that would eventually affect the attenuation-corrected emission images. Therefore, for SAC processing, a gaussian filter is preferred.
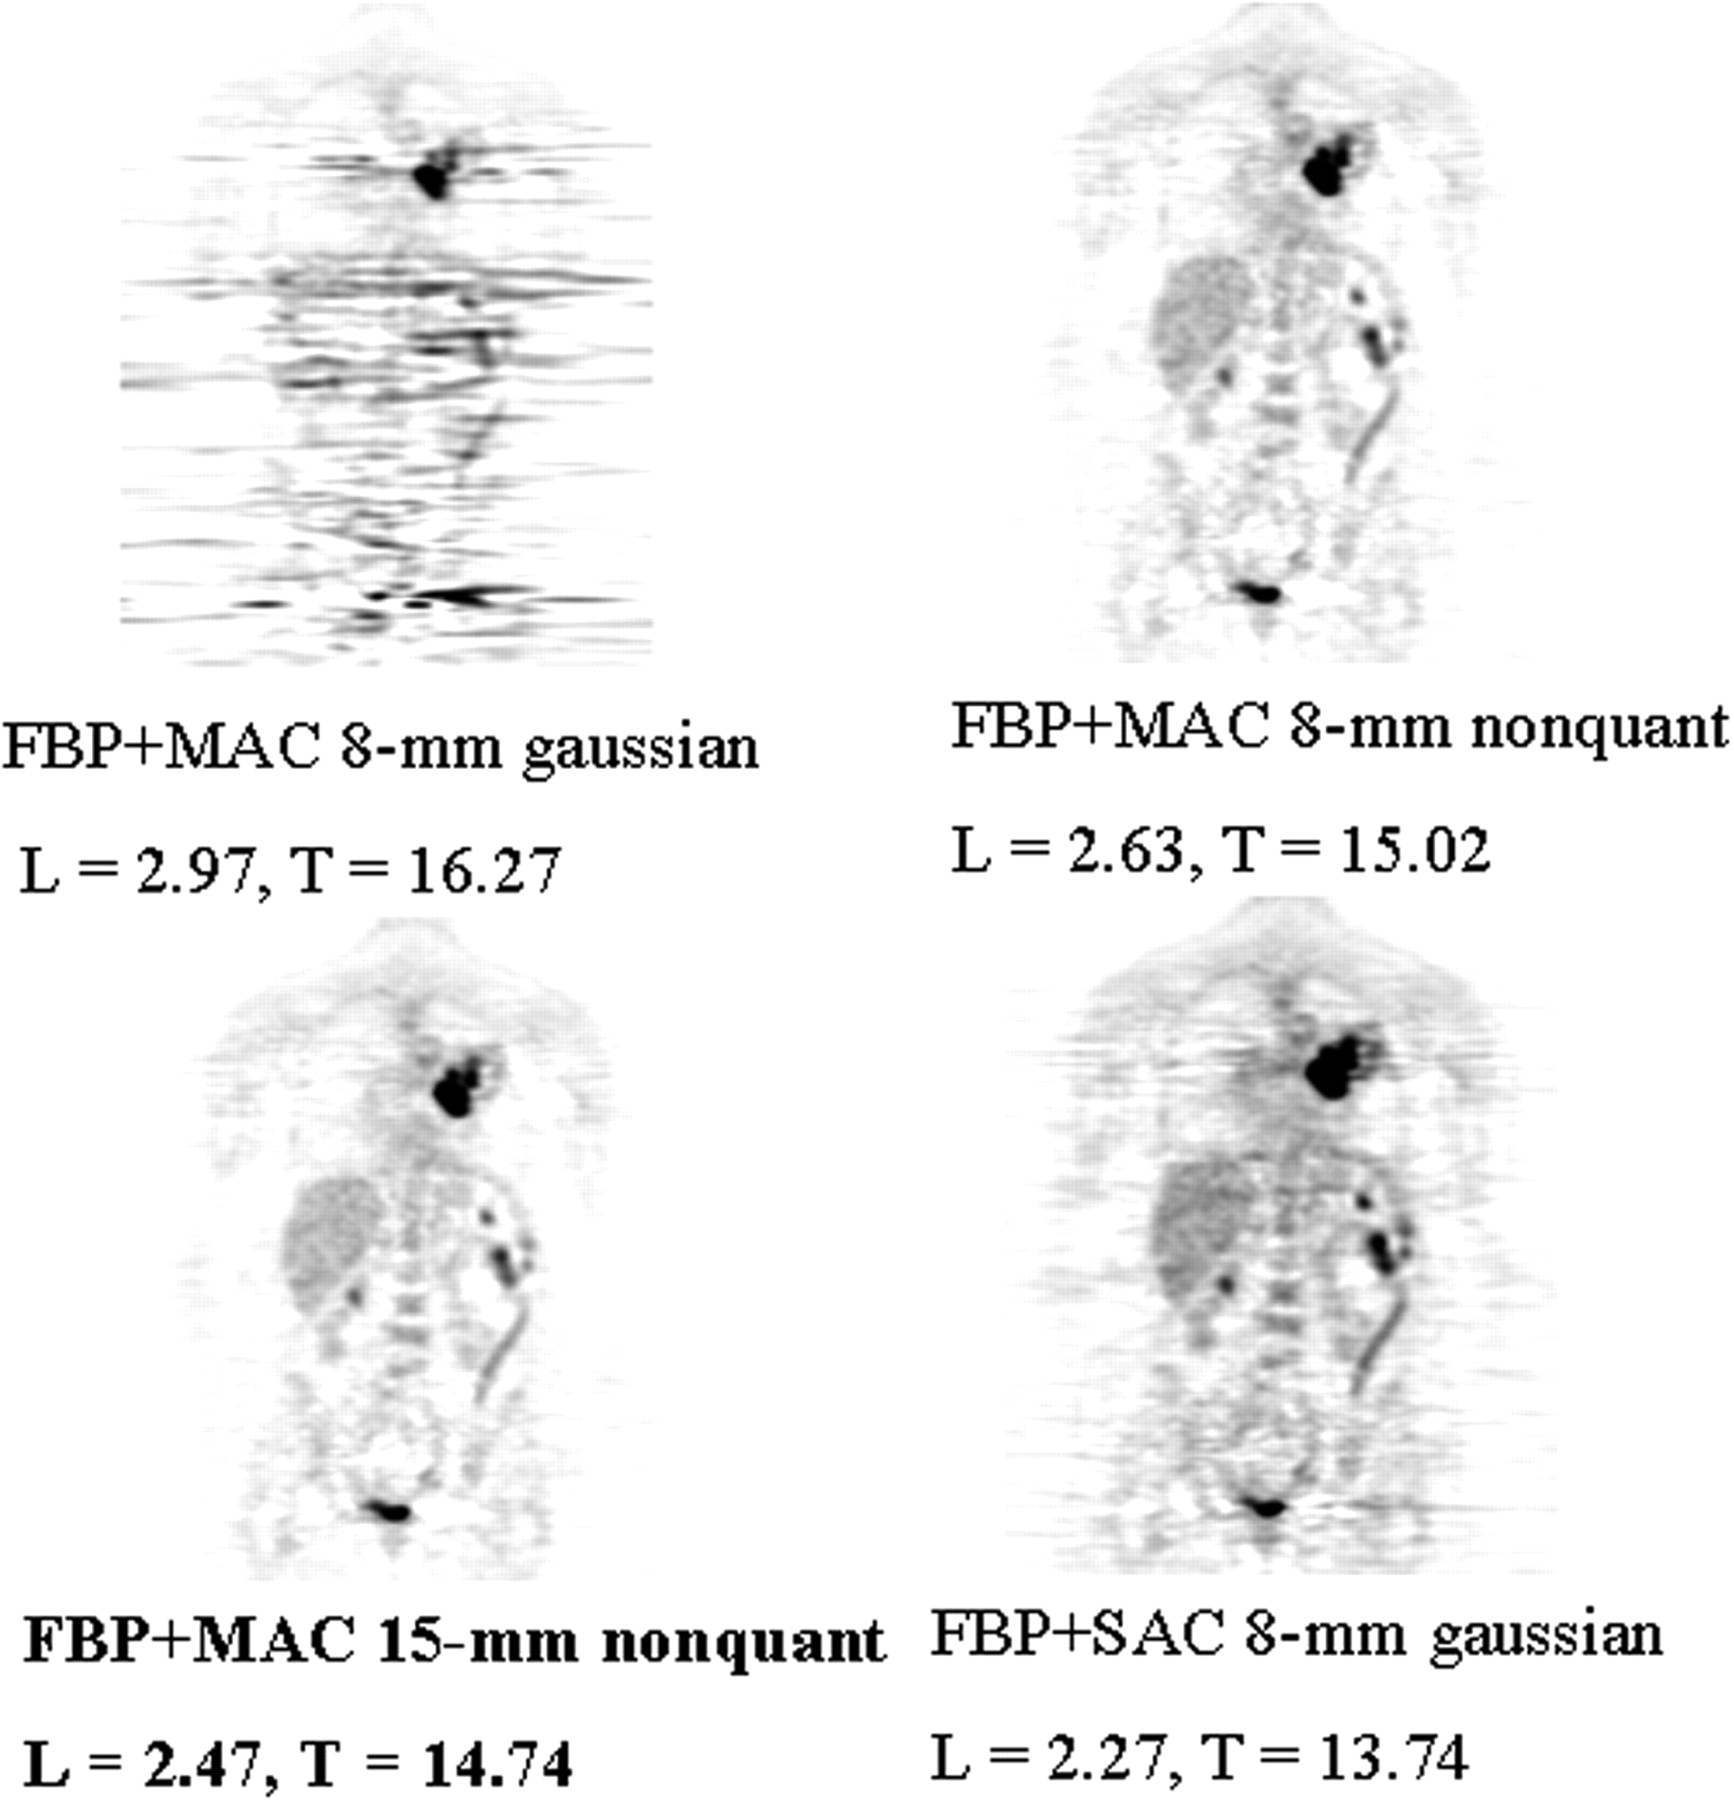
In summary, though changes from IR to FBP (or vice versa) do affect the measurement of activity concentration, such differences in SUV measurements are to a larger degree related to the way transmission data are processed. However, the use of different filters for the smoothing of transmission data is necessary to obtain attenuation-corrected images of optimal quality for clinical interpretation. Although this may be considered an “unfair” comparison between various ways of image processing, this approach does reflect daily clinical practice with the intent to achieve optimal image quality. For instance, when using SAC for FBP images with transmission data filtered with an 8-mm gaussian filter (same setting as for IR transmission filtering), the resulting images are very noisy and of low quality (Fig. 6). On the other hand, for the reasons explained in the previous paragraph, nonquantitative transmission smoothing cannot be used for IR images.

Patient example: Images reconstructed with FBP+MAC. Effect of different filters for smoothing of transmission data and effect of varying cutoff parameters. L = liver; T = tumor; nonquant = nonquantitative filter. Values are SUV max. Patient example in bottom left is used for clinical purpose.
Study Limitations
A comprehensive investigation of all potential factors influencing the accuracy of activity quantification in PET imaging is beyond the scope of this work. For instance, the selection of other parameters for IR (e.g., 16 subsets and 4 iterations) would also affect the accuracy of SUV measurements. Our study does not investigate this question systematically, but the example shown in Figure 7 demonstrates that the change of number of subsets and iterations has little impact on activity quantification in organs with low activity, such as the liver, but can alter the measurements considerably for lesions with intense FDG accumulation.
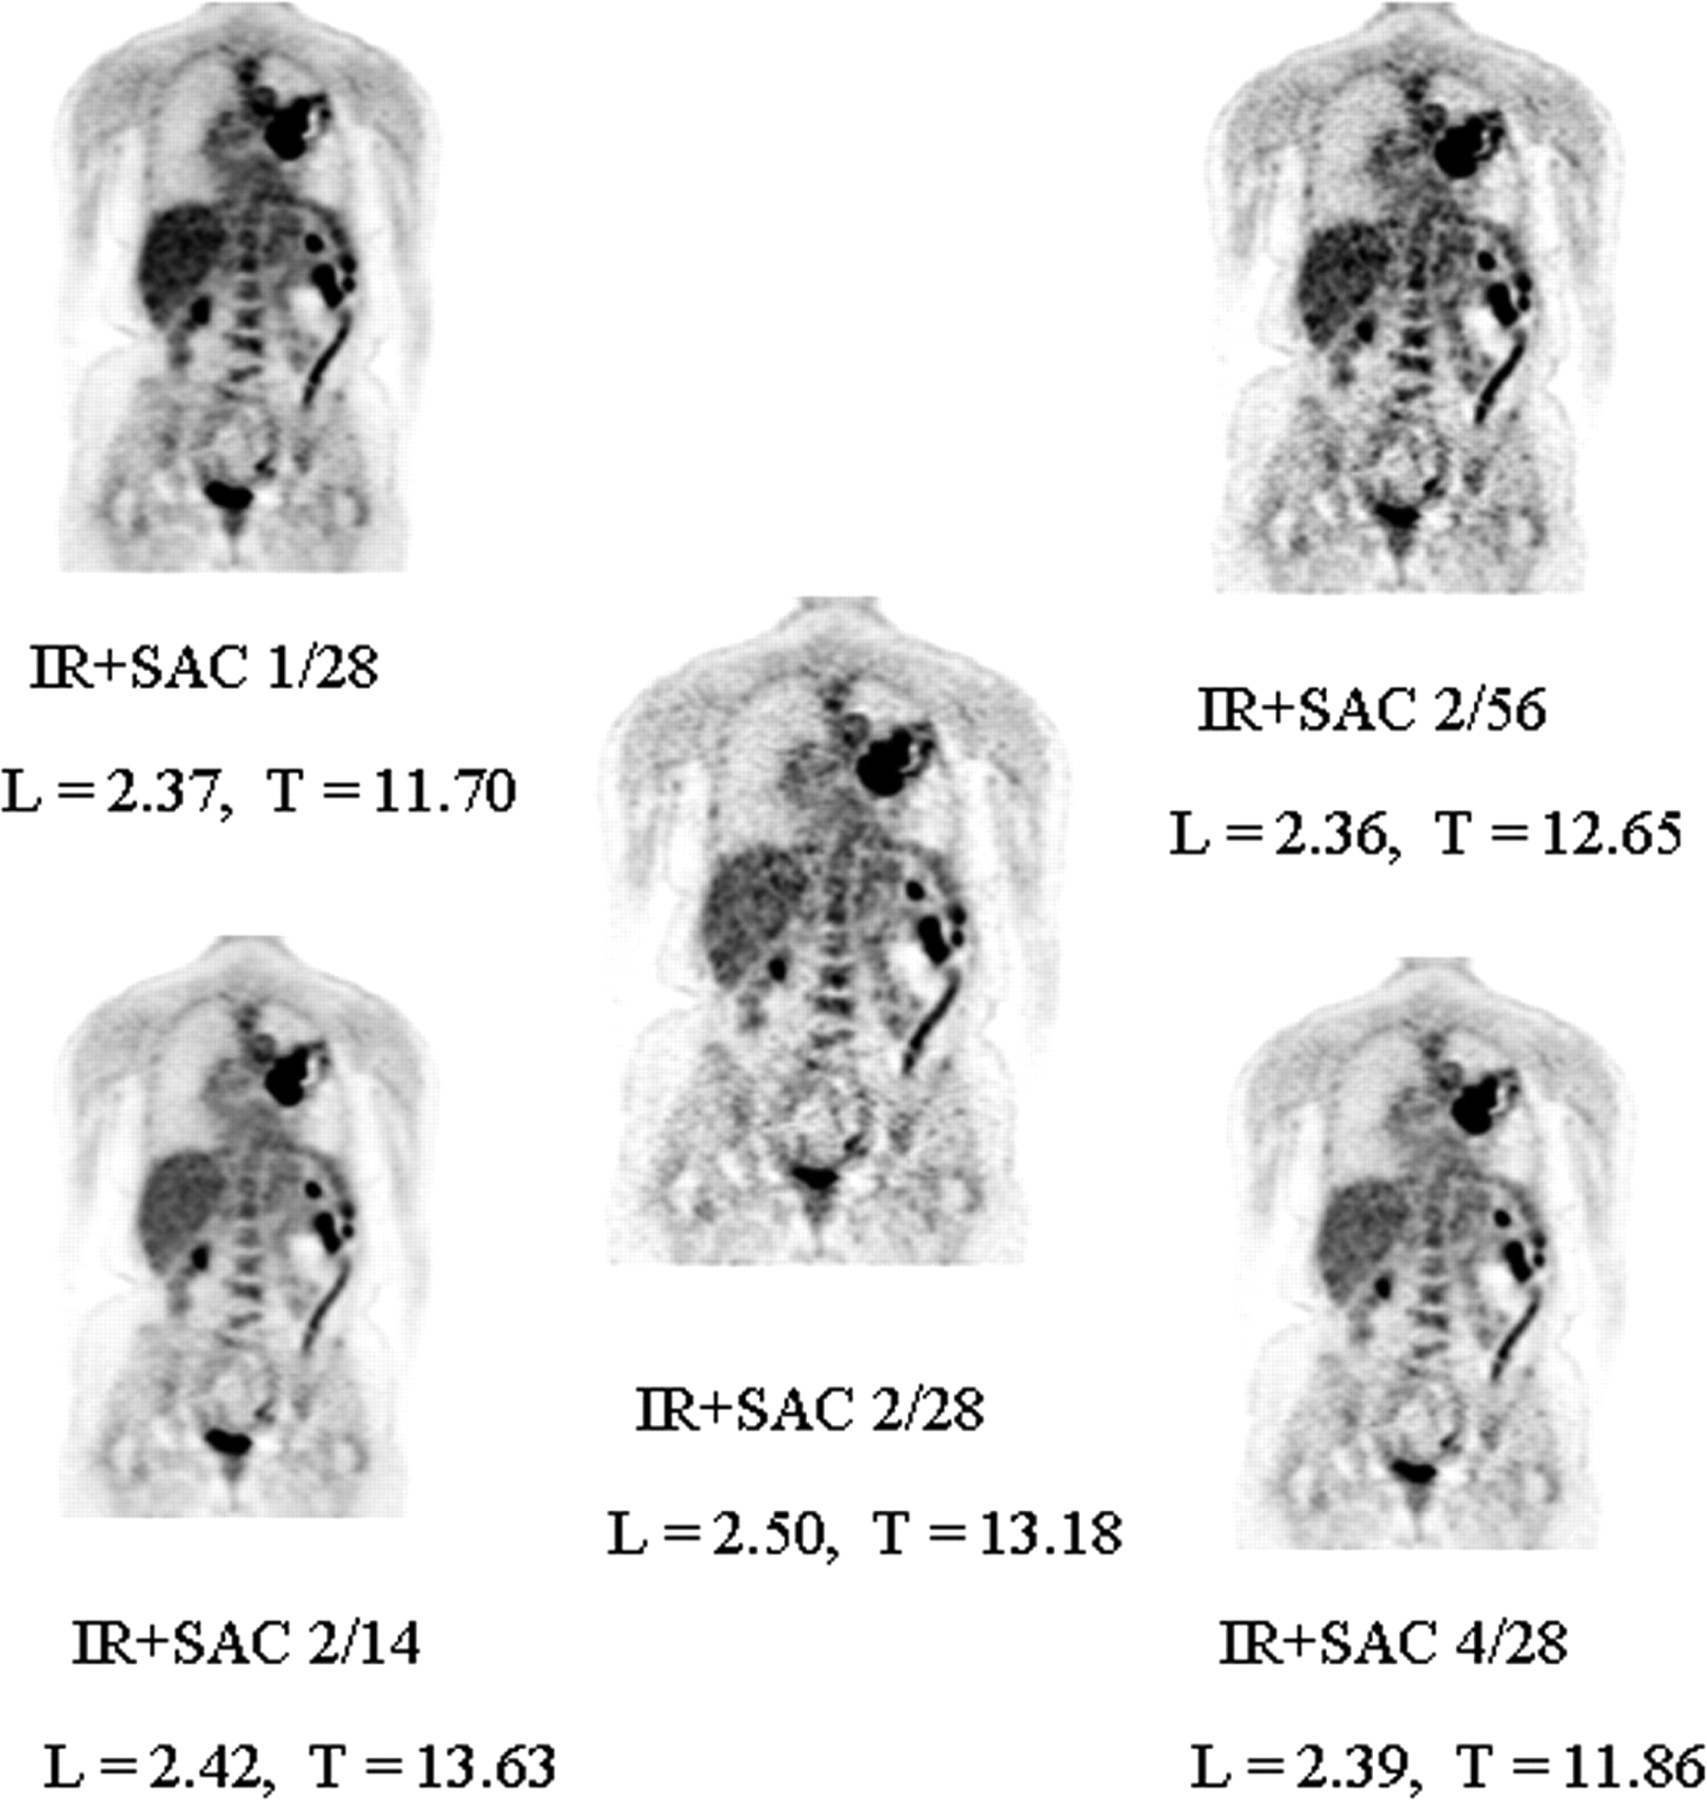
Patient example: Images reconstructed with IR+SAC. Effect of changes in number of iterations and subsets for IR on SUV. First number indicates number of iterations; second number indicates number of subsets. L = liver; T = tumor. Values are SUV max. Patient example in middle is used for clinical purpose.
In addition, the use of 3-dimensional (3D) acquisition, as compared with 2D acquisition, could also potentially influence the accuracy of SUV measurements. In 2D imaging, with the help of septa, the fraction of scattered photons is restricted to approximately 10%–15% of the all detected events. With 3D imaging, this ratio increases to 35%–45% of all detected events. Therefore, the accuracy of activity quantification in 3D imaging is heavily based on the effectiveness of scatter correction, and a similar argument can be made for randoms correction. However, the major, user-dependent factor that could influence the final image resolution, and hence accuracy of activity measurements, is the selection of reconstruction filters and their parameters. Additionally, positron energy, photon colinearity, scatter and randoms correction, normalization, dead time (correction), and geometric correction can also affect the accuracy of activity quantitation. Finally, it is uncertain whether and to what degree the geometry and specifications of different PET tomographs (from different manufacturers) might affect the accuracy and reproducibility of SUV measurements.
Clinical Implications
Since the introduction of seamless whole-body imaging by Dahlbom et al. several years ago (20), PET has continuously gained clinical acceptance and is now an essential and widely used modality for the staging and treatment evaluation in patients with a large variety of malignancies (1,2). The routine clinical use of attenuation correction and IR has vastly improved the quality of PET images. It appears that many institutions are now relying on IR images because they appear generally less noisy and easier to interpret (4). Some studies also suggest that the detection rate of tumor lesions (with abnormal FDG uptake) is higher on IR than on FBP images (19).
Optimal image quality is an essential prerequisite for the proper review and accurate interpretation of whole-body PET studies. Therefore, image reconstruction parameters need to be adjusted accordingly, even if this may cause some under- or overestimation of the true activity concentration in a given lesion using semiquantitative (SUV) analysis. Although there is a close correlation between true activity concentration and SUVs from FBP images as well as between SUVs from FBP and IR images, significant differences were noted. Previous studies have also investigated the variability in activity quantification with different image reconstruction methods (9–11). In addition, Ramos et al. (9) reported a considerable within-site variability of SUV measurements from FBP reconstructed images. This is probably due to the fact that FBP has a tendency to underestimate the true activity concentration (or introduce negative bias), which is the result of the filtering step. The magnitude of this effect can be influenced by the specific algorithm used, object size, and the activity concentration in the object. However, none of these prior studies focused on the inevitable clinical implications in cancer patients.
Systematic underestimation of the true radiotracer concentration in tissue would not affect the interpretation when repeated PET studies (for instance, for the evaluation of the response to therapy) are reconstructed with the same method as in the baseline study. In contrast, the study interpretation would change considerably when repeated PET studies are reconstructed using different algorithms: If the initial study is reconstructed with IR and follow-up studies are reconstructed with FBP, an apparent decrease in SUV might then falsely imply a response to therapy. Conversely, an apparent increase in SUV on a repeated PET study might be related solely to the use of a different image reconstruction method (such as the use of IR during follow-up and FBP for the baseline study). Such misinterpretations might be avoidable within a given institution where set protocols exist for image acquisition and reconstruction and physicians are familiar with these settings. In fact, the present study was prompted when we observed a 50% difference in tumor SUVs between the baseline and follow-up study in a patient with stable tumor markers and clinically and radiographically stable disease. This difference was solely due to the use of different image reconstruction parameters. However, a greater problem may arise when serial PET studies are performed at different institutions, not an uncommon scenario in patients seeking a second opinion or being referred to a tertiary care center from outside institutions. Similarly, the validity of apparently established cutoff values for SUV needs to be reassessed in light of these findings. If an SUV of 2.5 were a widely accepted cutoff for the differentiation between malignant and benign lesions (14), a cutoff that is at least 20% higher (i.e., 3.0) would appear appropriate for images reconstructed with IR. Obviously, this would have to be confirmed before applying it in clinical practice.
Though it is clear that SUV should not be taken as the single parameter in PET study interpretation, it is also true that many clinicians and research protocols rely heavily on changes (or lack of changes) in SUV to guide their treatment approach. In fact, the European Organization for Research and Treatment of Cancer has published specific guidelines for the interpretation of FDG PET studies performed for the evaluation of treatment response in cancer patients; for instance, an increase in tumor SUV by 25% is considered an indicator of progressive disease (21). As shown in the present study, differences in SUV much greater than 25%, which are solely due to differences in image reconstruction, can be observed in clinical practice. Of note, discrepancies between SUV measurements increased with increasing activity concentration. Thus, differences in SUV measurements will be most apparent for intensely hypermetabolic lesions and in this study were as high as 55%.
Some authors have questioned the usefulness of SUV measurements altogether (22,23); others have suggested normalization of injected activity to lean body mass (24); in children, body surface area seems to be more appropriate for normalization (25). Nevertheless, the SUV, usually normalized to body weight, is the most frequently used parameter for daily clinical use. This is justified and supported by several studies: For instance, the SUV at the time of initial diagnosis appeared to correlate with the aggressiveness of the primary tumor and the eventual clinical outcome after therapy (6,8,26). Others reported that changes in the SUV during treatment appeared highly predictive of the final treatment response and for the identification of nonresponders (7,12). Therefore, in spite of its limitations, the SUV is, and will likely remain, the most commonly used parameter for the quantification of tracer uptake in clinical PET imaging. Many factors can influence SUV measurements (22,23); the current study emphasizes the need to consider differences in image reconstruction parameters as yet another potential source of changes in SUV, which are not related to (tumor) biologic changes. In light of these findings, some consensus, if not standardization, regarding image acquisition and reconstruction parameters appears warranted.
CONCLUSION
SUV measurements in whole-body PET studies are significantly affected by the chosen image reconstruction and attenuation correction algorithm. Compared with IR+SAC, other methods provided SUVs that were 10%–30% lower, although extremes of up to 55% were observed for higher activity concentrations. This should be considered when serial PET studies are performed for restaging or treatment evaluation in cancer patients. In addition, if SUV are used for differentiating between benign and malignant lesions, different cutoff values should be applied, depending on the chosen method for image reconstruction and attenuation correction.
Footnotes
Received Jul. 14, 2003; revision accepted Oct. 16, 2003.
For correspondence or reprints contact: Heiko Schöder, MD, Department of Radiology/Nuclear Medicine, Memorial Sloan-Kettering Cancer Center, Box 77, 1275 York Ave., New York, NY 10021.
E-mail: schoderh{at}mskcc.org.
REFERENCES
In this issue


Jump to section
Related Articles
Cited By...
- First Clinical Experience with Integrated Whole-Body PET/MR: Comparison to PET/CT in Patients with Oncologic Diagnoses
- Assessment of Interobserver Reproducibility in Quantitative 18F-FDG PET and CT Measurements of Tumor Response to Therapy
- Scan-Time Reduction Using Noise-Matched Images in 2- and 3-Dimensional Bismuth Germanate PET/CT: Clinical Study in Head and Neck Cancer
- Deep-Inspiration Breath-Hold PET/CT: Clinical Findings with a New Technique for Detection and Characterization of Thoracic Lesions
- Segmentation of PET Volumes by Iterative Image Thresholding
- Value of 11C-Choline PET and Contrast-Enhanced CT for Staging of Bladder Cancer: Correlation with Histopathologic Findings
- Intensity of 18Fluorodeoxyglucose Uptake in Positron Emission Tomography Distinguishes Between Indolent and Aggressive Non-Hodgkin's Lymphoma
- Progress and Promise of FDG-PET Imaging for Cancer Patient Management and Oncologic Drug Development
- 18F-FDG Uptake by Primary Tumor as a Predictor of Intratumoral Lymphatic Vessel Invasion and Lymph Node Involvement in Non-Small Cell Lung Cancer: Analysis of a Multicenter Study
- An Analysis of the 18F-FDG Uptake Pattern in the Stomach