


Abstract
The segmentation of metastatic volumes in PET is usually performed by thresholding methods. In a clinical application, the optimum threshold obtained from the adaptive thresholding method requires a priori estimation of the lesion volume from anatomic images such as CT. We describe an iterative thresholding method (ITM) used to estimate the PET volumes without anatomic a priori knowledge and its application to clinical images. Methods: The ITM is based on threshold-volume curves at varying source-to-background (S/B) ratio acquired from a body phantom. The spheres and background were filled either with 18F-FDG or Na124I (124I). These calibrated S/B-threshold-volume curves were used in estimating the volume by applying an iterative procedure. The ITM was validated with a PET phantom containing spheres and with 39 PET tumors that were discernable on CT by using whole-body 18F-FDG (15 patients) and 124I PET/CT (9 patients): The measured S/B ratios of the lesions were estimated from PET images, and their volumes were iteratively calculated using the calibrated S/B-threshold-volume curves. The resulting PET volumes were then compared with the known sphere inner volume and CT volumes of tumors that served as gold standards. Results: Phantom data analysis showed that the S/B-threshold-volume curves of 18F-FDG and 124I were similar. The average absolute deviation (expressed as a percentage of the expected volume) obtained in the PET validation phantom was 10% for volumes larger than 1.0 mL; sphere volumes of 0.5 mL showed a significantly larger deviation. For patients, the average absolute deviation for volumes between 0.8 and 7.5 mL was about 9% (31 lesions), whereas volumes larger than 7.5 mL showed an average volume mismatch of 15% (8 lesions). Conclusion: The ITM sufficiently estimated the clinical volumes in the range of 0.8–7.5 mL; volumes larger than 7.5 mL showed greater deviations that were still acceptable. These findings are associated with the limitation of the ITM. The ITM is especially useful for lesions that are only visible on PET. As a consequence, the lesion dosimetry is feasible with sufficient accuracy using PET images only.
PET is of paramount importance in the determination of the disease extent of various malignancies (1). PET may be used not only as a staging tool but also as a planning tool for radioiodine (2–4) or external beam therapy (5). Accurate radionuclide therapy, however, requires knowledge of target volumes. The accurate absorbed dose to the lesion on PET-based dosimetry also relies on accurate volume estimation to correct for partial-volume effects (6).
Accurate anatomic volume estimation is often based on CT. Difficulties arise if the lesion is barely detectable on CT or the CT-based volume is imprecise or, even worse, if the lesions are only discernable in PET. The determination of the functional volume is usually performed by thresholding methods that were especially developed for SPECT and 18F-FDG PET images (7–9). For instance, the adaptive thresholding method for PET images is based on phantom measurements to derive a relationship between the “true” volume and the threshold to be applied to the PET images (8). This threshold-volume curve was obtained at varying source-to-background (S/B) ratios. In clinical application, the optimum threshold obtained from the adaptive thresholding method requires a crude estimation of the lesion volume. Specifically, if the lesions are expected to be large (>4 mL), a fixed threshold of 36%–44% results in accurate volume estimation based only on the S/B ratio. The adaptive thresholding method cannot be applied to small lesions (<4 mL) that are not discernable in anatomic imaging. This occurred occasionally on 18F-FDG PET and often on 124I PET images (2).
In this study, we describe an iterative thresholding method (ITM) to estimate the PET volumes without a priori knowledge from anatomic images. The ITM was verified both with spherical phantoms and with patients having CT-visible tumors using whole-body PET/CT, in which the known sphere inner volume and CT volumes of tumors, respectively, served as gold standards. The validation was performed with 18F-FDG and 124I. 18F-FDG is the main radiopharmaceutical for PET and 124I—a radionuclide with a nontrivial decay scheme—is becoming increasingly established for the individual radiation dose assessment for 131I therapy of thyroid cancer (2–4).
METHODS AND MATERIALS
ITM
S/B-Threshold-Volume Curve.
The ITM is based on the relationship between true volume and optimum threshold to be applied to PET images and is derived by phantom measurements using spheres of known volumes. The threshold-volume curve depends on S/B ratios; therefore, several curves that are observed at typical S/B ratios on PET images are required (Fig. 1A). In this study, this S/B ratio is referred to as the calibrated S/B ratio in contrast to the measured S/B ratio obtained from the clinical images from which the volume is to be determined (Fig. 1B).

Illustration of ITM. Procedure (A–H) is described in the text.
Iterative Procedure.
The measured source and background activity concentration have to be determined first to calculate the measured S/B ratio (Fig. 1B). The calibrated S/B-threshold-volume curve that suits most to the measured S/B ratio is used further (Fig. 1C). As shown later, the calibrated S/B-threshold-volume curve used was calculated using an analytic expression derived later. According to the selected S/B-threshold-volume curve, there is a fixed-threshold value T1 (fixed-threshold region) for large volumes and it is applied to the gray scale of the PET image (Fig. 1D). The edge of the lesion in transaxial, coronal, and sagittal planes is visible and a first estimation of the volume V1 can be calculated using the ellipsoid model. The volume V1 is used again to determine the second threshold value T2 (Fig. 1E). If the value T2 is significantly larger than T1, then the threshold value T2 is applied again to the gray scale of the PET image and a second volume V2 can be calculated (Fig. 1F). The corresponding threshold value T3 is taken from Figure 1G. In Figure 1, the threshold values T2 and T3 are not significantly different, and the iteration stops at step 3 with an estimated volume V3 (Fig. 1H). Generally, the iteration ends at step n with the estimated volume Vn if the threshold value Tn does not deviate significantly from Tn−1.
Phantoms
PET Phantom for Generating S/B-Threshold-Volume Curve.
The NEMA IEC/2001 body phantom designed in accordance with the recommendations by the International Electrotechnical Commission (IEC) and modified by the National Electrical Manufacturers Association (NEMA) contains 6 glass spheres of different volumes and the lung insert was not used in this study. The characteristics of the spheres are listed in Table 1. Calculations of the sphere inner volumes and the effective inner diameters were performed according to fluid displacement; the outer diameter was determined using a caliper. The spheres were filled with radioactivity ranging from 5 to 100 kBq/mL. The torso cavity was first filled with water without radioactivity (S/B ratio of infinity) and then filled with increasing activity (S/B ratios of about 2.0, 3.0, 5.0, and 9.0; absolute accuracy, ±0.2). The procedure was performed for both 18F-FDG and 124I. 18F was obtained from the Cyclone 18/9 cyclotron (IBA), and the CV 28 cyclotron (Cyclotron Corp.) was used for the production of 124I (10).
Characteristics of Spheres Used and CT Volume Mismatch of Well-Contrasted Spheres Using Whole-Body Protocol (WBP) and High-Resolution Protocol (HRP)*
The partial-volume and spillover effects influence the measured source activity concentration in the sphere. The measured S/B ratio obtained from the PET images differed from the prepared S/B ratio as determined by the dose calibrator. The activity concentration of the sphere had to be selected appropriately to compensate for the partial-volume and spillover effects.
CT Phantom to Estimate the Accuracy of CT Volume.
The test of the accuracy of CT volume estimation was also performed with the IEC/2001 body phantom. The torso cavity was filled with water, and the spheres filled with an aqueous solution of contrast agent instead of pure water only showed a systematic underestimation of the inner diameter by about 2 mm independent of CT window settings. To apply the recommended approach (11) to estimate the CT volume, the spheres were filled uniformly with diluted iodinated contrast agent (Ultravist 300; Schering) to obtain a CT density that was identical to the density of glass; hence, the volume content and the glass wall were not distinguishable in CT imaging. The true volume was calculated using the outer diameter of the sphere.
PET Phantom for Validation of ITM.
Besides clinical images, the validation of the ITM was also performed with the IEC/2001 body phantom using a whole-body PET/CT protocol used for patients and activity concentrations typically observed in tumors. The validation was performed for both 18F-FDG and 124I. The spheres and torso cavity were filled with an activity concentration of about 50 kBq/mL and 5 kBq/mL, respectively. Three successive scans were performed for each nuclide. The inaccuracy due to the “cold” glass wall of the spheres (glass thickness, ∼10% of the spatial resolution) can be neglected. In contrast to the CT phantom measurement, the true volume was calculated using the inner diameter of the sphere.
Patients
Both 18F-FDG and 124I PET/CT images were investigated with lesions visible on both PET and CT images to validate the ITM. First, we studied 15 oncologic patients (16 lesions) who were referred for staging of lung (n = 4), head and neck (n = 5), and gastrointestinal (n = 6) carcinoma. These patients fasted for at least 8 h before examination. The scan was acquired 60 min after the injection of 300 MBq 18F-FDG; the patients received oral and intravenous contrast agents. Second, 9 patients (23 lesions) with differentiated thyroid carcinoma after thyroidectomy were investigated. All patients were hypothyroid with a thyroid-stimulating hormone level of >25 mU/L. The patients received a capsule containing 20–40 MBq Na124I. Scans were acquired about 24 h after capsule intake (no contrast agent was used).
PET/CT Acquisition and Image Reconstruction
Patient Acquisition.
PET was performed using combined PET/CT (Biograph Emotion Duo; Siemens Medical Solutions) based on an ECAT EXACT HR+ PET system. PET/CT scans were whole-body scans acquired with arms up. PET/CT measurements started with a whole-body spiral CT (tube voltage of 130 kVp, 130 mAs, table speed of 8 mm per rotation, slice width of 5 mm). After completion of the CT scan, the bed was advanced automatically to the PET and emission scanning started. PET emission data were acquired in 3-dimensional mode. The patient emission scan lasted 5 min per bed position.
Phantom Acquisition.
PET and CT phantoms were placed centrally within the field of view of the scanner. For the CT phantom, a whole-body spiral CT typically used for patients and a high-resolution spiral CT was scanned (tube voltage of 130 kVp, 145 mAs, table speed of 2 mm per rotation, slice width of 2 mm). The PET measurements for generating the S/B-threshold-volume curves started with high-resolution spiral CT and a 1-bed position PET scan followed with a duration of about 60 min for each S/B ratio. In contrast, the PET phantom acquisition for validation of the ITM was identical with the typical whole-body PET/CT patient measurement. The images were displayed and analyzed with syngo (Siemens) or PMOD 2.5 software (PMOD Technologies).
CT Image Reconstruction.
CT image of the whole-body protocol (WBP) was reconstructed using a matrix of 512 × 512 pixels (reconstruction interval, 2.4 mm; reconstruction kernel B40s; voxel size, 0.98 × 0.98 × 2.4 mm3). The estimated full width at half maximum (FWHM) in the center was 1 × 1 × 5 mm3 in the x-, y-, and z-direction, respectively. The CT image of the high-resolution protocol (HRP) (matrix size of 512 × 512; reconstruction interval, 1 mm; reconstruction kernel U90s; voxel size, 0.98 × 0.98 × 1.0 mm3) had an estimated FWHM of 1 × 1 × 2 mm3.
PET Image Reconstruction.
PET image reconstruction for the patient as well as the phantoms was performed after Fourier rebinning (FORE) with attenuation-weighted ordered-subset expectation maximization (AW-OSEM) at 2 iterations and 8 subsets with a 5-mm postreconstruction gaussian 3-dimensional filter. CT-based attenuation as well as random and scatter corrections were applied. The resulting PET image had a matrix size of 128 × 128 pixels (voxel size, 5.2 × 5.2 × 2.4 mm3) or 256 × 256 pixels (voxel size, 2.6 × 2.6 × 2.4 mm3). The clinical image resolution expressed as FWHM was about 8 × 8 × 8 mm3. For comparison only, few 18F-FDG data were also reconstructed after FORE using standard filtered backprojection (FBP) with a gaussian filter of 5 mm to yield a spatial resolution corresponding to the patient's iterative image reconstruction algorithm.
Phantom Analysis
Determination of S/B-Threshold-Volume Curve Using PET Phantom.
The maximum activity concentration positioned in the proximity of the sphere's center was taken as the source activity concentration. To effectively remove statistical outliners, the values from adjacent slices (±3) were considered using a parabolic fit around the maximum. For small lesions, in particular, the source activity concentration of the small spheres was obtained using a gaussian fit around the profile's maximum. In this case, the gaussian amplitude was used as the source activity concentration.
The background activity concentration was measured only in planes containing the spheres (10 of 63 planes) using 15 circular regions of interest (ROIs) for each plane with a diameter of 4 cm: 6 ROIs positioned left and right, 1 at the bottom and 1 at the top, as well as 1 in the center of the phantom. The average value of all ROIs (n = 150) was the background activity concentration. The calibrated S/B ratio was calculated using the above source and average background activity concentration.
The optimum (upper) threshold for a given S/B ratio was calculated. The threshold is defined by the minimum deviation between measured and true volume and is given as the percentage of the source activity concentration. For instance, if the source concentration is 100 kBq/mL and the optimum threshold is 55%, the optimum upper and lower PET window settings are 100 kBq/mL and 55 kBq/mL, respectively. The image fusion of CT and PET enabled an accurate visual match between CT (inner boundary of the sphere) and PET contours. The central PET slice (observed in transverse, coronal, and sagittal view) was selected in which the sphere's activity appeared largest in the surface area. On a CT image, the window setting (center and width) was selected in such a way that the known inner diameters of each sphere were obtained. In the gray scale, the upper PET window for each sphere was set to be the source concentration and fixed; the lower PET window was adjusted until the boundary of the sphere's activities reached the visual CT boundaries. In this visual match, an inverse logarithmic gray scale was used. The following issues were also checked on a few 18F-FDG images: The optimum thresholds were determined using images reconstructed with FORE + FBP and a linear gray scale. Five independent observers ascertained the thresholds for each sphere, and the mean values and the SD were calculated.
Accuracy of CT Volume Measurement Using CT Phantom.
The CT images obtained from the WBP and HRP were analyzed using a recommended window setting for CT (11). A central window value halfway between the sphere and background density was selected for image display obtained using appropriate ROIs placed over the spheres and background ROIs. The volumes were calculated using the ellipsoid formula. A linear gray scale was used to display the images. Five independent observers calculated the volume. The mean volume and the SD were calculated and compared with the true outer volume.
Validation of ITM Using PET Phantom.
The source concentration of the spheres was determined as already described. The background concentration was obtained using the average value of 3 ROIs located closely to the spheres. The size of the background ROIs was defined by the sphere contours using an upper threshold of 35%. The measured S/B ratio of the sphere was calculated and the corresponding calibrated S/B-threshold-volume curve was applied. The optimum threshold value was calculated using an expression derived in the Results section. Thus, the parametric S/B-threshold-volume curve was used exclusively in the phantom and in the patient analysis. The sphere dimension (length, width, and depth) was determined by measuring the linear dimension in 2 perpendicular slices in which the spheres appeared largest in the surface area. The ratio of the PET to the known sphere inner volume was calculated for each scan.
Patient Analysis
Volume Delineation in PET Using ITM.
The source concentration of the lesion and background concentration were determined as described in the phantom analysis. The lesion dimension was estimated on the resulting PET image by 5 independent observers. From their numbers, the PET volume as well as the mean volume and the SD were calculated. CT volumes of <0.7 mL were excluded from the study because these volumes cannot be reliably determined.
Volume Delineation in CT.
The recommended central window value halfway between lesion density and the density of surrounding tissue (background) was selected for image display (11). A background ROI close to the lesion and a ROI within the lesion were used to apply this optimum CT windows setting. The 2 circular ROIs had a diameter that was equal to the apparent lesion diameter, if possible; otherwise, it was adjusted appropriately to avoid contributions from interfering density values. The lesion dimension was determined by measuring the linear dimension in 2 perpendicular slices. A gray scale was used for image display. The volumes calculated using the ellipsoid model served as reference. Five independent observers calculated the CT volume and the mean volume and the SD were determined.
RESULTS
S/B-Threshold-Volume Curve Using PET Phantom
Figure 2 depicts the optimum threshold applied to the PET images to measure the true volume of the spheres at varying S/B ratios. Both 18F-FDG and 124I exhibited similar S/B-threshold-volume curves. The threshold values of the 2 largest spheres almost coincide with the 5.8-mL value (data not shown). The sizes of the error bars indicate measurement reproducibility obtained from 5 observers and were lower for the larger spheres and at higher S/B ratio.

S/B-threshold-volume curve determined with a phantom at varying S/B ratios. S/B-threshold-volume curves for 18F-FDG (A) and 124I (B) are shown. Threshold values for 26.5- and 11.4-mL volumes are not shown. Sizes of error bars indicate measurement reproducibility. Solid line was calculated using a simple parameterization of calibration curves.
In Figure 2, a simple parameterization of the calibration curves was performed using the function T(V) = m/V + T1 (T = the upper threshold, and V = the volume). The plot of T versus 1/V yielded a straight line with the slope m and the intercept T1 (fixed-threshold value for large volumes). The slope and intercept were determined using a linear regression technique. Remarkably, there is a linear correlation between T1 and the corresponding B/S ratio (not S/B as usually considered; B/S ratio = background-to-source ratio)—namely, T1(B/S) = 61.7% · B/S + 31.6% (r2 = 0.996)—for both 18F-FDG and 124I. The different slopes m obtained at different S/B ratios showed a slight variation (mean ± SD = 7.8 ± 2 % mL). Thus, the threshold T(V, B/S) for varying S/B ratios and volumes V can be estimated using the following expression derived for the specific scanner used: Eq. 1The dashed line in Figure 2 shows the calculated lines on the basis of Equation 1 and was in sufficient agreement with the solid lines.
The volume estimate obtained from the ITM depended on the stopping criterion. The limit was associated with the accuracy of the S/B-threshold-volume curve, the quality of the PET images, and the lesion of interest. Taking into account only the error range involved in the determination of the calibrated S/B-threshold-volume curves, the limit for the stopping criterion of 3%–5% (mean value of the SD of 18F-FDG and 124I) appeared to be reasonable (Fig. 2).
The influence of the image reconstruction algorithm and gray scale on the optimum threshold was investigated on a few images. For example, using the 18F-FDG images with a S/B ratio of infinity, the optimum threshold value obtained from the individual spheres was on average 6% (SD of ±4%) higher for the FBP-reconstructed images; the largest difference of 10% was found for the smallest sphere. This result was associated with the general observation made in this study that OSEM-reconstructed images overestimated the source activity concentration for spheres smaller than 11.5 mL compared with FBP-reconstructed images. Using the linear instead of the logarithmic gray scale, the application of the ITM yielded optimum threshold values that were on average 5% (SD of ±3%) lower; the largest deviation of 10% was observed for the smallest sphere. The calibration curve obtained was not only specific for the S/B ratios and PET device but also, to a minor degree, for the reconstruction algorithm and gray scale used.
Accuracy of CT Volume Measurement Using CT Phantom
Table 1 shows the CT volume mismatch (in percentage of the true volume) using the WBP and the HRP. The volume mismatch was larger for the WBP than for the HRP. The most striking result was the large underestimation in the WBP for the smallest sphere. Using the WBP, the average absolute mismatch was 2.7% and 19% for volumes ranging from 1.0 to 27 and at 0.7 mL, respectively. The data suggest that CT-based volumes ≤ 0.7 mL are inaccurate when using the patient's whole-body PET/CT protocol, even if they are spheric.
Volume Estimation of Spheres in PET Validation Phantom
The ratio of the measured (on the basis of the ITM) to the known sphere inner volumes is given in Figure 3. The error bars are based on the uncertainty in the distance measurement of 1 mm using gaussian error propagation. The averaged measured S/B ratios (obtained from the 3 scans) and the corresponding absolute SD for each sphere starting with the smallest one are as follows: 2.1 ± 0.1, 3.8 ± 0.3, 5.5 ± 0.1, 6.9 ± 0.1, 7.7 ± 0.3, and 7.8 ± 0.2 for 18F-FDG and 1.6 ± 0.1, 2.6 ± 0.1, 4.6 ± 0.2, 6.4 ± 0.5, 7.2 ± 0.3, and 7.6 ± 0.2 for 124I. The number of iterations was often 2 and sometimes 3 for the smallest spheres. Large-volume mismatch was observed for the smallest sphere at low S/B ratio using either the parametric or the measured S/B-threshold-volume curves. These large deviations were particularly pronounced for 124I. The accuracy of the approach is limited for spheres converging to the spatial resolution of the scanner or low contrast. The average absolute deviations for volumes larger than 1.0 mL were 8% (SD of ±4%) and 12% (SD of ±14%) for 18F-FDG and 124I, respectively.

Ratio of measured PET to true sphere volume obtained from PET validation measurements using either 18F-FDG (A) or 124I (B). Dashed line represents identity of PET measured and true volumes. Error bars are based on uncertainty in the distance measurement of 1 mm.
Volume Estimation of Lesions in Patients
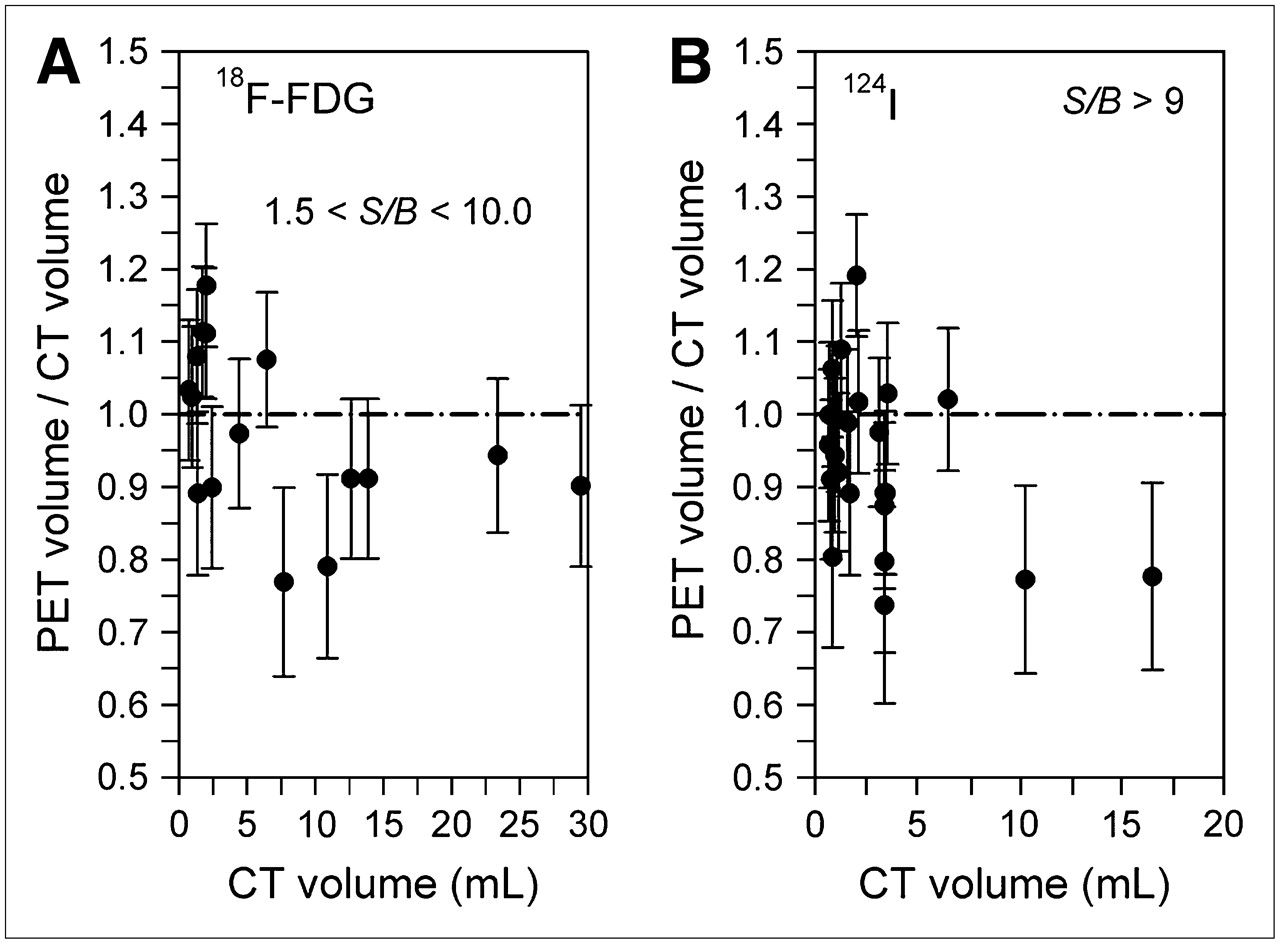
Figure 4 shows the ratios of the measured PET (on the basis of the ITM) to the CT volume. The lesions analyzed accumulated either 18F-FDG (Fig. 4A) or 124I (Fig. 4B). The common number of necessary iteration steps was 2 and the maximum number was 3. Using all data, the correlation coefficient (r2) was 0.986 (VPET/mL = 0.884 VCT/mL − 0.111). The average absolute deviation obtained from 18F-FDG and 124I PET images was about 9% (SD of ±8%) for volumes between 0.8 and 7.5 mL (r2 = 0.989, VPET/mL = 0.986 VCT/mL − 0.02, 31 lesions), whereas volumes larger than 7.5 mL (r2 = 0.985, VPET/mL = 0.970 VCT/mL − 1.62, 8 lesions) exhibited an average deviation of 15% (SD of ±8%). There were 8 lesions (2 18F-FDG and 6 124I) with volumes of <1.0 mL. Specifically, the average volume was 0.8 mL (SD of ±0.10 mL; minimum/maximum, 0.71/0.98) and was considered as representative of the smallest volume analyzed. A consistent underestimation of large volumes (>7.5 mL) was observed, especially evident for 3 lesions with deviations larger than 20%. A profile analysis of these lesions showed either spiky activities or distinctly asymmetric activity distributions.

Ratio of measured PET to CT volume of lesions obtained from patients. Lesions analyzed accumulated either 18F-FDG (A) or 124I (B). Dashed line represents identity of PET measured and true volumes. Size of error bars indicates measurement reproducibility obtained from the 5 observers.
DISCUSSION
A method is proposed that requires no a priori information of the volume of interest. It only requires (a) the S/B ratio of the lesion easily taken from the PET image and (b) the S/B-threshold-volume curve to be determined once for the specific PET camera, image reconstruction algorithm, gray scale, and nuclide used.
The S/B-threshold-volume curve appears to be slightly dependent on the type of image reconstruction algorithm and gray scale, especially for small structures. The optimum threshold values were consistently higher for the FBP-reconstructed images because the source activity concentration is in general underestimated compared with the values for the OSEM-reconstructed images (12). A linear gray scale is applied to view the PET images and is preferably used for image interpretation. However, the logarithmic gray scale emphasizes the variations in small values and deemphasizes the variations of larger values. Displaying the images on a logarithmic scale is probably an easy method to improve the contrast of outlining the lesion boundary and to maximize the reproducibility as well as the sensitivity of the visual boundary delineation. Thus, it is advisable to keep the image reconstruction algorithm and the gray scale constant on both the calibration measurement and the patient investigation.
The S/B-threshold-volume curve strongly depends on the spatial resolution of the imaging device. The spatial resolution in PET is affected by several factors, such as the positron energy of the isotope of interest (13). For this reason, the S/B-threshold-volume curves of both the pure positron emitter 18F (maximum energy, 0.63 MeV) and the nonpure positron emitter 124I (maximum energy, 2.14 MeV) were determined separately (14). Because 124I emits prompt γ-rays—in cascade with positron emission—additional random, scatter, and γ-coincidences (vs. the annihilation coincidences) result in an increased background; therefore, the image contrast is lowered (15). Nevertheless, the phantom analysis showed no significant differences in the S/B-threshold-volume curve between 18F-FDG and 124I because the spatial resolutions of both isotopes are similar (14,15). Thus, clinical 18F-FDG and 124I PET/CT images were analyzed using the same S/B-threshold-volume curve.
The ITM was verified with 18F-FDG and 124I PET/CT using both a PET validation phantom containing spheres and CT-visible tumors. The PET validation measurements mimic, in a simplified way, conditions that occur in patient investigations and deviated from the high-statistics calibration measurements—that is, noise level, activity concentrations, and measured S/B ratio were different. The results of the PET validation phantom demonstrated that the ITM adequately estimated the volumes in the PET phantom images under clinical conditions except for the smallest sphere.
A further validation of the ITM was performed on the basis of the clinical PET and CT images in which the CT volume served as the gold standard. A cogent validation requires that the accuracy of the CT-based approach in volume delineation had to be checked. For this purpose, a CT phantom containing well-contrasted lesions was used. Using the whole-body PET/CT protocol, a significant underestimation of the smallest sphere was calculated and is most likely related to the partial-volume effect in CT. As a consequence, CT volume estimates—especially ≤0.7 mL—are inaccurate, and only clinical CT volumes that were marginally larger than 0.7 mL were analyzed and compared with PET volumes derived from the ITM. The average deviation between clinical PET and CT volume ranging from 0.8 to 7.5 mL was 9%—a margin of error that is similar to the average deviations observed in the PET validation measurement. The largest deviation observed in 124I-accumulating tumors (S/B > 9, high-contrast image) with volumes of about 0.8 mL was only 20%, whereas a maximum deviation of about 50% was observed in the PET validation measurement for the corresponding 1.0-mL sphere (S/B > 2.6, low-contrast image). This suggests that the volume mismatch increases with decreasing image contrast. Thus, the ITM sufficiently estimates the volumes of tumors analyzed in the range of 0.8–7.5 mL. However, clinical PET volumes larger than 7.5 mL showed a higher absolute deviation (Fig. 4), and this finding is associated with the limitations of the ITM.
The ITM is limited by the spatial resolution, implicit activity distribution, edge detection, and volume model of the lesion. For lesions with an effective diameter close to the spatial resolution of the scanner, the ITM cannot be applied due to partial-volume effects. PET scanners with higher spatial resolution are evidently required to reliably delineate volumes of ≤0.5 mL. As shown by the PET validation phantom measurement, the inaccuracy can be considerably large if the size of the lesion converges with the spatial resolution. The investigator might exercise caution when applying the ITM for this small lesion. The ITM sometimes estimates inaccurate volumes for large lesions. The published thresholding methods (7,8), including the ITM, provide reliable volume estimates only if the imaged activity distribution is homogeneous. Thus, the spiky nature or asymmetric activity distribution accounts for the large underestimation. Errors relating to observers in the detection of lesion edges (blurring effect) after setting the optimum threshold may be another source of inaccuracy that leads to intra- and interobserver variability of the volume. The measurement of the S/B-threshold-volume curves assumed spheric lesions, and the clinical PET and CT volume calculations were performed using an ellipsoid model. These simple suppositions are an approximation of the irregularly shaped tumors. Finally, errors associated with lesion masses moving during data acquisition (16), especially for imaging of lung lesions, are unpredictable. As the consequence, the clinical volume estimation may be less accurate, as suggested by our data, and further clinical investigations are required—that is, a systematic investigation of tumors located in different body regions.
One drawback relating to the ellipsoid volume might be removed using voxel-based analysis of volume estimation. This type of manual voxel counting is time-consuming and requires a higher degree of training as well as experience. In contrast, the ellipsoid model used has the advantage of ease of use. A further development would be a semiautomatic computer-controlled iterative thresholding procedure, including voxel-based volume estimation. This volumetry probably increases the reproducibility and circumvents many user interactions, and volumes of irregular-shaped tumors can probably be assessed more reliably. Thus, a semiautomated method makes it amenable to further clinical investigations instead of being solely a research tool.
The CT volume was considered to be the gold standard; however, the anatomic and functional volume sometimes deviates (17), and this is probably not caused by technical shortcomings but, rather, by an intrinsic feature of the lesion. Therefore, the functional and anatomic delineation of the volume appears to be of equal importance to ascertain the gross extent of malignancy. The complementary—functional and anatomic—information, if available, may improve radioiodine therapy and external beam radiotherapy. This can be best achieved using PET/CT along with the proposed ITM, making conformal radiotherapy (18) gradually more advanced and providing new insights into the field of functional and anatomic differences. Hence, the ITM may improve lesion dosimetry.
CONCLUSION
As demonstrated with clinical 18F-FDG and 124I PET images, the application of the ITM yielded reliable PET volume estimation when compared with CT volumes unless a distinctly nonuniform activity distribution was observed. A thorough examination of the activity distribution is required. A major benefit of the ITM over methods that require an independent estimate of lesion size is that it may be used where such an estimate is not available—for example, in cases in which the lesion is invisible on anatomic imaging or for studies using dedicated PET systems. There are limitations preventing estimates of small volumes; therefore, the investigator might exercise caution when applying the ITM to obtain a reliable volume estimate for lesions with an effective diameter that is close to the spatial resolution of the PET system.
Footnotes
-
COPYRIGHT © 2007 by the Society of Nuclear Medicine, Inc.
References
- Received for publication March 7, 2006.
- Accepted for publication October 19, 2006.


Jump to section
Related Articles
Cited By...
- Tumor Dose-Response Relationship of [131I]MIBG Therapy in Patients with Neural Crest Tumors by Means of [124I]MIBG PET
- Efficacy and Safety of 124I-MIBG Dosimetry-Guided High-Activity 131I-MIBG Therapy of Advanced Pheochromocytoma or Neuroblastoma
- Semiautomatically Quantified Tumor Volume Using 68Ga-PSMA-11 PET as a Biomarker for Survival in Patients with Advanced Prostate Cancer
- Prognostic Value of Pretherapeutic Tumor-to-Blood Standardized Uptake Ratio in Patients with Esophageal Carcinoma
- An Improved Iterative Thresholding Method to Delineate PET Volumes Using the Delineation-Averaged Signal Instead of the Enclosed Maximum Signal
- Assessment of Lesion Response in the Initial Radioiodine Treatment of Differentiated Thyroid Cancer Using 124I PET Imaging
- Clinical Relevance of 18F-FDG PET and 18F-DOPA PET in Recurrent Medullary Thyroid Carcinoma
- MIRD Pamphlet No. 23: Quantitative SPECT for Patient-Specific 3-Dimensional Dosimetry in Internal Radionuclide Therapy
- Comparative Assessment of Methods for Estimating Tumor Volume and Standardized Uptake Value in 18F-FDG PET
- 18F-FDG PET/CT as an Indicator of Progression-Free and Overall Survival in Osteosarcoma
- Optimized 124I PET Dosimetry Protocol for Radioiodine Therapy of Differentiated Thyroid Cancer