


Abstract
Our goal was to estimate and compare across different readers the reproducibility of the 18F-FDG PET standardized uptake value (SUV) and CT size measurements, and changes in those measurements, in malignant tumors before and after therapy. Methods: Fifty-two tumors in 25 patients were evaluated on 18F-FDG PET/CT scans. Maximum SUVs (SUVbw max) and CT size measurements were determined for each tumor independently on pre- and posttreatment scans by 8 different readers (4 PET, 4 CT) using routine nonautomated clinical methods. Percentage changes in SUVbw max and CT size between pre- and posttreatment scans were calculated. Interobserver reproducibility of SUVbw max, CT size, and changes in these values were described by intraclass correlation coefficients (ICCs) and estimates of variance. Results: The ICC was higher for the pretreatment, posttreatment, and percentage change in SUVbw max than the ICC for the longest CT size and the 2-dimensional CT size (before treatment, 0.93, 0.72, and 0.61, respectively; after treatment, 0.91, 0.85, and 0.45, respectively; and percentage change, 0.94, 0.70, and 0.33, respectively). The variability of SUVbw max was significantly lower than the variability of the longest CT size and the 2-dimensional CT size (mean ± SD before treatment, 6.3% ± 14.2%, 16.2% ± 17.8%, and 27.5% ± 26.7%, respectively, P ≤ 0.001; and after treatment, 18.4% ± 26.8%, 35.1% ± 47.5%, and 50.9% ± 51.4%, respectively, P ≤ 0.02). The variability of percentage change in SUVbw max (16.7% ± 36.2%) was significantly lower than that for percentage change in the longest CT size (156.3% ± 157.3%, P ≤ 0.0001) and the 2-dimensional CT size (178.4% ± 546.5%, P < 0.0001). Conclusion: The interobserver reproducibility of SUVbw max for both untreated and treated tumors and percentage change in SUVbw max are substantially higher than measurements of CT size and percentage change in CT size. Measurements of tumor metabolism by PET should be included in trials to assess response to therapy. Although PET reproducibility was high, the variability observed in analyses of identical image sets by 4 readers indicates that automated analytic tools to assess response might be helpful to further enhance reproducibility.
Measurement of tumor response is an essential component of most anticancer therapy clinical trials. Standardized and reproducible assessments of response are required for meaningful comparisons and conclusions across multiple trials. Presently, the major response criteria for solid tumors, Response Evaluation Criteria in Solid Tumors (RECIST) (1) and the World Health Organization criteria (2), primarily rely on changes in tumor size on anatomic imaging. Although several studies have demonstrated reasonably good intra- and interobserver reproducibility of tumor size measurements (3,4), others have demonstrated that inconsistent tumor size measurements can lead to incorrect interpretations of tumor response (5,6).
Functional imaging with 18F-FDG PET is being applied with growing frequency in cancer treatment response trials because of the ability of this modality to predict the response of a tumor to therapy and outcomes (7,8). As a result, 18F-FDG PET is being applied with growing frequency in cancer treatment response trials. A visual assessment of 18F-FDG PET images has been incorporated into the revised International Workshop Criteria for monitoring response of lymphoma to therapy (9), and 18F-FDG PET has also been included in a recent update of RECIST (RECIST 1.1) (10).
Investigators have begun to focus on developing standardized metabolic response criteria, and the methods used to quantify 18F-FDG uptake in tumors are being carefully scrutinized. PET is intrinsically quantitative, and a commonly used parameter is the standardized uptake value (SUV), defined as concentration of radioactivity in tissue normalized to injected dose and body mass, lean body mass, or surface area (11). Although a considerable range of approaches to SUV determination has been used, maximum SUV in a single voxel is widely used because of its simplicity (12).
Despite the relative ease of SUV determination, compared with other quantitative parameters, such as Patlak analysis or full kinetic approaches, numerous patient- and technique-related factors can affect SUV (12–18). For repeated tumor measurements, the technique for obtaining the 18F-FDG PET study and SUV should be the same in all institutions and SUV must be highly reproducible so that data obtained in multicenter trials can be compiled for the evaluation of large patient populations. This is particularly true for trials of therapy assessment when small changes in tumor metabolism are being evaluated.
A limited number of test–retest studies have shown that SUV is a reproducible parameter, with intrasubject variability of tumor SUV ranging from 3% to 14% (12,15,18–22). However, most of these studies were performed in carefully controlled settings to best optimize the precision of the SUV measurement, and untreated tumors of substantial size and high tumor metabolism only were evaluated. Data on interobserver reproducibility of SUV are more limited but reported to be high in untreated tumors (20,21,23). To the best of our knowledge, just 1 recent study has evaluated the interobserver reproducibility of SUV in the posttherapy setting (23).
The reproducibility of SUV measurements has not been directly compared with the reproducibility of quantitative measurements of CT size, the current standard for assessing tumor response to therapy (1,2), in the same patient. We hypothesized that SUV is more reproducible for pre- versus posttherapy studies and more reproducible than measurements of CT size on anatomic imaging. Our purpose was to estimate and compare the interobserver reproducibility of SUV and CT size measurements, and changes in those measurements, in malignant tumors before and after treatment using readily available clinical methodologies.
MATERIALS AND METHODS
Patients
Retrospective data compilation and image review were approved by the Johns Hopkins Institutional Review Board. Between April 2003 and April 2005, 25 patients (6 men, 19 women; mean age, 51 ± 14 y; 16 with primary breast carcinoma, 9 with primary lung carcinoma) were identified as having a pretreatment 18F-FDG PET/CT scan and a posttreatment scan soon after treatment was begun. Nineteen patients had untreated primary disease, and 6 patients had untreated recurrent malignancy. Interval therapy consisted of chemotherapy (n = 21), hormonal therapy (n = 1), chemotherapy and hormonal therapy (n = 1), chemotherapy and biologic therapy (n = 1), or chemotherapy and radiation therapy (n = 1).
18F-FDG PET/CT Scans
Patients fasted for a minimum of 4 h and had blood glucose levels less than or equal to 200 mg/dL just before the intravenous injection of 18F-FDG (8.14 MBq/kg [0.22 mCi/kg]). Oral, but not intravenous, contrast was administered for the CT portion of the study.
After an approximately 60-min uptake phase, combined whole-body PET/CT (Discovery LS; GE Healthcare) was performed. Whole-body CT was performed first with a 4-slice multidetector helical scanner and the following parameters: 140 kV, weight-based amperage (range, 80–160 mA), 0.8 s per CT rotation, pitch of 6, table speed of 22.5 mm/s, 722.5-mm coverage, and 31.9-s acquisition time. A CT transmission map was generated for image fusion. PET emission data were acquired for 5 min at each bed position, with the patient in the same position as for the CT portion of the study. PET images were reconstructed using the ordered-subset expectation maximization algorithm (2 iterations, 28 subsets), an 8-mm gaussian filter with a 128 × 128 matrix, and non–contrast-enhanced CT attenuation correction.
Image Analysis
Fifty-two tumors (up to 3 per patient) were identified for analysis by 1 author and indicated to the readers as the reference tumors by location and transaxial image number on the pretreatment scan. For the posttreatment study, readers independently identified the tumors to be analyzed by comparing the posttreatment with the pretreatment scan. In patients with multiple tumors, the largest tumors, greater than 10 mm in at least 1 dimension, were chosen for analysis. Median tumor size was 22 mm (range, 10–58 mm) by 15 mm (range, 7–41 mm).
PET images were reviewed on a Xeleris workstation (GE Healthcare) by 4 nuclear medicine physicians or nuclear radiologists with experience in 18F-FDG PET/CT. Images were viewed on a single split screen displaying PET, CT, and fused PET/CT images. Readers were asked to manually determine the single voxel SUVbw maximum (SUVbw max) of each tumor on the pre- and posttreatment PET scans using the SUV tools on the Xeleris software. If a tumor completely resolved on the posttreatment scan, readers were instructed to record the single voxel value SUVbw max of background tissues in the area of the previous tumor. No further instructions regarding the exact method to determine SUVbw max were specified.
CT images were reviewed with Emageon UltraVisual software (UltraVisual Medical Systems Inc.) by 4 board-certified radiologists with extensive CT experience. The longest and perpendicular sizes of each tumor were determined with the UltraVisual measuring tool, with the PET images available for comparison. Readers were instructed to record the CT size as zero (0) millimeters if the tumor completely resolved on the posttreatment scan. The 2-dimensional size of each tumor was determined by multiplying the longest and perpendicular dimensions.
The longest and 2-dimensional CT sizes chosen for evaluation as response assessments were based on changes in these parameters by the major response criteria in clinical trials, RECIST and World Health Organization criteria, respectively (1,2).
Statistical Analyses
For all analyses, the individual tumors were considered independently. Generalized estimating equations (24) were used to model mean SUVbw max and CT size results. A minimum of 3 readers was required to measure an individual lesion for the lesion to be included in the analyses for both SUVbw max and CT size. A χ2 statistic was used to test the hypotheses of mean differences among the readers and between pre- and posttreatment scans for SUVbw max and both CT size parameters.
Percentage declines in SUVbw max and CT size for each lesion between the pre- and posttreatment scans were calculated using the following equation:
Differences in percentage change between PET and CT parameters were tested with a χ2 statistic.
We used 2 methods to assess interobserver agreement for the various parameters. Intraclass correlation coefficients (ICCs) were estimated as a direct measure of agreement among the raters (reproducibility) and were calculated using variance estimates obtained through ANOVA (25). The ICC ranges between 0.00 and 1.00, with values closer to 1.00 representing better reproducibility. Interpretation of ICC was categorized according to Landis and Koch (26) (<0, no reproducibility; 0.0–0.20, slight reproducibility; 0.21–0.40, fair reproducibility; 0.41–0.60, moderate reproducibility; 0.61–0.80, substantial reproducibility; and 0.81–1.00, almost-perfect reproducibility). The reproducibility of the ICC estimates based on their precision (half the width of the 95% confidence interval [CI] × 100%) was also determined.
Coefficients of variation (CV) were estimated to assess the percentage variability between SUVbw max and CT size parameters among the readers. CV was calculated for each tumor by dividing the SD of 4 readers by the mean of 4 readers. The mean CV and SD across all tumors was then determined. Differences between CV of the various parameters were compared using t tests.
It is possible that interobserver reproducibility is dependent on the level of 18F-FDG uptake in a tumor or tumor size. To test this, the same analyses described above were repeated for the tumors with the highest and lowest average SUVbw max (n = 20, each) and the largest and smallest average CT size (n = 20, each) on the pretreatment scan. The tumors with the highest and lowest average SUVbw max were not necessarily the same tumors with the largest and smallest average CT size.
Statistical analyses were performed using R 2.6 online software and SAS 9.1 statistical software (SAS Institute). P values less than or equal to 0.05 were considered statistically significant.
RESULTS
The median time between the pretreatment and posttreatment 18F-FDG PET/CT scans was 52 d (range, 8–175 d). On the basis of 2-tailed paired t tests, parameters known to affect SUV were not significantly different when comparing pre- versus posttreatment scans (serum glucose levels, 100 ± 16 mg/dL vs. 102 ± 18 mg/dL, P = 0.62; patient body weight, 76.3 ± 20.7 kg vs. 77.0 ± 20.6 kg, P = 0.57; injected activity of 18F-FDG, 609 ± 145 MBq vs. 630 ± 164 MBq, P = 0.24; and 18F-FDG uptake time, 64.4 ± 11.5 min vs. 62.2 ± 16.6 min, P = 0.62).
For pretreatment scans, SUVbw max was determined by all 4 PET readers for all 52 tumors. SUVbw max was also determined by all 4 PET readers for all 52 tumors (persistent or residual tumor or background tissue in the location of previous tumor) for posttreatment scans. In addition to absolute SUVbw max determination, PET readers were asked to indicate whether the measurement was obtained in persistent or residual tumor or background tissues after treatment by visual assessment. For 39 of 52 tumors, all 4 PET readers agreed and determined SUVbw max in 32 persistent or residual tumors and 7 background tissues. For the remaining 13 original tumor foci, there was not complete consensus and SUVbw max was determined in residual or persistent tumor or background tissues in the region of the previously visualized tumor, depending on individual readers' assessments.
Before treatment, CT size was determined by all 4 CT readers in 46 tumors, by 3 readers in 4 tumors, and by 2 and 1 readers for 1 tumor each. After therapy, CT size was determined by all 4 readers in 43 tumors, by 3 readers in 6 tumors, and by 2 readers in 3 tumors. The tumors not measured by all readers were not confidently seen or were considered to be unmeasurable because their edge was not clearly defined.
Table 1 summarizes the hypothesis-testing results of mean differences based on our model for the SUVbw max and CT size parameters. No significant difference in mean SUVbw max was found among the 4 readers on the pretreatment scan (reader 1, 9.4 ± 6.3; reader 2, 9.7 ± 6.5; reader 3, 9.8 ± 6.2; and reader 4, 9.3 ± 6.3, P = 0.98) or the posttreatment scan (reader 1, 4.4 ± 4.0; reader 2, 4.8 ± 4.2; reader 3, 4.7 ± 4.0; and reader 4, 4.5 ± 3.8, P = 0.96). On average, SUVbw max was significantly higher on the pretreatment scan than on the posttreatment scan (9.6 ± 6.3 vs. 4.6 ± 4.0, P < 0.001).
Summary of Hypothesis Testing of Mean Differences for PET and CT (Semi)Quantitative Parameters
Mean CT size measurements were not significantly different among the 4 readers before treatment for the longest CT size (reader 1, 25.5 ± 11.6 mm; reader 2, 25.9 ± 11.7 mm; reader 3, 23.5 ± 10.4 mm; and reader 4, 25.6 ± 14.8 mm, P = 0.75) but were significantly different after treatment (reader 1, 22.5 ± 13.4 mm; reader 2, 23.0 ± 12.9 mm; reader 3, 17.7 ± 11.6 mm; and reader 4, 17.4 ± 11.8 mm, P = 0.04). The 2-dimensional CT size was not significantly different among readers before treatment (reader 1, 564.6 ± 568.3 mm2; reader 2, 541.1 ± 448.3 mm2; reader 3, 453.1 ± 411.5 mm2; and reader 4, 614.1 ± 894.6 mm2, P = 0.60) or after treatment (reader 1, 471.2 ± 568.7 mm2; reader 2, 440.3 ± 459.4 mm2; reader 3, 316.6 ± 366.4 mm2; and reader 4, 422.3 ± 990.0 mm2, P = 0.65). CT size was, on average, significantly larger on the pretreatment scan than on the posttreatment scan (longest dimension, 25.1 ± 12.2 mm vs. 20.1 ± 12.6 mm, P < 0.001; 2-dimensional size, 541.8 ± 607.8 mm2 vs. 410.7 ± 637.3 mm2, P = 0.009).
The average percentage decline in SUVbw max between the pretreatment and the posttreatment scans was 45% ± 35% (Table 2). This decline was significantly higher than both declines in the longest CT dimension (20% ± 33%, P < 0.001) and the 2-dimensional CT size (24% ± 56%, P = 0.003).
Summary of Percentage Change in PET and CT Parameters Between Pretreatment and Posttreatment Scans
A summary of the results for the ICC estimates and the reproducibility of the ICC estimates based on their precision are shown in Table 3. ICC was 0.93 (95% CI, 0.90–0.96; precision, ±3%) for pretreatment SUVbw max and 0.91 (95% CI, 0.86–0.94; precision, ±4%) for posttreatment SUVbw max, indicating almost-perfect reproducibility. Pretreatment CT size measurements were substantially reproducible, with an ICC of 0.72 (95% CI, 0.61–82; precision, ±11%) for the longest CT size and an ICC of 0.61 (95% CI, 0.48–0.74; precision, ±13%) for the 2-dimensional CT size. There was almost-perfect reproducibility for the longest CT size after treatment (ICC, 0.85; 95% CI, 0.77–0.91; precision, ±7%), but the 2-dimensional CT size was just moderately reproducible after treatment (ICC, 0.45; 95% CI, 0.30–0.61; precision, ±16%). The precision of the ICC estimate was highest for measurements of SUVbw max before and after treatment (Table 3). Individual SUVbw max and CT size measurement data points for each tumor and reader before and after treatment are shown in Figures 1 and 2.
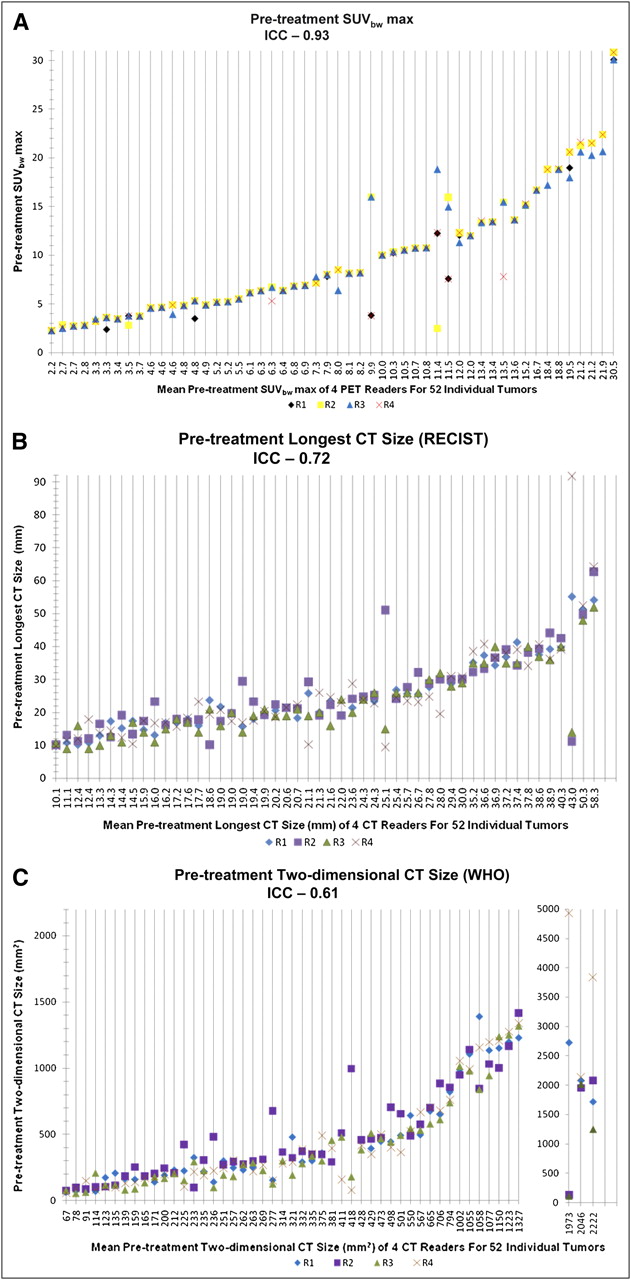
Data points for each individual tumor and reader before treatment are shown: SUVbw max (A), longest CT size (B), and 2-dimensional CT size (C). Before treatment, almost-perfect reproducibility of SUVbw max (ICC, 0.93) was better than substantial reproducibility of longest CT size (ICC, 0.72) and 2-dimensional CT size (ICC, 0.61). CT size was not measured by at least 3 readers for 2 tumors, and these tumors were excluded from ICC analysis (last 2 vertical lines). R1 = reader 1; R2 = reader 2; R3 = reader 3; R4 = reader 4.

Data points for each individual tumor and reader after treatment are shown: SUVbw max (A), longest CT size (B), and 2-dimensional CT size (C). After treatment, SUVbw max (ICC, 0.91) and longest CT size (ICC, 0.85) had almost-perfect reproducibility, although that for SUVbw max was higher. Reproducibility of 2-dimensional CT size was moderate (ICC, 0.45). CT size was not measured by at least 3 readers for 3 tumors, and these tumors were excluded from ICC analysis (last 3 vertical lines). R1 = reader 1; R2 = reader 2; R3 = reader 3; R4 = reader 4.
Interobserver Reproducibility Using ICCs
There was almost-perfect reproducibility for percentage decline in SUVbw max among the 4 PET readers, with an ICC of 0.94 (95% CI, 0.90–0.96; precision, ±3%) (Table 3). Reproducibility among the 4 CT readers was substantial for percentage decline in the longest CT dimension (ICC, 0.70; 95% CI, 0.57–0.81; precision, ±12%) but just fair for the percentage decline in the 2-dimensional CT size (ICC, 0.33; 95% CI, 0.18–0.50; precision, ±16%). Reproducibility of percentage decline in SUVbw max was higher than that for percentage change in CT size measurements (Fig. 3).

Data points for percentage change in each individual tumor for each reader are shown: SUVbw max (A), longest CT size (B), and 2-dimensional CT size (C). Almost-perfect reproducibility of percentage change in SUVbw max (ICC, 0.94) was better than substantial reproducibility of longest CT size (ICC, 0.70) and fair reproducibility of 2-dimensional CT size (ICC, 0.33). Percentage change in CT size was not determined by at least 3 readers for 3 tumors, and these tumors were excluded from ICC analysis (last 3 vertical lines). R1 = reader 1; R2 = reader 2; R3 = reader 3; R4 = reader 4.
A summary of the results for the percentage variability between SUVbw max and CT size parameters among the readers using CV is shown in Table 4. For the pretreatment scan, the CV of SUVbw max (mean ± SD, 6.3% ± 14.2%) was significantly lower than the CV of the longest CT size (16.2% ± 17.8%, P = 0.001) and the 2-dimensional CT size (27.5% ± 26.7%, P < 0.0001). The CV of SUVbw max (18.4% ± 26.8%) was also significantly lower than the CV of the longest CT dimension (35.1% ± 47.5%, P = 0.02) and the 2-dimensional CT size (50.9% ± 51.4%, P < 0.001) after treatment. The CV of the longest CT size was significantly lower than the CV of the 2-dimensional CT size before treatment (P = 0.007) but not after treatment (P = 0.06). The CVs of SUVbw max and both CT size parameters were less on the pre- than on the posttreatment scans (Table 4).
Percentage Variability Between SUVbw max and CT Size Parameters Among Readers
Mean CV for percentage decline in SUVbw max (16.7% ± 36.2%) was significantly lower than mean CV for percentage decline in the longest CT size (156.3% ± 157.3%, P < 0.0001) and the 2-dimensional CT size (178.4% ± 546.5%, P < 0.0001) (Table 4).
For the 20 tumors with the highest and lowest SUVbw max on the pre- and posttreatment scans, there was almost-perfect reproducibility (ICC > 0.81) for both pre- and posttreatment scans (Supplemental Table 1; supplemental materials are available online only at http://jnm.snmjournals.org). No significant differences in CV of SUVbw max for the 20 lesions with the highest versus the lowest metabolic rates were found within the pretreatment group.
For the 20 largest and 20 smallest tumors, pretreatment reproducibility of both CT size parameters was fair to moderate (ICC range, 0.36–0.43). After treatment, there was substantial reproducibility for the longest CT size (ICC range, 0.73–0.81), but reproducibility was fair to moderate for the 2-dimensional CT size (ICC range, 0.32–0.62). For both CT size parameters, no significant differences were found comparing CV for the largest 20 versus the smallest 20 lesions within pretreatment and posttreatment scans (Supplemental Table 2).
DISCUSSION
This study was designed to expand on previous studies evaluating SUVbw max interobserver reproducibility (12,15,19–23) and to compare the interobserver reproducibility of SUV and CT size measurements using clinically available software including posttreatment assessments. Regardless of the statistical method used (ICC and the precision of its estimate or CV), the reproducibility of SUVbw max measurements before and after therapy and percentage change were higher than the reproducibility for CT size measurements. The interobserver variability of SUVbw max was approximately 6% ± 14%—compared with approximately 16%−28% ± 18%−27%—for CT size parameters before therapy, and approximately 18% ± 27%—compared with approximately 35%−51% ± 48%−51%—for CT size parameters after therapy. Perhaps even more importantly, the percentage decline in SUVbw max was much less variable than the percentage decline in tumor size measurements on CT.
The higher variability observed for measurements of tumor size on CT agrees with our hypothesis. Although we applied a routine, vendor-supplied manual technique of region-of-interest (ROI) selection for SUVbw max determination in this study, obtaining tumor measurements on CT requires an even more manual and subjective approach because the reader has to precisely and accurately identify the edges of the tumor. Slightly different angles of measurement could result in greater variability of tumor measurements. The effect is magnified with the 2-dimensional CT size because of increasing error associated with multiplication of 2 uncertain numbers. Studies have demonstrated both good reproducibility and considerable variability of linear CT size measurements (3,4,27), and the results are difficult to compare with themselves and our study because of differing methodologies. Interobserver reproducibility of linear size measurements may be improved with semiautomated techniques and volumetric measurements of tumor size (28–32).
We found slightly lower interobserver reproducibility of SUVbw max than did previous studies of untreated and treated (20,21,23) tumors, 2 of which reported 100% agreement in SUVbw max between 2 readers (20,23). Prior studies focused on highly 18F-FDG–avid, typically solitary, tumors. Our tumor population was probably more variable in its characteristics. Our goal was to emulate SUV determination in the clinical setting and across various expertise levels as much as possible. Location and transaxial image number may not have been sufficient for the correct identification of reference tumors, particularly in patients with multiple tumors located in close proximity. On postanalysis rereview of our data, it was determined that at least 1 of the 4 PET readers likely measured a different lesion than the others for 4 tumors with substantial interobserver variability in pretreatment SUVbw max.
We purposely did not specify that to determine whole-tumor SUVbw max, an ROI must be placed around the whole tumor and not on selected slices. This seems obvious to a skilled PET reader, but might elude a less experienced one and result in operator-dependent variations in SUV. Additionally, 1 of our readers rounded some tumor SUVs to 1 decimal place whereas the others always recorded 2. Display of SUVs to 1 or 2 significant figures to the right of the decimal by different software packages could have an effect when small differences are being evaluated, as in this study.
We hypothesized that the interobserver reproducibility of SUVbw max in treated tumors would be lower than that in untreated tumors because of the challenge of selecting ROIs in tumors with lower levels of 18F-FDG uptake and in background tissues (if there was a visual complete response) and more statistical noise (33). This effect was not observed based on the analysis using the ICC. The posttreatment tumor mean SUVbw max (4.6 ± 4.0) for all tumors might have been too high to demonstrate such an effect. The higher CV of SUVbw max in treated versus untreated tumors must be viewed with caution because the CV is sensitive to small changes in the mean when it is closer to zero, limiting its usefulness. After treatment, the mean SUVbw max of 15 tumors evaluated in this study was less than 2 (compared with none before treatment). Similar explanations probably apply to the subgroup analyses of the tumors with the highest and least metabolic activity.
In therapy response trials, the percentage change in tumor metabolism or size between 2 scans is potentially more important than the absolute quantitation. Interobserver variability of CT size measurements and, therefore, percentage change in CT size can result in the misclassification of tumor response based on standard anatomic imaging criteria (5,6). The probability of misclassifying the response of a lesion has been estimated to be between 8% and 43% because of errors in CT size measurements obtained by different readers (6). In our study, the interobserver reproducibility of percentage change in SUVbw max between pre- and posttreatment scans was substantially higher than that for the percentage change in the CT size parameters. On the basis of our data, it appears that percentage change in SUVbw max is a more robust parameter for monitoring treatment response on therapy trials, particularly when assessing for small changes, than changes on CT.
Despite the high interobserver reproducibility of SUVbw max determination, the fact that some variability exists must be considered when defining thresholds for response criteria. Previous recommendations for threshold values to define response and progressive disease using changes in tumor metabolism were based on retrospective studies with limited patient numbers and various tumor and treatment types (34). Weber et al. (35) prospectively showed that in patients with non–small cell lung cancer the ultimate responders could be separated from the nonresponders using a 20% reduction in tumor SUV after 1 cycle of chemotherapy. Whether a 20% change is large enough to truly indicate a clinically significant response needs further study and may be treatment- and time-after-treatment–dependent.
The retrospective nature of the study is a possible limitation. We attempted to pick easily visualized tumors on the pretreatment scans for evaluation. The lack of intravenous contrast on CT is another potential limitation, particularly for the primary breast tumors, but these accounted for a minority of lesions (16/52). Increasingly, data suggest that there may be no benefit of obtaining a diagnostic CT scan in addition to an 18F-FDG PET/CT scan (36,37). Follow-up studies in differing tumor types and with differing uses of intravenous contrast may be helpful to better refine the precision of CT.
CONCLUSION
SUVbw max is highly reproducible when determined by multiple readers with clinically available software from routine 18F-FDG PET scans before and after therapy and is more reproducible than CT size measurements, particularly 2-dimensional CT measurements. Percentage changes in tumor SUV were more highly reproducible than percentage changes in tumor size on CT and should be seriously considered for inclusion in the future establishment of criteria for trials to assess response to therapy. In fact, the recently proposed PET Response Criteria in Solid Tumors (PERCIST), version 1.0, uses percentage change in peak SUVlean for assessing response after treatment (38). That some variability was seen in analyses of the identical image sets by 4 PET readers using clinical software also points to a need for standardized and specific SUV determinations performed by experienced PET readers for clinical trials and automated analytic tools to assess response and improve reproducibility.
Acknowledgments
This study was supported by a grant to the Imaging Response Assessment Teams in Cancer Center Supplement at Johns Hopkins University from the National Cancer Institute (P30 CA006973-43S2).
Footnotes
-
COPYRIGHT © 2009 by the Society of Nuclear Medicine, Inc.
References
- Received for publication February 17, 2009.
- Accepted for publication July 13, 2009.


Jump to section
Related Articles
Cited By...
- Quantitation of Cancer Treatment Response by 18F-FDG PET/CT: Multicenter Assessment of Measurement Variability
- Repeatability of SUV in Oncologic 18F-FDG PET
- Molecular Imaging of Biomarkers in Breast Cancer
- Reproducible and Sustained Efficacy of Targeted Therapy With Vemurafenib in Patients With BRAFV600E-Mutated Erdheim-Chester Disease
- Practical Approach for Comparative Analysis of Multilesion Molecular Imaging Using a Semiautomated Program for PET/CT
- Metastatic Renal Cell Carcinoma: Relationship Between Initial Metastasis Hypoxia, Change After 1 Month's Sunitinib, and Therapeutic Response: An 18F-Fluoromisonidazole PET/CT Study