


Abstract
A varying degree of interstitial and perivascular fibrosis is a common finding in idiopathic dilated cardiomyopathy (DCM). The perfusable tissue index (PTI), obtained with PET, is a noninvasive tool for assessing myocardial fibrosis on a regional level. Measurements of the PTI in DCM, however, have not been performed yet. This study was undertaken to test the hypothesis that the PTI is reduced in patients with DCM. Methods: Fifteen patients with an advanced stage of DCM (New York Heart Association class III or IV and left ventricular ejection fraction [LVEF] < 35%) and 11 healthy control subjects were studied. PET was performed using H215O and C15O to obtain the perfusable tissue fraction (PTF) and the anatomic tissue fraction (ATF), respectively. Results: The PTI (=PTF/ATF) was reduced in DCM compared with control subjects (0.91 ± 0.12 vs. 1.12 ± 0.10; P < 0.01). Heterogeneity of the PTI, expressed as the coefficient of variation, was increased in DCM versus that of healthy control subjects (0.18 ± 0.07 vs. 0.13 ± 0.06; P < 0.05). There was no correlation between the PTI and echocardiographically derived LVEF in both groups. Conclusion: The PTI was reduced in patients with an advanced stage of DCM. Interstitial and perivascular fibrosis may be responsible for this reduction. Furthermore, the degree of the PTI reduction was variable in DCM patients, both on a regional level and between patients. Noninvasive assessment of fibrosis with the PTI offers the opportunity to evaluate the effects of fibrosis on regional myocardial function, correlate fibrosis with prognosis, and monitor pharmaceutical intervention.
Idiopathic dilated cardiomyopathy (DCM) is a syndrome characterized by cardiac enlargement and global systolic dysfunction in the presence of normal coronary arteries (1). Histologic examination often reveals a variable degree of interstitial and perivascular fibrosis (2–8). Several studies have made an attempt to link the severity of fibrosis to myocardial (dys)function and prognosis (4,5,9–11). Results have been conflicting, however, partly due to the difficulty of quantifying myocardial fibrosis. Quantification of fibrosis is only possible in explanted hearts or through endomyocardial biopsies. A biopsy, however, is an invasive procedure and it only yields information at a very limited regional level.
The perfusable tissue index (PTI) could potentially be used to noninvasively assess myocardial fibrosis. This index is the ratio of the perfusable tissue fraction (PTF) and the anatomic tissue fraction (ATF). It can be obtained with PET using the tracers H215O and C15O (12). The PTI represents the fraction of myocardium that is perfusable by water. Myocardial fibrosis is not able to exchange water rapidly, and a reduction of the PTI has been shown to correlate with the extent of fibrosis after infarction (13). Therefore, the PTI may be reduced in patients with DCM due to an increase in myocardial fibrosis. In addition, because fibrosis is not always distributed homogeneously in DCM (3,4,7), regional differences in the PTI may be expected. To date, however, no measurements of the PTI in patients with DCM have been performed.
The purpose of this study was to evaluate whether (a) the PTI is reduced in patients with DCM in comparison with that of healthy volunteers, (b) the PTI is distributed heterogeneously in DCM, and (c) the PTI is related to global myocardial function.
MATERIALS AND METHODS
Patient Population
Fifteen patients with an advanced stage of DCM (New York Heart Association class III or IV and left ventricular ejection fraction [LVEF] < 35%) and 11 healthy control subjects were studied. The diagnosis of DCM was based on increased left ventricular dimensions, a globally decreased contraction pattern as determined by echocardiography, and the presence of normal coronary arteries as assessed by angiography. Patients were excluded if there was evidence of prior myocardial infarction, underlying valvular pathology by echocardiography, uncontrolled systemic hypertension, or any other systemic disease. Patients were clinically stable on medication, including angiotensin-converting enzyme inhibitors, diuretics, digoxin, and β-blockers. All healthy control subjects underwent a physical examination, electrocardiography, laboratory analysis, and echocardiography. None of the results from these examinations showed any abnormalities. Characteristics of the study population are given in Table 1. All subjects gave written, informed consent, and the protocol was approved by the Medical Ethics Committee of the VU University Medical Center.
Characteristics of Healthy Control Subjects and DCM Patients
Imaging Protocols
PET.
All scans were performed in 2-dimensional mode, using an ECAT EXACT HR+ scanner (Siemens/CTI). This scanner acquires 63 planes of data over an axial field of view of 15 cm. A 10-min transmission scan, using 3 rotating 68Ge line sources together with sinogram windowing, was performed after a short transmission scan for patient positioning. Subjects were constantly monitored with single-lead electrocardiography, and blood pressure was measured every 3 min.
After the transmission scan, 1,100 MBq H215O dissolved in 5 mL saline were injected intravenously by bolus injection, which was followed by a 40-mL saline flush at a rate of 4 mL/s. A dynamic scan was acquired consisting of 40 frames with variable frame length for a total time of 10 min (12 × 5 s, 12 × 10 s, 6 × 20 s, 10 × 30 s). Subsequently, blood-pool imaging was performed. During a 2-min period subjects inhaled at least 2,000 MBq C15O and a single frame was acquired for a 6-min duration, starting 1 min after the end of inhalation to allow for equilibration in the blood pool. During the C15O scan, 3 venous blood samples were drawn from the intravenous line and counted in a sodium iodide well counter cross-calibrated against the scanner. Equilibrium of C15O within blood was confirmed by comparison of the 3 decay-corrected blood samples (data not shown). Emission data were corrected for physical decay of 15O, dead time, scatter, randoms, and photon attenuation. Reconstruction of the H215O emission sinograms was performed using filtered backprojection (FBP) with a Hanning filter at 0.5 of the Nyquist frequency. Transmission and C15O sinograms were iteratively reconstructed using ordered-subset expectation maximization ([OSEM] CTI version 7.1.1; 2 iterations, 16 subsets). OSEM images underwent 5-mm full width at half maximum gaussian postsmoothing to ensure resolution matching (∼7 mm) between OSEM and FBP reconstructed images, as shown by Boellaard et al. (14)
Echocardiography.
All patients and control subjects underwent complete 2-dimensional and Doppler echocardiography to determine left ventricular and valve function. Standard parasternal and apical views were recorded on VHS videotape for subsequent off-line analysis.
Data Analysis
PET.
Data were transferred to a SUN workstation (SUN Microsystems Inc.) and analyzed using Siemens/CTI software. Anatomic tissue images were generated according to the procedure describes by Iida et al. (15) Briefly, blood volume images were normalized to the radioactivity in blood as measured from the samples. The reconstructed transmission data were normalized on a pixel-by-pixel basis to the average pixel counts in a region of interest (ROI) in the left ventricular chamber of the transmission image. Quantitative images of the ATF (mL/mL) were calculated taking into account the differences between the densities of blood and tissue.
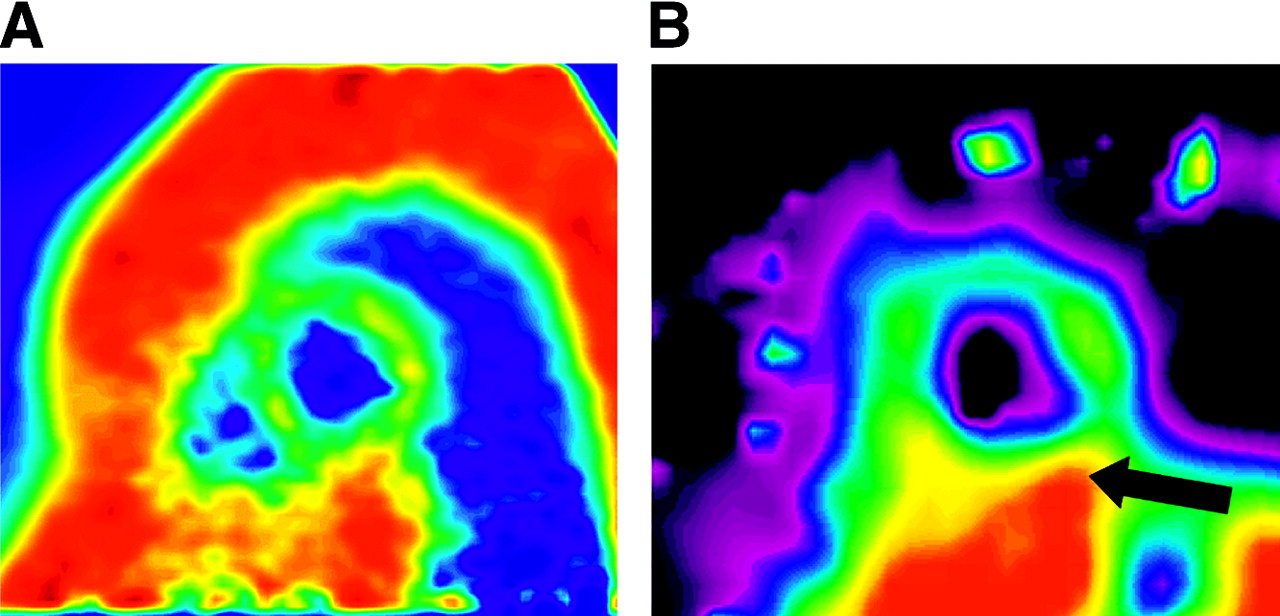
Transaxial ATF images of the left ventricle were reoriented according to the anatomic axis of the heart and slices were displayed as short-axis slices. The same reslicing parameters were applied to the dynamic H215O images. Figure 1A shows an ATF image from a healthy control subject. ROIs were defined manually at the basal and midventricular level of the left ventricle. Each basal and midventricular slice was divided in 6 equidistant sectors angulated 60° apart starting from the posterior insertion of the right ventricular free wall into the left ventricular myocardium. Corresponding ROIs from a variable number of slices were grouped in each patient to generate 12 volumes of interest (6 basal and 6 midventricular). The inferior volumes of interest were excluded from analysis because of anticipated PTF spillover effects from the liver. Figure 1B displays a parametric PTF image in short-axis view generated using a basis function method described by Lodge et al. (16), clearly demonstrating the inability to delineate the inferior wall from the liver. The apex was also excluded from analysis due to difficulty in delineating apical myocardium from adjacent structures on the ATF short-axis images in the patient group.

Short-axis ATF (A) and PTF (B) images of a healthy volunteer. Arrow in PTF image indicates inferior wall. Spillover effects from adjacent liver tissue are present.
Additional ROIs were defined in the left and right ventricular chamber. This set of ROIs was projected on the dynamic H215O images to generate image-derived input functions. Using the standard single-tissue compartment model together with these input functions, myocardial blood flow (MBF) (mL/min/mL of perfusable tissue) and PTF (mL/mL) were determined for all myocardial tissue time–activity curves (17,18). Corrections were made for spillover from both the left and the right ventricle using the method described by Hermansen et al. (19). As the resting MBF is related to the rate–pressure product (RPP = heart rate × systolic blood pressure), corrected resting MBF (MBF/RPP × 10,000) was also determined. Regional differences in the MBF and PTI were evaluated by grouping of volumes of interests such that the heart was divided into 3 segments (anterior, lateral, and septal). For assessment of heterogeneity, each of the 10 volumes of interest was used.
Echocardiography.
Left ventricular end-diastolic and end-systolic volumes were determined from apical 2- and 4-chamber views using the Simpson biplane formula according to the recommendations of the American Society of Echocardiography (20). The volumes were corrected for the body surface area. LVEF was calculated as follows: 100 × (end-diastolic volume − end-systolic volume)/end-diastolic volume.
Statistical Analysis.
Data are expressed as mean ± SD. For comparison of 2 datasets, the unpaired Student t test was performed. Comparison of multiple datasets was performed using ANOVA, and specific differences were identified by a Student t test corrected for multiple comparisons with the Bonferroni inequality adjustment. The Pearson correlation coefficient was used to investigate associations between study variables. Heterogeneity was expressed as the coefficient of variation (COV) (SD/mean). For graphical presentation of heterogeneity, both MBF and PTI measurements were corrected for intersubject variation by dividing the values of each volume of interest by the respective mean values for that patient, yielding normalized MBF and PTI data (21). Differences with a P value < 0.05 were considered statistically significant. All analyses were performed using SPSS version 9 (SPSS Inc.).
RESULTS
Healthy Control Group
PET data from the healthy control subjects and DCM patients are summarized in Table 2. With the exception of the PTF, all PET parameters were distributed homogeneously throughout the ventricular myocardium in the healthy control group. PTF values in the lateral segments were higher than those in the anterior segments (P < 0.05). The mean value for the PTI was 1.12 ± 0.10.
PET Data from Healthy Control Subjects and DCM Patients
DCM Group
MBF and ATF were distributed homogeneously in the DCM group. The PTF and PTI, however, demonstrated regional differences. The PTF was higher in the lateral segment compared with that in the septal segment (P < 0.01) and the PTI was higher in the lateral segment than that in the anterior and septal segments (P < 0.05). The mean value for the PTI was 0.91 ± 0.12.
DCM Patients Versus Control Subjects
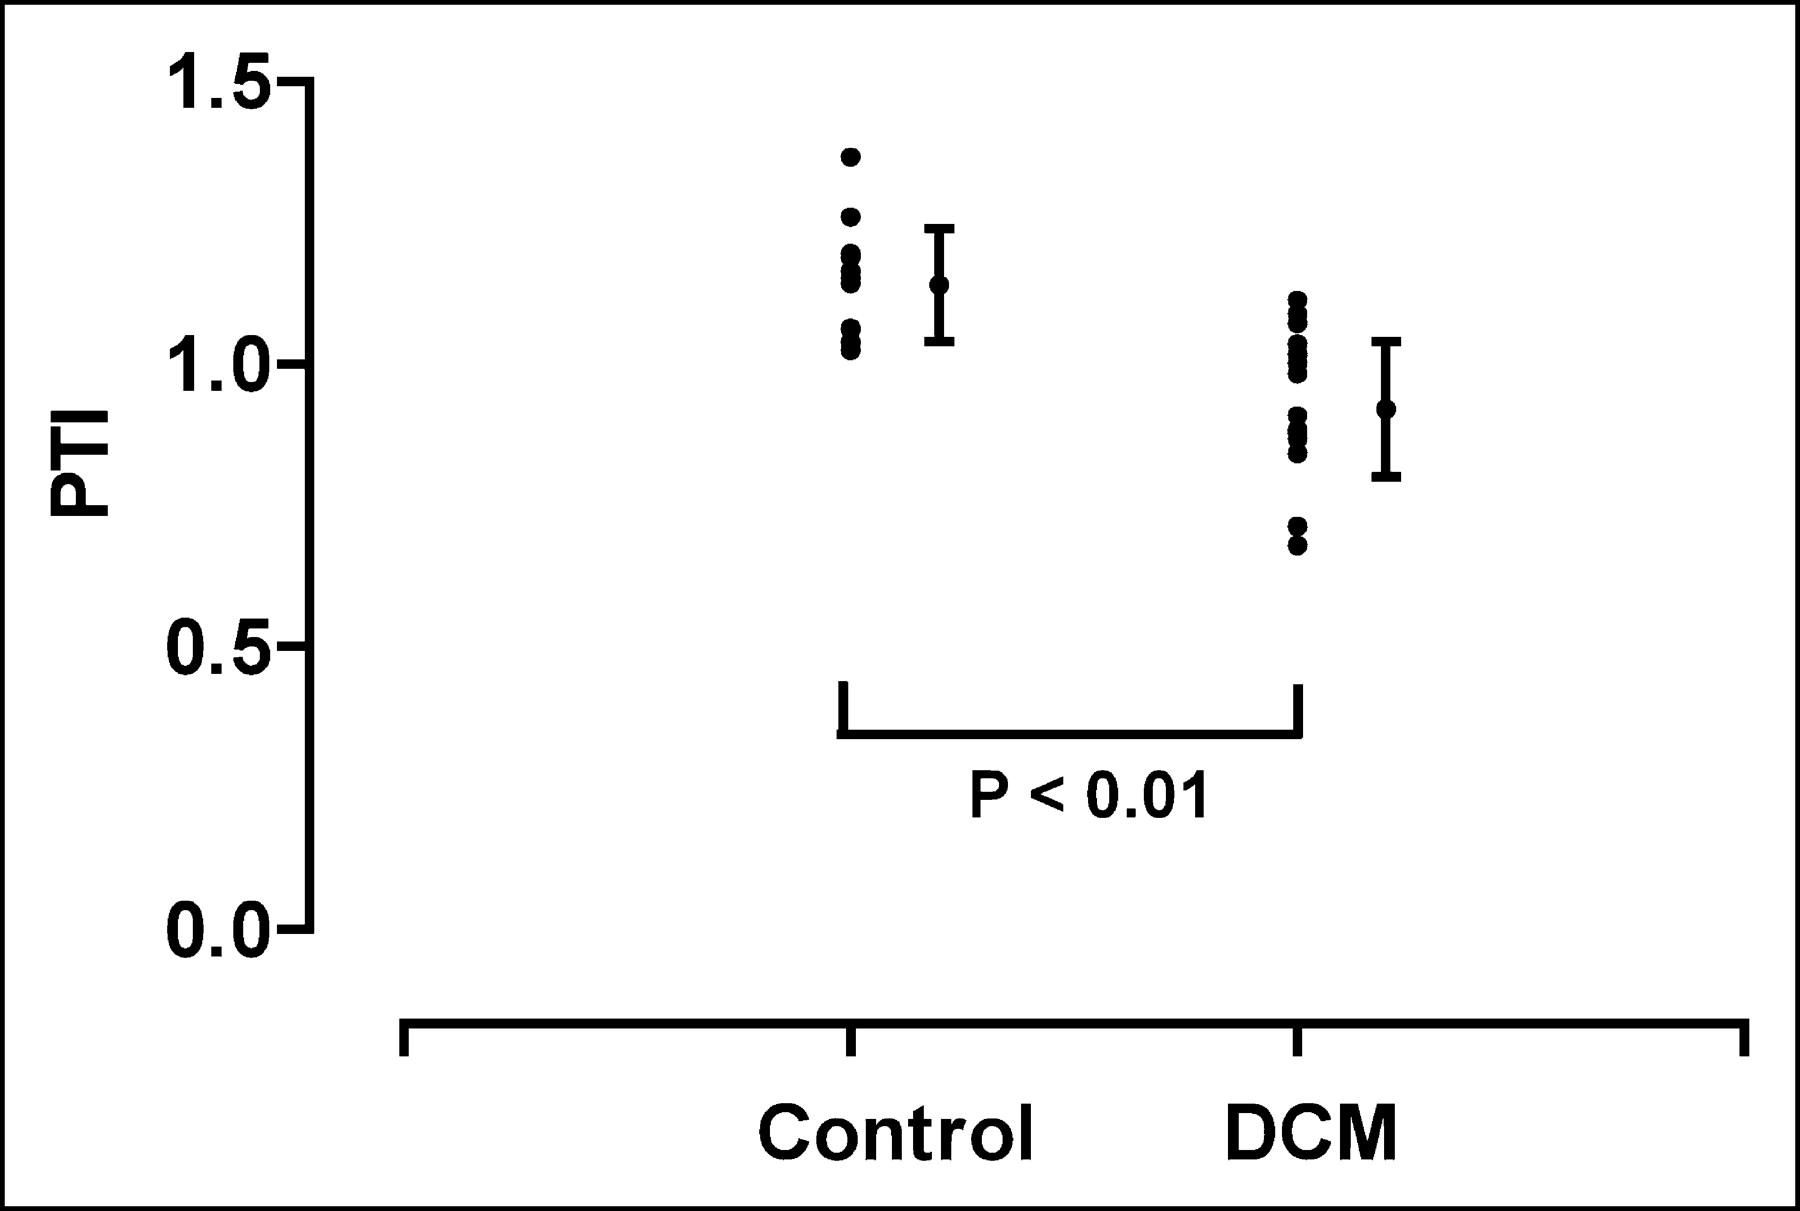
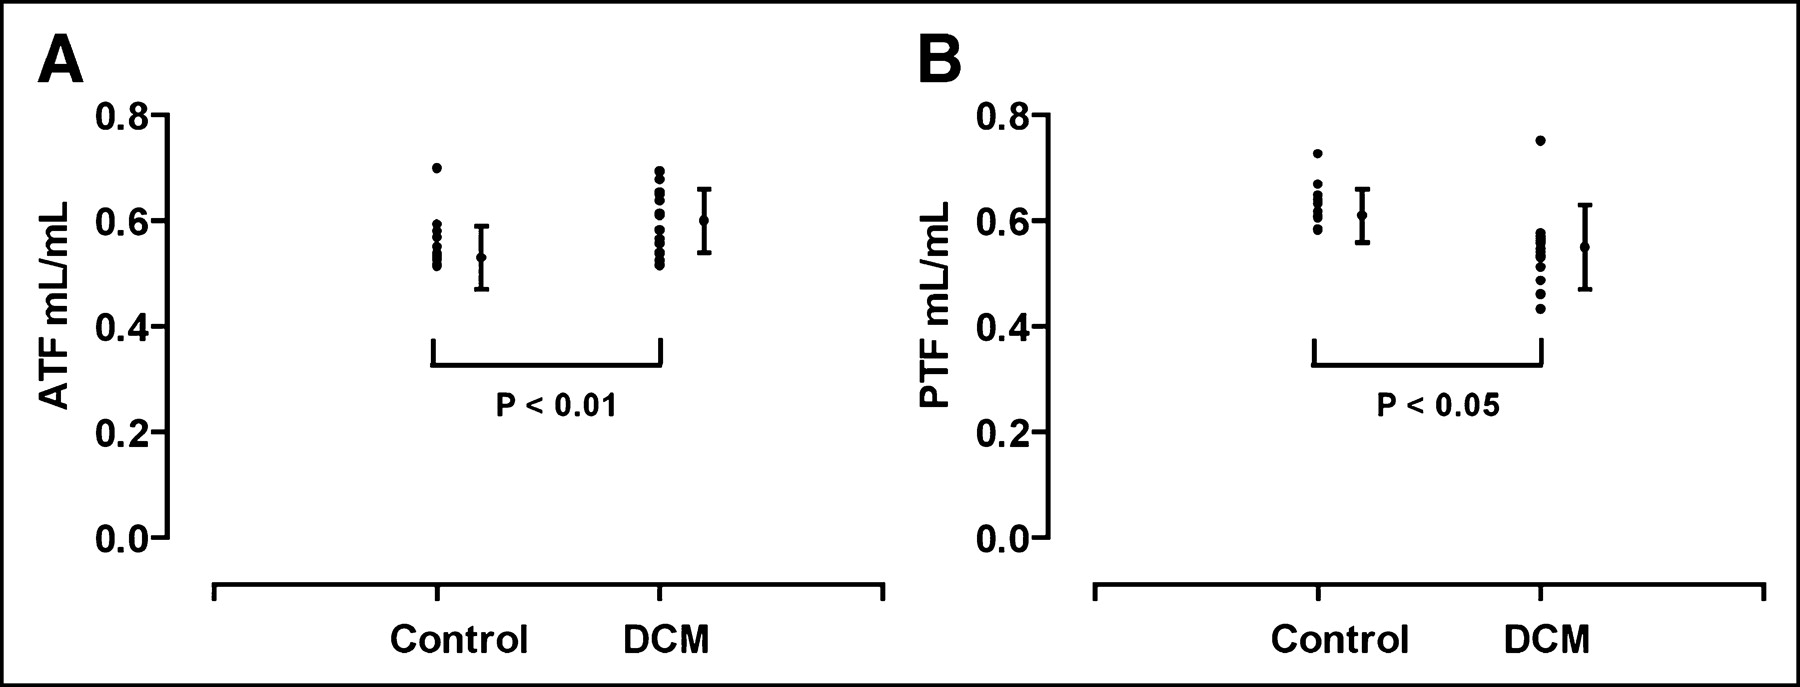
Comparison between DCM patients and the healthy control group demonstrated similar mean MBF values. Corrections for the RPP did not alter the results. The mean PTI was reduced in DCM patients (P < 0.01; Fig. 2) due to an increase in the mean ATF (P < 0.01; Fig. 3A) and a decrease in the mean PTF (P < 0.05; Fig. 3B) compared with that of healthy control subjects.

PTI for healthy control subjects and DCM patients.

ATF (A) and PTF (B) for healthy control subjects and DCM patients.
No correlation was found between the mean PTI and LVEF for healthy control subjects (r = −0.27; P = not significant [NS]) or DCM patients (r = 0.12; P = NS). The end-systolic volume index (EDVI), a measure of disease progression (1), did not correlate with the PTI either (r = −0.08; P = NS).
Heterogeneity
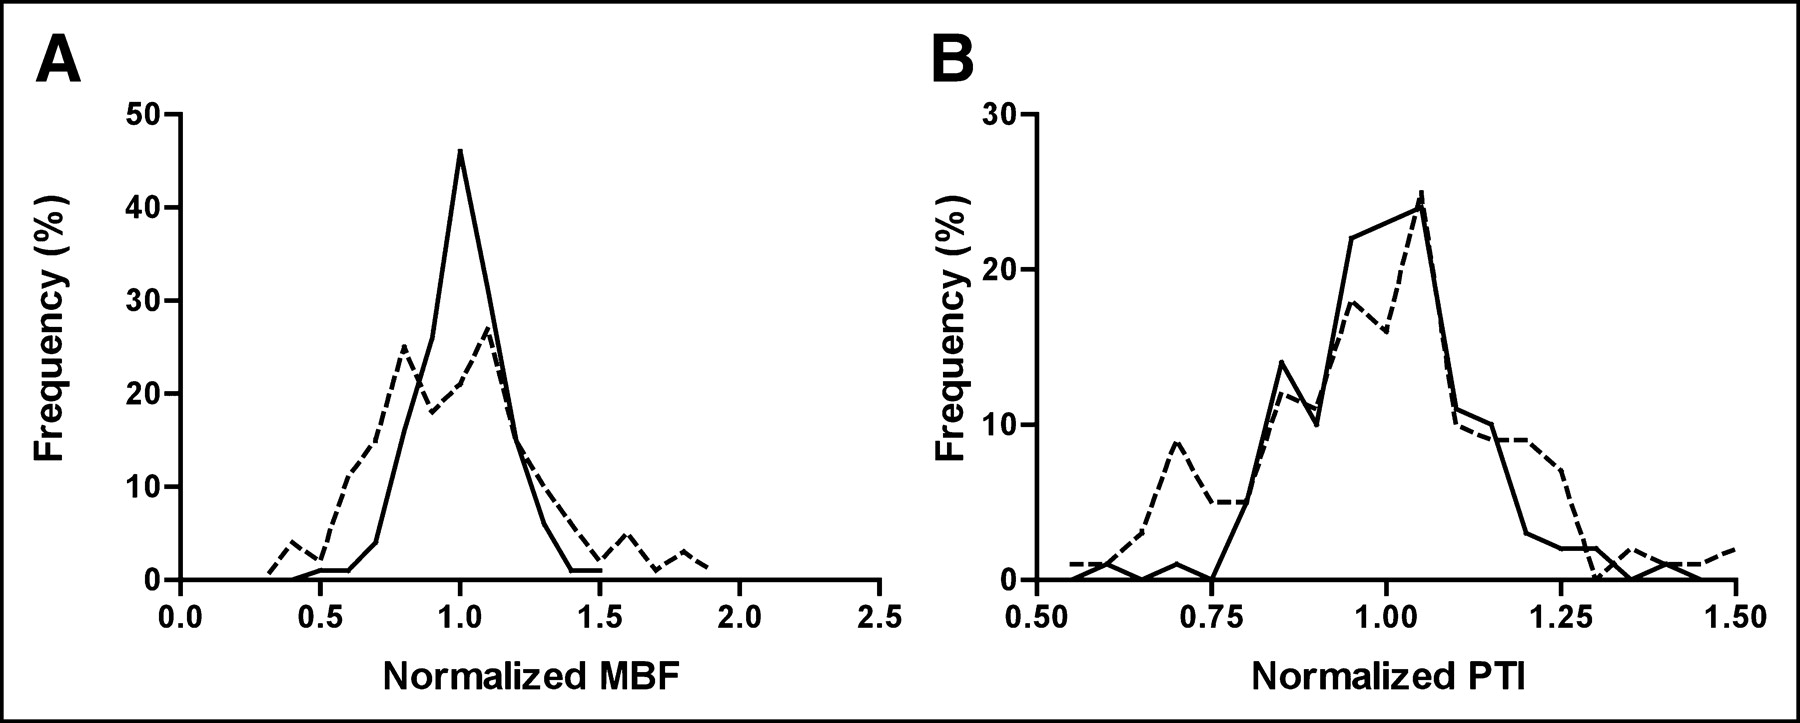
Table 3 shows COVs from PET data. Although segmental analysis of MBF by ANOVA did not reveal significant differences between the anterior, lateral, and septal segments in DCM patients (Table 2), the COV for the MBF determined from 10 myocardial segments in each subject was higher in DCM patients (P < 0.05; Fig. 4A). The PTF and PTI (P < 0.05; Fig. 4B) also demonstrated higher COVs in DCM patients than those in healthy control subjects. The COV for the ATF did not differ between groups.

Frequency distributions (percentage of left ventricle) of normalized MBF (A) and PTI (B) for both healthy control subjects (solid lines) and DCM patients (dashed lines). COVs were increased for MBF and PTI in DCM patients compared with COVs for control subjects, indicating increased heterogeneity (P < 0.05).
COVs from PET Data
DISCUSSION
The main finding of this study is that the PTI is reduced in patients with DCM. Interstitial and perivascular fibrosis, commonly found in this patient group (2–8), may be responsible for this reduction. This hypothesis is supported by the data of Iida et al. (13), who found a positive correlation between the reduction in the PTI and myocardial fibrosis after infarction in canine hearts. The range of PTI values observed in DCM overlapped with those observed in healthy control subjects. These results are in agreement with histopathologic findings in DCM, which show a varying degree of fibrosis ranging from mild to as much as 50% (3–5,7,8). Average values of fibrosis in DCM have been reported to be approximately 10%–20% (3–5,7,8), which is compatible with the reduction in the PTI seen in the present DCM population.
Healthy Control Group
Values for the MBF and PTI from the healthy control subjects are in line with previous studies (15,18,22). For normal human myocardium, the PTF is approximately 10% higher than the ATF because venous blood volume of the heart is included in this parameter (∼0.10 mL/g of net myocardium) (18,23). An expected value for the PTI is therefore close to 1.1 in normal myocardium (15,18,22). The only regional difference in PET data was a higher value of the PTF in the lateral segment compared with that of the anterior segment (P < 0.05). This could be due to ROI definition. The PTI, being the ratio of the PTF and ATF, is unaffected by these observer-dependent effects.
DCM Group
The ATF and MBF were distributed homogeneously in the DCM group, although the latter showed a trend toward a lower MBF in the septal region. In addition, heterogeneity expressed as COV was higher in DCM than that in control subjects. This may be explained by the observation that in advanced stages of DCM some form of intraventricular conduction delay is often present, which in turn is associated with a reduced septal MBF (24). Furthermore, heterogeneity in regional myocardial function and oxygen consumption has been noted in these patients (25). This also might lead to heterogeneity in perfusion by means of autoregulatory mechanisms of the microvascular bed in response to varying demand.
Regional differences were found for the PTF with the lateral value being higher than the septal value (P < 0.01) and for the PTI with the lateral value being higher than the anterior and septal value (P < 0.05). Both of these parameters also demonstrated increased COV compared with that of control subjects (Table 3). Differences in regional distribution of the PTI may reflect regional differences in myocardial fibrosis. This is supported by previous studies demonstrating heterogeneity in distribution of fibrosis in DCM (3,4,7). The mean PTI was lower in DCM compared with that of healthy control subjects due to both a higher ATF and a lower PTF. Both PTF and ATF are dependent on the physical dimensions of the heart wall (partial-volume effect), motion of the heart, and ROI size (15,18). The PTF is also dependent on the physiologic properties of the myocardial tissue contained within the ROI—that is, the ability to exchange water. In line with necropsy findings (2), wall thickness of the myocardium was similar for DCM patients and healthy control subjects (Table 1) and therefore cannot explain differences between groups with regard to the ATF and PTF. Reduced contractility of the heart will result in higher ATF and PTF values, because of less “smearing” of the signal within the ROI during the cardiac cycle. This would explain the higher ATF values. Fibrosis is probably responsible for the lower value of the PTF, as fibrotic tissue is not able to exchange water rapidly (13).
Because the PTI equals the ratio of the PTF and ATF, this measurement is independent of partial-volume effects, motion of the heart, and ROI definition. The PTI reflects only that portion of the myocardium able to exchange water rapidly—that is, perfusable tissue.
Correlation Between PTI and LVEF
There was no correlation between the LVEF and PTI in either the patient or the control group. Although myocardial dysfunction in DCM is caused by myocyte pathology (e.g., energy compromise, mutation-induced alterations in myofibrillar calcium sensitivity) (26), it can be hypothesized that an increase in interstitial and perivascular fibrosis is accompanied by a decline in myocardial function. Previous studies investigating this relationship showed conflicting results, varying from no correlation (9,10,27) to a weak correlation (4,5,11). Comparison between these studies is difficult because study populations were inhomogeneous and none of the studies was able to accurately quantify myocardial fibrosis. Furthermore, no data are available on the relation between function and fibrosis on a regional level. The latter is especially interesting, as fibrosis and function are not always distributed homogeneously (3,4,7,25).
The present study population was relatively small and only patients with an advanced stage of DCM were included. A wider range of disease stages might be necessary to establish a relationship between the PTI and function. Further studies must be conducted with special emphasis on the relation between regional contractile function and fibrosis.
Recently, an alternative method for noninvasive assessment of myocardial fibrotic tissue has emerged using gadolinium-delayed-enhanced cardiovascular MRI (CMR-DE) (28). This technique has proven to give accurate measurements of scar tissue size after myocardial infarction (29). CMR-DE, however, is sensitive to regional differences in gadolinium accumulation rather than an overall increase because it depends on using remote normal myocardium as a reference (30). Diffuse microscopic fibrosis seen in DCM patients, therefore, can generally not be detected by CMR-DE (31).
Limitations
In this study no histologic samples by endomyocardial biopsy were obtained; therefore, there is no evidence that the reduction of the PTI in patients with DCM actually represents myocardial fibrosis. As a biopsy is an invasive procedure with associated complications (32), it was not included in the present study protocol. In addition, biopsy is subjected to sampling error and only provides endomyocardial information on a very limited regional level. The first aim of the study was to verify whether the PTI would be altered at all. Having demonstrated a reduction, future studies need to compare the PTI and histologic samples directly, especially because Herrero et al. (33) have suggested that the PTI may be affected by perfusion heterogeneity.
Furthermore, the healthy volunteers were not age matched. Advanced age is accompanied by a slight increase in myocardial fibrosis and, therefore, a possible reduction in the PTI (34,35). Previous studies, comparing the PTI between healthy volunteers and patients with myocardial infarction (12,15) had a similar age difference between groups. In those studies, the PTI did not differ between healthy volunteers and the normal contractile remote myocardium of patients. Therefore, the influence of aging on the PTI may be limited.
CONCLUSION
The PTI offers the possibility of noninvasively quantifying myocardial fibrosis at a regional level. In patients with an advanced stage of DCM, the PTI is significantly reduced compared with that of healthy control subjects. In these patients the degree of fibrosis as determined by the reduction of the PTI was highly variable, both on a regional level and between patients. The exact relationship between regional fibrosis and function as well as the effects of fibrosis on prognosis need to be elucidated.
Footnotes
Received Nov 26, 2003; revision accepted Jan. 26, 2004.
For correspondence or reprints contact: Paul Knaapen, MD, Department of Cardiology, 6D Room 120, VU University Medical Center, De Boelelaan 1117, 1081 HV Amsterdam The Netherlands.
E-mail: p.knaapen{at}vumc.nl
REFERENCES


Jump to section
Related Articles
Cited By...
- Quantitative Perfusion Imaging with Total-Body PET
- Experimental Pig Model of Old Myocardial Infarction with Long Survival Leading to Chronic Left Ventricular Dysfunction and Remodeling as Evaluated by PET
- Parametric Images of Myocardial Viability Using a Single 15O-H2O PET/CT Scan
- Effects of Hepatic Triglyceride Content on Myocardial Metabolism in Type 2 Diabetes
- Assessment of Nonischemic Myocardial Fibrosis
- Altered Myocardial Substrate Metabolism and Decreased Diastolic Function in Nonischemic Human Diabetic Cardiomyopathy: Studies With Cardiac Positron Emission Tomography and Magnetic Resonance Imaging
- The Future of Cardiovascular Imaging in the Diagnosis and Management of Heart Failure, Part 1: Tasks and Tools
- Cardiovascular Magnetic Resonance, Fibrosis, and Prognosis in Dilated Cardiomyopathy
- Delayed Contrast Enhancement and Perfusable Tissue Index in Hypertrophic Cardiomyopathy: Comparison Between Cardiac MRI and PET