


Abstract
The challenge of sampling blood from small animals has hampered the realization of quantitative small-animal PET. Difficulties associated with the conventional blood-sampling procedure need to be overcome to facilitate the full use of this technique in mice. Methods: We developed an automated blood-sampling device on an integrated microfluidic platform to withdraw small blood samples from mice. We demonstrate the feasibility of performing quantitative small-animal PET studies using 18F-FDG and input functions derived from the blood samples taken by the new device. 18F-FDG kinetics in the mouse brain and myocardial tissues were analyzed. Results: The studies showed that small (∼220 nL) blood samples can be taken accurately in volume and precisely in time from the mouse without direct user intervention. The total blood loss in the animal was <0.5% of the body weight, and radiation exposure to the investigators was minimized. Good model fittings to the brain and the myocardial tissue time–activity curves were obtained when the input functions were derived from the 18 serial blood samples. The R2 values of the curve fittings are >0.90 using a 18F-FDG 3-compartment model and >0.99 for Patlak analysis. The 18F-FDG rate constants  ,
,  ,
,  , and
, and  , obtained for the 4 mouse brains, were comparable. The cerebral glucose metabolic rates obtained from 4 normoglycemic mice were 21.5 ± 4.3 μmol/min/100 g (mean ± SD) under the influence of 1.5% isoflurane. By generating the whole-body parametric images of
  (mL/min/g), the uptake constant of 18F-FDG, we obtained similar pixel values as those obtained from the conventional regional analysis using tissue time–activity curves. Conclusion: With an automated microfluidic blood-sampling device, our studies showed that quantitative small-animal PET can be performed in mice routinely, reliably, and safely in a small-animal PET facility.
In recent years, novel preclinical research programs have been developed to accelerate the transfer of findings from laboratory to clinical application. Highly targeted biomedical research has led to the creation of animal models such as transgenic mice. Researchers have been seeking new tools to monitor disease progression and to predict clinical outcome using these models. Small-animal PET can generate whole-body images that allow researchers to visualize the physiologic and biochemical processes in vivo in a living animal. When integrated with a mathematic model and a blood time–activity curve, PET is a powerful tool to quantify physiologic or metabolic processes in vivo (1,2). To enable the routine use of “quantitative” small-animal PET, there are difficulties that need to be overcome. At present, 3 major challenges in performing quantitative PET studies in mice are (i) derivation of the input function, (ii) performance of tracer kinetic modeling, and (iii) the specific activity of a tracer that limits the amount of radioactivity that can be injected. We have developed previously a user-friendly, JAVA-based application software, Kinetic Imaging System (KIS) (3). KIS allows investigators without extensive background in kinetic modeling or skills in computer programming to analyze PET data quantitatively through the Internet (http://dragon.nuc.ucla.edu/kis/index.html). Our next challenge was an innovation that could simplify the blood-sampling procedure.
Although various alternatives, such as β-probe and arteriovenous bypass, have been attempted to avoid blood sampling in small animals, these techniques involved complicated microsurgery and lacked temporal resolution (4). Replacing blood samples with a left ventricle (LV) image-derived blood curve is an attractive option (2,5). Using the current generation of small-animal PET whole-body scanners, we found that the LV blood pool was too small to be used to derive a reliable input function unless the body movements and the spillover activities were minimized (6). At present, many researchers use the blood-sampling techniques originally developed for human and large-animal PET studies (7,8). These procedures are cumbersome and expose personnel to high doses of radiation for a high-throughput, small-animal PET facility. Additionally, these procedures require blood samples with volumes in the range of several microliters and, as a result, the animals were often studied under nonphysiologic conditions.
The concept of a “lab-on-a-chip” has greatly promoted the application of nanotechnology in laboratories and hospitals in recent years (9). Among these miniature platforms, the microfluidic devices are attractive because they offer many advantages, such as low cost, small volume, short reaction time, parallel operations, and easy automation (10,11). These characteristics offer a great opportunity to overcome the difficulties of repeated blood sampling and to reduce the total blood loss in an animal. Therefore, we have developed an automated blood-sampling system based on the microfluidic technology by taking the following factors into consideration: (i) The blood loss should be small so the physiologic state of the animal is not disturbed. (ii) The dead space between the arterial cannula and the blood-sampling device needs to be small to minimize the delay and dispersion of a blood curve. (iii) A young or small animal has a rapid metabolism and requires blood samples to be taken at a high frequency. (iv) For the individual who performs the blood-sampling procedure, radiation exposure needs to be minimized in a high-throughput, small-animal PET facility. The usefulness of our new device was demonstrated by performing quantitative mouse PET studies with 18F-FDG. In addition, we performed a set of mouse studies to obtain the 18F-FDG ratio curve of the whole blood to plasma. This procedure was necessary because of the relatively slow transport of 18F-FDG across the membrane of the red blood cells in mice (12,13). We performed 18F-FDG kinetic analysis using the 3-compartment 18F-FDG model and the Patlak analysis. 18F-FDG was chosen in this study to serve as the prototype for a proof of principle. Our goal was to simplify and automate the blood-sampling procedure in mice, so that quantitative small-animal PET can be performed routinely, reliably and safely in a small-animal PET facility.
MATERIALS AND METHODS
Fabrication of Microfluidic Blood-Sampling Device
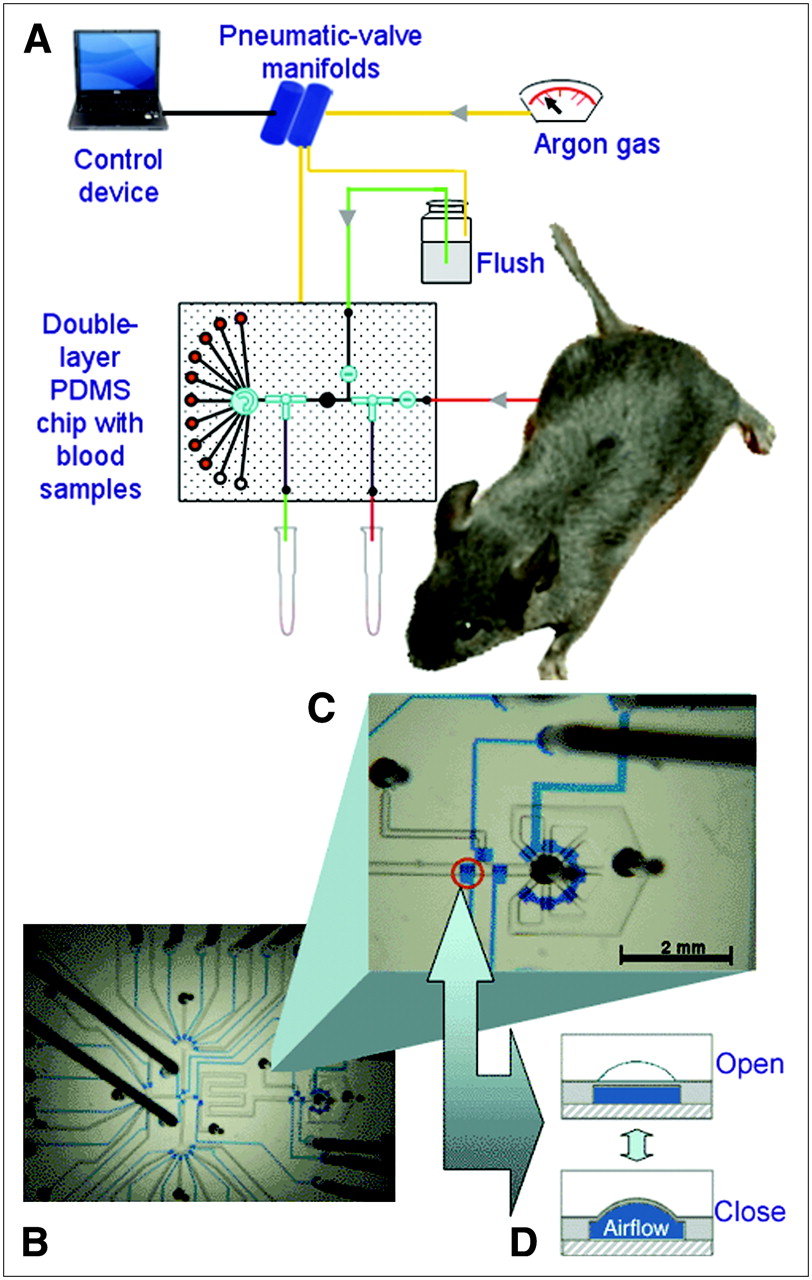
The microfluidic blood-sampling device consists of a 2.54 × 3.81 cm poly(dimethylsiloxane) (PDMS) chip, a vial with heparin block solution, and a control system (Fig. 1A). There are 2 major layers in the PDMS chip. The 5-mm-thick fluidic layer contains a blood inlet, a blood outlet, a heparin block inlet, a heparin block outlet, a blood reservoir (∼220 nL), and 18 sample wells (Fig. 1B). These components are connected with 200-μm-wide channels. Underneath the fluidic layer is a thin control layer with twenty-seven 150-μm-wide channels. Each channel has a 250-μm valve in the end. These valves intersect the channels in the fluidic layer and serve as a 3-way switch or an on/off switch by opening or closing several valves simultaneously (Fig. 1C) (14). The flows of blood and heparin block solution within the chip are controlled by the status of these switches. The chip was fabricated with PDMS (GE RTV 615; Circuit Specialists Inc.) using a multilayer soft lithography method (10,15). The fabrication procedure has been described in detail for a different device (11). In brief, the mold carrying the pattern of the fluidic layer was made by curing a 45-μm positive-photoresist AZ 50XT (Mays Chemical) on a silicon wafer (Silicon Quest) with a single photolithographic process; the mold carrying the pattern of the control layer was made by curing a 25-μm negative-photoresist SU8–2025 (MicroChem) in a similar procedure. PDMS were laid on the molds to copy the fluidic or control layer pattern and cured in an oven at 80°C. The 2 layers of PDMS were bonded together by remaining in the oven for 1 h. The chip was then bonded to a glass support with a thin layer of PDMS in between. The final chip assembly was left in the oven overnight before use.

Overview of microfluidic blood-sampling device. (A) Cartoon demonstrates concept of our microfluidic chip design and connections of the chip to its operational environment. Black lines drawn in chip are channels of the fluidic layer. Blue switches drawn in control layer control blood flow and heparin flush within fluidic channels. There is one on/off switch (circle with minus sign), two 3-way switches (T shape), and one 18-way switch (circle with arrow). There are 18 blood-sample channels (black lines with red wells), although only 11 channels are drawn in cartoon. (B) Picture shows actual PDMS chip with design implemented. Control channels are filled with blue dye. Black metal pins connect control channels to pneumatic-valve manifolds through microbore tubing (not in field of view). Connections are shown as yellow line in cartoon. (C) Picture shows small portion of PDMS chip. Ten valves in end of control channels are the actual parts that perform the functions of an on/off switch and a 3-way switch shown in cartoon. (D) Drawing demonstrates mechanism of how a valve in control channel controls liquid flow in a fluidic channel.
The control system consists of 4 sets of 8-channel manifolds (Fluidigm) connected to a 99.998%-purity argon gas tank and a laptop with LabVIEW (National Instruments) program through a BOB3 breakout controller board and an AT-DIO-32HS card (National Instruments). The vial containing the heparin block and the channels in the control layer of the PDMS chip are individually connected to the manifolds with a Tygon microbore tubing (Cole-Parmer) through a 23-gauge metal pin (New England Small Tube Corp.). When a pneumatic valve on the manifold is activated by computer control through a LabVIEW program, the argon gas at 155 cm Hg enters the specific channel of the PDMS chip and actuates the valve in the end (Fig. 1D). The on/off status of a switch is controlled by simultaneous actuations of the corresponding valves. The timing and the actuations are controlled by the LabVIEW program.
Animal Preparation
All animal experiments were conducted in compliance with the Animal Care and Use Program established by the Chancellor's Animal Research Committee of University of California at Los Angeles (UCLA). The animals were bred and kept in a sterilized environment at the UCLA Oncology vivarium until the day of the study. Ten male, C57BL/6 mice (21–42 g) were studied. Food and water were removed from the mouse cage 30 min before the study. Four mice underwent quantitative PET and 6 mice were studied to evaluate the 18F-FDG concentration in the whole blood and the plasma after 18F-FDG injections.
Small-Animal PET Studies
Four mice (CL57/BL6; male, 25–26 g) were studied. The mouse was first anesthetized with 2% isoflurane. An ∼1-cm skin incision was made over the right femoral artery. A PE 10 polyethylene tubing filled with heparinized saline was placed into the artery and secured. The wound was closed with a USP 4-0 silk suture (Harrell Medical). The mouse was secured in a custom-designed acrylic retraining chamber and placed in the PET scanner (microPET Focus 220; Siemens Medical Solutions USA, Inc.). The body temperature was maintained at 35°C by a heating bed within the chamber. The mouse was kept under anesthesia with 1.5% isoflurane via a nose cone during the scan. A microfluidic chip was placed next to the right leg of the mouse. The catheter connected to the femoral artery was cut ∼5 cm in length from the proximal end and connected to the blood inlet of the PDMS chip through a 23-gauge metal pin. The blood flow was controlled by a 3-way switch next to the blood inlet. A 29-gauge needle with 3 cm of PE 20 tubing was placed into a tail vein of the mouse for 18F-FDG injection. Each sample well in the PDMS chip was individually connected to a well-counter tube with a microbore tubing and a metal pin.
We initiated the PET acquisition and the blood sampling 3 s before the 18F-FDG injection. A bolus of 9–18 MBq of 18F-FDG in ∼60 μL of saline was injected through the tail vein catheter. The list-mode PET data were collected for 60 min. The blood-sampling procedure was automated by a LabVIEW program without user intervention once it was initiated. Before a blood sample was taken, fresh blood flowed through the chip continuously. An exact volume of blood in the reservoir was then flushed into a designated sample well by the heparin lock flush. These steps were repeated for the first 8 samples at predetermined time sequences: 1.5 s apart for the first 5 samples and 2.5 s apart for the next 3 samples. For all subsequent samples, the blood outlet was opened to remove the blood in the dead space (i.e., the tubing space between the proximal end of arterial catheter and the blood inlet [∼7 μL]) before the fresh blood flowed into the blood reservoir. Typical time intervals for the subsequent blood samples were 30 s for 1 sample, 60 s for 2 samples, 180 s for 3 samples, 360 s for 1 sample, and 900 s for 3 samples. At the end of the scan, blood samples in the PDMS chip were flushed into well-counter tubes with heparin block solution.
After the PET scan, the arterial catheter was disconnected from the PMDS chip, and a small drop of the blood sample was placed on a test strip of the blood glucose analyzer (FreeStyle; TheraSense, Inc.). Glucose concentration was recorded and converted to μmol/dL. In addition, an ∼25-μL blood sample was taken from the catheter manually for quality assurance purposes. The arterial catheter was sealed immediately with a glue gun to prevent blood loss. The chamber with the mouse was removed from the PET scanner and placed into a small-animal CT scanner (microCAT; Imtek Inc.). A 10-min whole-body CT scan was acquired for the purpose of attenuation correction (16). During the microCT scan, the mouse was kept at the same temperature and under the same anesthetic as in the PET scan.
18F-FDG activities in the blood samples were measured by a well counter (Cobra II Auto Gamma; Packard Instrument Co.). The manually drawn blood sample was weighed (±0.0001 g) and the 18F-FDG activity was measured. The counting rates measured by the well counter were converted to the PET equivalent counts (counts/s/pixel) using a conversion factor from a weekly phantom cylinder study.
Reconstruction of PET Images
The dynamic PET images in a 128 × 128 matrix (95 planes; pixel size: 0.4 mm; plane thickness: 0.8 mm; frame rates: 10 × 1 s, 1 × 2 s, 1 × 4 s, 1 × 6 s, 1 × 15 s, 2 × 30 s, 1 × 60 s, 1 × 120 s, 3 × 180 s, 5 × 550 s, and 1 × 33 s) were reconstructed using the filtered backprojection algorithm. The reconstruction used the microPET Manager (Siemens Medical Solutions USA, Inc.) run on a personal computer (Xeon Duo central processing unit; Dell; 3.20 GHz). The dead-time, scatter, and radiation-decay corrections were performed using software provided by the vendor. The photon attenuation was corrected using a CT-based method (16). The images had resolutions (full width at half maximum) of 1.75 mm at the center of the field of view.
Evaluation of 18F-FDG Ratios of Plasma to Whole Blood
Six mice (CL57/BL6; male, 21–42 g) were studied. Each mouse was anesthetized with 1.5%–2% isoflurane. The tail vein catheter was implemented as described in the previous section. A bolus of 7.5 MBq of 18F-FDG in ∼60 μL of saline was injected into the tail vein through the catheter. Two or 3 blood samples (∼70 μL each) were taken manually from the LV by direct cardiac puncture immediately after 18F-FDG injection. Two to 5 additional blood samples were taken subsequently at different time intervals up to 60 min after injection. The blood sample was placed immediately on ice, and a 15-μL aliquot was dispensed into a well-counter tube. The remaining blood was centrifuged immediately for 2 min at 3,000 rpm in a microcentrifuge (ADAMS Compact II; Beckton Dickinson), and 15 μL of plasma were dispensed into a well-counter tube. The whole-blood and plasma samples were weighed (±0.0001 g) and the 18F-FDG activities were measured. The ratios of plasma to whole blood ( ) of the counting rates (counts/min/mL) were calculated at each sampling time t. The ratios from the 6 mice were pooled and fitted with an exponential equation:
 Eq. 1where t is the blood-sampling time in minutes after the 18F-FDG injection; a, b, and c are constants.
Estimation of 18F-FDG Kinetics
The 18F-FDG activities ( ) in plasma samples—the so-called “input function”—were derived from the 18F-FDG activities (
 ) in the 18 whole-blood samples using Equation 2:
 Eq. 2where
  was calculated by using Equation 1 and the a, b, and c values (i.e., Eq. 5) obtained from the 6 mouse studies, and t is the sample time of each whole-blood sample. The time delay of the input function was corrected by measuring the dead space (μL) and the blood flow (μL/s) to the chip. To derive tissue time–activity curves, the 3-dimensional regions of interest (ROIs) were determined in a summed image (frames 25 and 26 of the dynamic images) using a public domain image-processing tool, AMIDE (17). In this study, we drew ROIs (140 and 70 mm3, respectively) in the whole brains and the lateral myocardial tissues to demonstrate the feasibility of performing quantitative studies in mice. The time–activity curves of the 2 tissues were generated by superimposing the ROIs to the reconstructed dynamic images.
The 18F-FDG kinetics in the whole brain and myocardial tissues were estimated using the quantitation tools in KIS (3). The 3-compartment 18F-FDG model and the Patlak graphical analysis were used (8,18,19). With a tissue time–activity curve and an input function, the compartmental model estimated the rate constants of 18F-FDG transport (i.e.,  (mL/min/g) and
  (min−1) for inward and outward transportations across the capillary membrane, respectively), phosphorylation and dephosphorylation (i.e.,
  (min−1) and
  (min−1) for hexokinase and glucose-6-phosphatase, respectively). The uptake constant of 18F-FDG (
 ; mL/min/g) can be calculated using Equation 3. The Patlak graphical analysis estimates, separately, the
  of a tissue by assuming a negligible amount of glucose-6-P phosphatase (19). Therefore, we estimated the
  value by using the PET data acquired at 3–22 min to minimize the effect of ignoring the glucose-6-P phosphatase activity when the Patlak analysis was used (20). The glucose metabolic rates (
 ; μmol/min/100 g) can be calculated by using Equation 4 if the lumped constant (LC) of a specific tissue and the glucose concentration (
 ; μmol/dL) in plasma are known. In this study, we used a LC value of 0.625 for the brain tissue (21,22):
 Eq. 3
Eq. 3 Eq. 4
Eq. 4

RESULTS
Quality Assurance of Blood-Sampling Device
Figure 1 shows an overview of the microfluidic blood-sampling device we developed. The operation is user-friendly and the sampling schedule is easy to be reprogrammed. Using a 18F-FDG solution (3.6 MBq in 2 mL saline) with 21-cm Hg argon pressure to simulate the blood flow, the system took 18 samples in 27 s with 1.6% variation. For 4 mouse studies, the counting rates of the extrapolated 18F-FDG blood curves matched well the manually drawn blood samples taken right after the PET scans. The percentage differences are 0.5%, 7.9%, 7.9%, and 7.5%.
Quality of Blood Curves
The color images in Figure 2A show a typical set of dynamic sequences of mouse images after a 18F-FDG bolus injection. In 2 s, the 18F-FDG bolus passed through the vena cava, right ventricle, lung, LV, and aorta and entered the blood circulation. Figures 2B and 2C show a blood curve derived from an 8-mm3 ROI of the LV (as shown in the image labeled “LV” in Fig. 2A) and a blood curve derived from the 18 femoral artery blood samples. As expected, the LV-derived blood curve was underestimated by ∼30% due to the partial-volume effect, which is easily seen in the 20- to 30-s data, and a large amount of spillover activity due to the high myocardial 18F-FDG uptake. The blood-sample curve derived from the 18 femoral artery samples had an initial peak and a clearance curve as expected (Fig. 2B). However, the blood-sample curve had a broader peak compared with the LV curve due to tracer dispersion (Fig. 2C). The peak of the blood-sample curve matches better with the time when the 18F-FDG bolus traveled through the descending aorta (Fig. 2A). These results are consistent among the 4 PET studies. Figure 3A shows both the blood-sample curve and the late blood sample that was manually drawn after a PET scan. The blood counts of the manually drawn blood sample matched closely with the counts extrapolated from the blood curve. Figure 3B shows a similar pattern among the 4 blood curves from the 4 mouse studies.
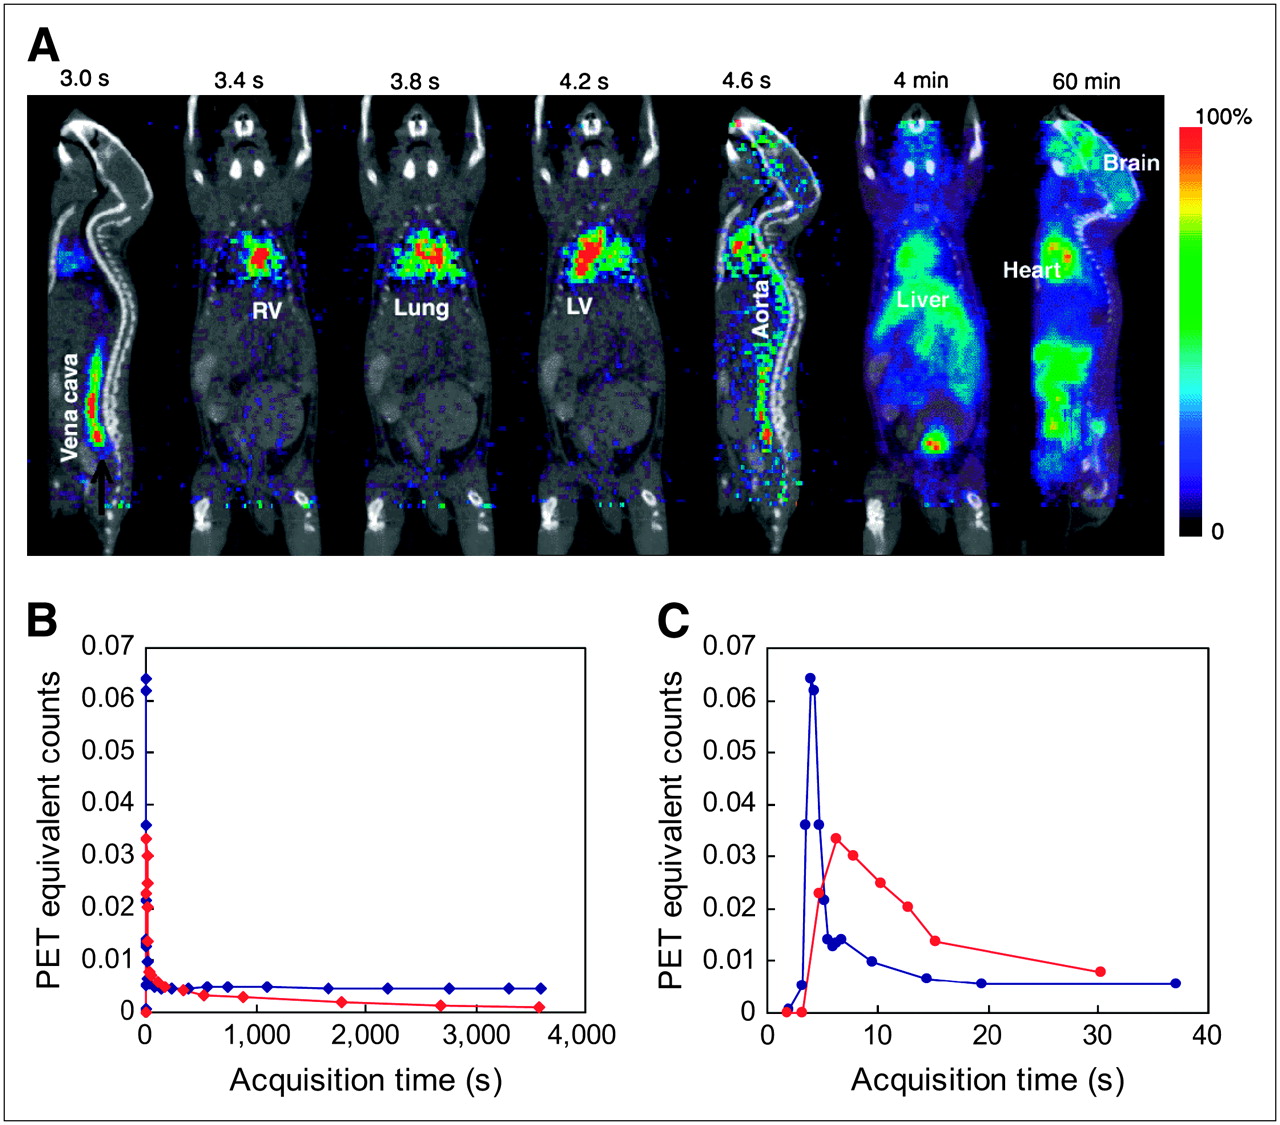
(A) Dynamic sequence of mouse images from 60-min 18F-FDG study. 18F-FDG bolus was injected 3 s after image acquisition was initiated. Images were superimposed with a microCT image shown in black and white. (B) Blood curve in blue was derived from dynamic images using a small (8 mm3) ROI drawn on LV (image labeled “LV” in A). Blood curve in red was derived from 18 femoral artery blood samples (red dots) taken by microfluidic blood sampler. (C) First 30-s data of LV blood curve and blood sample curve shown in B. Note that peak of femoral artery curve matches well with the time when 18F-FDG bolus arrived at descending aorta (image labeled “Aorta” in A).

(A) Typical set of blood data from a mouse study. Open circle is blood sample manually taken after PET scan. Solid circles are blood samples taken by microfluidic blood-sampling device. Dashed line is curve extrapolated from the last 3 blood samples using an exponential function. (B) Four blood curves obtained from 4 micro-PET studies. For comparison, blood curves were normalized to blood counts of the 18th blood samples to account for differences in injection dose (9–18 MBq). Logarithmic scale was used for better visual comparison of the 4 peaks.
18F-FDG Ratios in Whole Blood and Plasma After Bolus Injection
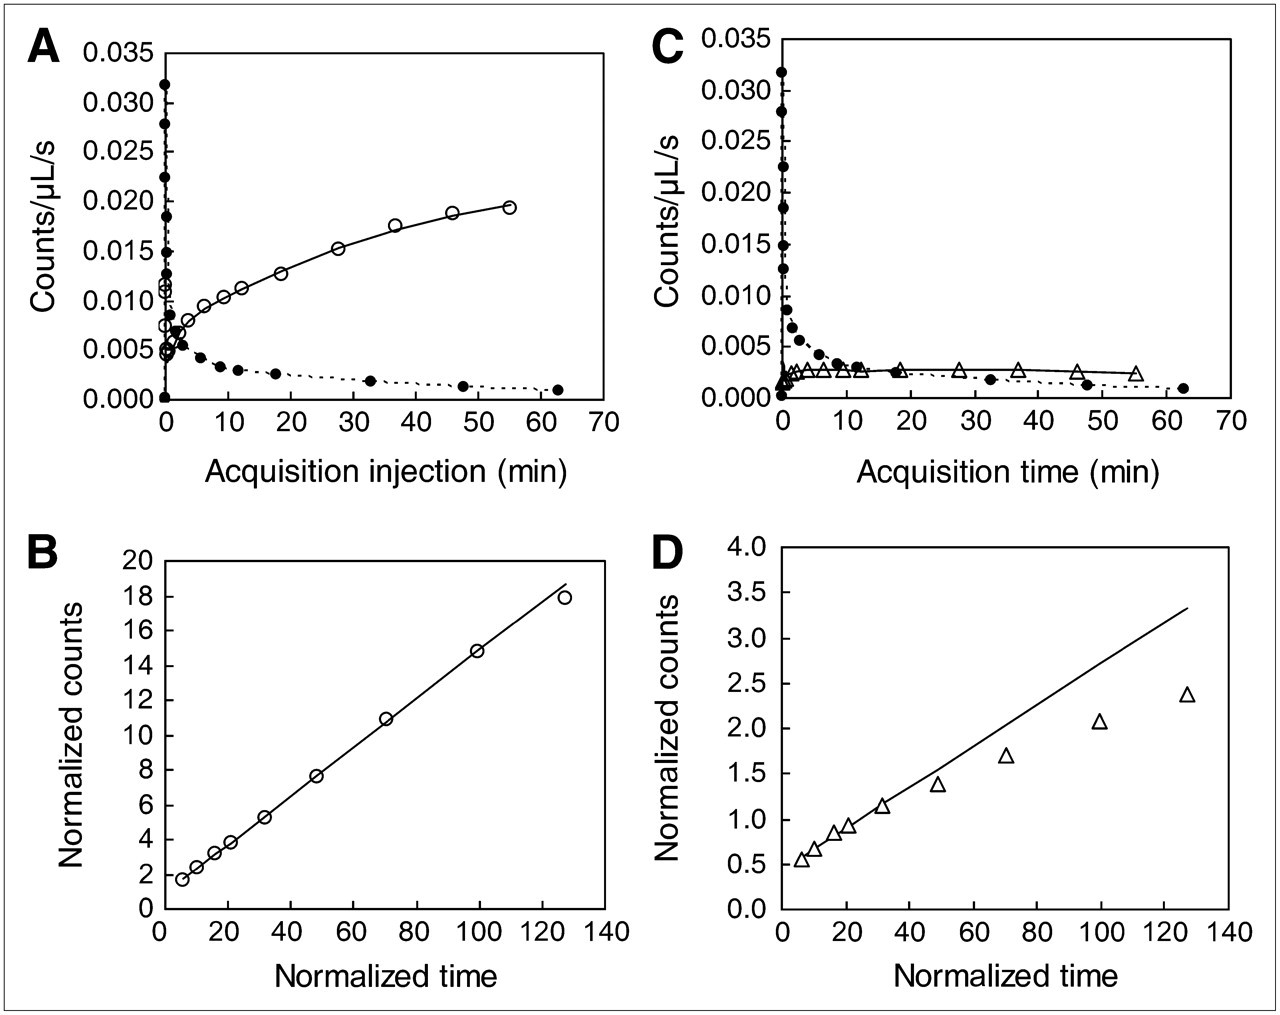
Figure 4 shows the 18F-FDG ratios in the whole blood and the plasma after 18F-FDG injections. A consistent pattern of the 18F-FDG ratios of plasma to whole blood was found among the 6 mice. After 18F-FDG injection, the RFDG value decreased gradually and approached a steady-state value of 1.1650 at 60 min. An exponential function,  (Eq. 5), fits the time course of RFDG changes with small residuals. Using whole-blood samples, Equation 5 estimated plasma counts that matched very well with the actual plasma counts (Fig. 4B).

(A) 18F-FDG activities in whole-blood and plasma samples after 18F-FDG injections. Symbols in plot are 18F-FDG ratios ( ) of plasma to whole blood obtained from 6 mice. Ratios from the same mouse were plotted with the same type of symbol. An exponential function,
  (Eq. 5), fits the ratios well with small residuals. (B) Plot depicts comparable counting rates between measured (triangles) and estimated (open circles) plasma counts of a mouse study. Estimated plasma counts were calculated by using whole-blood sample counts (asterisks) and Equation 5.
18F-FDG Kinetics in Myocardial and Brain Tissues
Glucose concentrations of the 4 mice during the PET scans were in the normoglycemic range (i.e., 638, 650, 761, and 856 μmol/dL). Figure 5 shows the typical 18F-FDG kinetics in a mouse (i.e., mouse 1 in (Table 1). The input function (i.e., plasma 18F-FDG concentrations) was derived from whole-blood samples and Equation 5. The  ,
,  ,
,  ,
,  , and
, and  values estimated by the 18F-FDG compartmental model are 0.36 mL/min/g, 0.22 min−1, 0.16 min−1, 0.0046 min−1, and 0.149 mL/min/g for the myocardial tissue and 0.13 mL/min/g, 0.29 min−1, 0.07 min−1, 0.021 min−1, and 0.025 mL/min/g for the brain tissue, respectively. The R2 values of the model fittings are 0.99 and 0.90, respectively. The
  obtained by the Patlak graphical analysis are 0.140 and 0.023 mL/min/g for the myocardial and the brain tissue, respectively. The R2 of the Patlak fittings are >0.99. Table 1 summarizes the quantitative estimates for the 4 mice. Except for mouse 1, which had a relatively high myocardial 18F-FDG uptake, the 18F-FDG kinetics among the mice are similar. The cerebral glucose metabolic rates (CMRglc) of the 4 mice were 25.6, 18.7, 17.0, and 24.8 μmol/min/100 g. Figure 6 shows the
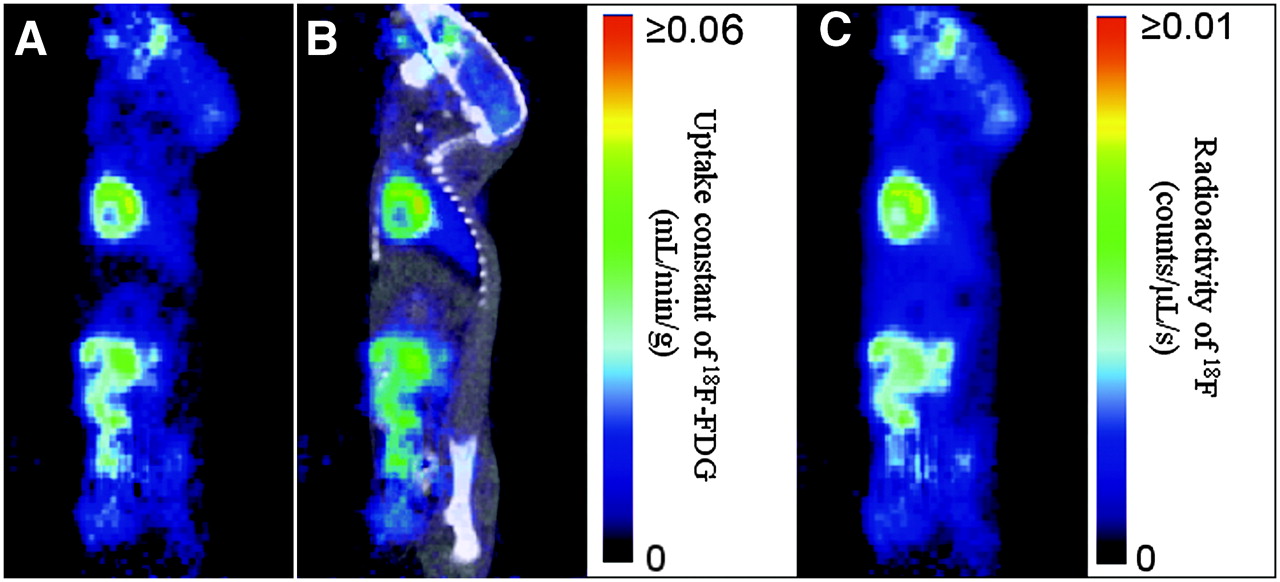
  parametric images and the summed image (45–60 min) of a mouse. The parametric image (Fig. 6A) has larger signal-to-background ratios when compared with the summed image (Fig. 6C). When a small ROI (1 mm3) was placed on the myocardial tissue of the dynamic images, the
  obtained from the conventional time–activity curve and 3-compartment 18F-FDG model analysis was 0.044 mL/min/g, which is similar to the mean pixel value of 0.041 mL/min/g obtained from the parametric image. The
  values of the brain tissue are 0.014 and 0.014 mL/min/g from the 2 methods, respectively.
Typical example demonstrates 18F-FDG kinetics in mice after 18F-FDG bolus injection. Solid circles and dashed lines are input functions derived from blood samples taken by microfluidic blood-sampling device. Open circles and triangles are myocardial and brain time–activity curves, respectively, from PET images. Plots in A (myocardial tissue) and C (brain tissue) show quantitative analysis using compartmental model fittings. Plots in B (myocardial tissue) and D (brain tissue) show quantitative analysis using Patlak graphical analysis. Black lines are regression lines that depict the goodness (R2 > 0.90) of the model or the graphical fitting. Although PET data from 60-min scans are shown in B and D, only data of 3–22 min (i.e., the first 5 data points) are used in Patlak analysis to minimize effects of  .
.

(A) Color image shows whole-body parametric image (128 × 95 matrix; pixel value:  in mL/min/g) generated from quantitative 18F-FDG PET study. Only a 2-dimensional sagittal cross-sectional image from a 3-dimensional volumetric dataset is shown. (B) Parametric image superimposed with microCT image (in black and white) of same mouse. (C) Nonquantitative image of same mouse. Image was generated by summing 45- to 60-min data.
18F-FDG Kinetics Estimated by 3-Compartment Model and Patlak Analysis, Respectively
DISCUSSION
Despite the significant advances in small-animal PET scanners in recent years, >90% of the mouse PET studies were not fully quantitative in terms of absolute physiologic or biologic units. One of the major reasons why researchers did not use the full capability of small-animal PET was associated with the difficulty of serial blood sampling in mice. In this study, we demonstrated the feasibility of performing in vivo quantitation by integrating small-animal PET with microfluidic technology. Connected to a microfluidic chip, the mouse was studied with minimal disturbance. The total blood loss was <0.5% of the body weight, and the impact on physiologic change was expected to be minimal. The blood sampling by the microfluidic device was completely automated. The investigator and staff were not exposed to as much radiation once the PET acquisition and the blood-sampling procedure were initiated. Although a blood sample with a volume of ∼220 nL was taken using the current design, the volume can be either increased or decreased by modifying the size of the microchannel in the PDMS chip. The speed and the precision of the blood-sampling device are demonstrated by the blood curves we obtained (Figs. 2 and 3). The 18F-FDG rate constants  ,
,  ,
,  , and
, and  were estimated robustly by the 3-compartment model and showed small variations (Table 1). The values of
  estimated by using this model or the Patlak analysis were comparable. The values of
  ,
,  ,
,  , and
, and  are not available in the literature for comparison. Although the CMRglc values from our studies were slightly lower than those reported by Toyama et al. (Table 2), the discrepancy was probably due to the use of different tissue regions, analysis methods, scanners, and reconstruction algorithms (22). Toyama et al. reconstructed the static images using a 2-dimensional ordered-subset expectation maximization (OSEM) algorithm and used the gray matter ROIs. We used the filtered backprojection algorithm to reduce the computation burden of generating the dynamic sequence of mouse images. As a result, it was more difficult to define an accurate gray matter ROI due to the limited resolution of the brain images. Therefore, we used the whole-brain ROI. For the calculation of the CMRglc, we used the rate constants of the individual mouse that were estimated from the 3-compartment 18F-FDG model. The method accounted for the enzyme activity of the glucose-6-phosphatase. By taking these factors into account, the CMRglc values measured in our studies were comparable to those reported by Toyama et al. (22) For the first time, the 18F-FDG kinetics in mice has been reliably measured by using arterial blood samples and regional tissue time–activity curves. In addition, we generated whole-body parametric images of
  by using the Patlak analysis. The merit of generating parametric images that represent the spatial distribution of the physiologic parameters of tracer kinetics has long been recognized (23,24). Because the parametric images were generated by using the Patlak analysis, which assumes a negligible
  value, caution must be taken when data are interpreted. In this study, we used the 3- to 22-min PET data to generate the
  images, so that the effect of ignoring the
  value could be minimized. This time interval was chosen on the basis of our preliminary studies (20). The
  values of the major tissues, such as myocardium and brain, obtained from the parametric images were comparable to the
  values estimated from the conventional regional analysis.
Cerebral Glucose Metabolic Rates (CMRglc) Measured from Mice Using 18F-FDG PET
Although the microfluidic blood-sampling device we developed showed some promising results, there are more features that need to be implemented to obtain a true input function for kinetic analysis. Our studies confirmed that the amounts of 18F-FDG in the whole-blood samples were very different from those in the plasma samples after 18F-FDG injection (Fig. 4A) (12). These results suggested that the 18F-FDG activities in the whole-blood samples could not be used reliably as an input function for 18F-FDG kinetic analysis. Furthermore, many tracers, such as 3′-deoxy-3′-18F-fluorothymidine (18F-FLT), require the corrections of labeled metabolites in the blood samples (25). Separation of plasma from whole blood is a very challenging task when blood samples are small and multiple blood samples are required from a mouse. Therefore, we estimated the plasma 18F-FDG activities from the whole-blood samples using Equation 5. Although this method was justified by the similar patterns of 18F-FDG distributions among the 6 mice we studied (Fig. 4), this method might not account for variation among mice under different physiologic conditions. Implementation of a plasma-separation mechanism into our microfluidic chip is currently under investigation. In this study, we corrected the time delay of the blood curve by measuring the dead space (∼7 μL) and the blood flow (>2 μL/s) to the chip. After the correction, the peak of the blood curve matched very well with the time when the 18F-FDG bolus circulated to the descending aorta (Fig. 2). As expected, the blood curve had a wider peak compared with that of the LV curve (Fig. 2C) due to tracer dispersion. The effect of dispersion was not corrected but was expected to be small because of the small dead space. The significance of dispersion correction will be investigated by performing more studies in the future.
CONCLUSION
We developed a microfluidic blood-sampling device that takes serial blood samples from mice with minimal blood loss in a highly automated fashion. Our study demonstrates that in vivo quantitative small-animal PET can be performed routinely and reliably in a small-animal PET facility. The CMRglc values we obtained were similar to those reported in the literature. The 18F-FDG rate constants  ,
,  ,
,  , and
, and  were robustly estimated and comparable among the mice. 18F-FDG was chosen in this study to serve as an example for proof of principle but our intended development is for diverse arrays of radiobiomarkers.
Acknowledgments
We acknowledge the contributions of Dr. Nagichettiar Satyamurthy, Dr. David Stout, Judy Edwards, and Grace Chiang for technical assistance, and we thank Dr. Neil Harris, Dr. Richard Sutton, and Kathryn Rasco for their insightful comments during the preparation of this manuscript. This work was supported by National Institutes of Health grant RO1-EB001943, Department of Energy grant DE-FC03-02ER63420, and the University of California Discovery grant bio05-10510.
Footnotes
-
COPYRIGHT © 2007 by the Society of Nuclear Medicine, Inc.
References
- Received for publication November 16, 2006.
- Accepted for publication January 23, 2007.


Jump to section
Related Articles
Cited By...
- Performing Repeated Quantitative Small-Animal PET with an Arterial Input Function Is Routinely Feasible in Rats
- Real-Time Microfluidic Blood-Counting System for PET and SPECT Preclinical Pharmacokinetic Studies
- Intraarterial Microdosing: A Novel Drug Development Approach, Proof-of-Concept PET Study in Rats
- Image-Derived Input Function from the Vena Cava for 18F-FDG PET Studies in Rats and Mice
- Reply: Noninvasive Measurement of Mouse Myocardial Glucose Uptake with 18F-FDG
- Noninvasive Measurement of Mouse Myocardial Glucose Uptake with 18F-FDG
- Mapping Changes in Mouse Brain Metabolism with PET/CT
- Quantification of Brain Glucose Metabolism by 18F-FDG PET with Real-Time Arterial and Image-Derived Input Function in Mice
- Establishment of In Vivo Brain Imaging Method in Conscious Mice
- Quantification of Cerebral Glucose Metabolic Rate in Mice Using 18F-FDG and Small-Animal PET
- Kinetic Modeling of 3'-Deoxy-3'-18F-Fluorothymidine for Quantitative Cell Proliferation Imaging in Subcutaneous Tumor Models in Mice
- Spillover and Partial-Volume Correction for Image-Derived Input Functions for Small-Animal 18F-FDG PET Studies