


Abstract
Small-animal nuclear imaging modalities have become essential tools in the development process of new drugs, diagnostic procedures, and therapies. Quantification of metabolic or physiologic parameters is based on pharmacokinetic modeling of radiotracer biodistribution, which requires the blood input function in addition to tissue images. Such measurements are challenging in small animals because of their small blood volume. In this work, we propose a microfluidic counting system to monitor rodent blood radioactivity in real time, with high efficiency and small detection volume (∼1 μL). Methods: A microfluidic channel is built directly above unpackaged p-i-n photodiodes to detect β-particles with maximum efficiency. The device is embedded in a compact system comprising dedicated electronics, shielding, and pumping unit controlled by custom firmware to enable measurements next to small-animal scanners. Data corrections required to use the input function in pharmacokinetic models were established using calibrated solutions of the most common PET and SPECT radiotracers. Sensitivity, dead time, propagation delay, dispersion, background sensitivity, and the effect of sample temperature were characterized. The system was tested for pharmacokinetic studies in mice by quantifying myocardial perfusion and oxygen consumption with 11C-acetate (PET) and by measuring the arterial input function using 99mTcO4− (SPECT). Results: Sensitivity for PET isotopes reached 20%–47%, a 2- to 10-fold improvement relative to conventional catheter-based geometries. Furthermore, the system detected 99mTc-based SPECT tracers with an efficiency of 4%, an outcome not possible through a catheter. Correction for dead time was found to be unnecessary for small-animal experiments, whereas propagation delay and dispersion within the microfluidic channel were accurately corrected. Background activity and sample temperature were shown to have no influence on measurements. Finally, the system was successfully used in animal studies. Conclusion: A fully operational microfluidic blood-counting system for preclinical pharmacokinetic studies was developed. Microfluidics enabled reliable and high-efficiency measurement of the blood concentration of most common PET and SPECT radiotracers with high temporal resolution in small blood volume.
Radionuclide-based molecular imaging using PET and SPECT is a leading diagnostic tool in oncology, cardiology, and neurology (1). In research applications, small-animal models are needed to facilitate the development of new drugs, radiotracers, and therapies that can eventually be translated to humans (2). Quantification of metabolic or physiologic disorders using radiotracer pharmacokinetic models requires dynamic blood analysis in addition to tissue imaging data (3). Whole-blood radioactivity as a function of time, the so-called arterial input function (AIF), can be extracted from PET images (4,5), using an intravascular β-microprobe (6,7) or an external blood counter connected to an artery via a catheter (8–10). For accurate quantification, the measured whole-blood AIF must be corrected for known plasmatic and metabolite fractions. For new radiotracers, such parameters are not yet established, and blood samples have to be drawn and analyzed. However, repetitive manual blood sampling is difficult and time-consuming and can affect the animal homeostasis, especially in mice (∼1.4 mL total blood volume).
Lab-on-a-chip devices are miniature analysis platforms based on microelectronic fabrication principles that integrate one or several laboratory functions (11). They incorporate micron-scale fluidic channels that can perform several operations such as plasma separation, radiation detection, and chemical analysis. Thus, microfluidics technology is an attractive solution to provide full characterization of new radiotracers in small-animal studies. In this work, we present one building block of such an integrated microfluidic system for real-time blood radioactivity monitoring.
PET radiotracers emit positrons (β+), with a maximum energy Eβmax ranging typically from 0.6 to 1.9 MeV, that rapidly annihilate, producing two 511-keV annihilation photons. Most SPECT radiotracers emit β− and γ-rays (60–250 keV) typically accompanied by Auger or conversion electrons (CEs, < 150 keV). Thus both PET and SPECT radiotracer concentration in blood can be monitored either by charged particle (β, Auger, or CE) or by photon (γ- or annihilation) detection. High-energy photon detection requires high-density crystals, 1–2 cm thick, that are not appropriate for microsystem integration. Charged-particle detection is therefore preferred because it can be performed in a silicon wafer, the traditional substrate for microfluidic chips (12).
Charged-particle detection for blood radioactivity monitoring in pharmacokinetic studies faces several challenges. First, charged particles are stopped within a few micrometers to a millimeter in matter depending on their energy; CE, Auger, and a significant part of the polyenergetic β-particles are severely attenuated at the interface between sample and detector. Second, radiotracer concentration in rodent blood is typically less than 100 Bq/μL after tissue uptake. Third, in mice only a few hundred microliters at most are available for analysis over 10–45 min, hence detection volume must be kept as small as possible, around 1 μL, at any given time during measurement. Last, temporal resolution better than 4 s has been suggested as a prerequisite for accurate estimation of pharmacokinetic parameters (13). The detector must be able to measure a few 10s events/s at a minimum to procure a statistically significant signal. Hence, detection efficiency must be maximized and the interface thickness between sample and detector minimized.
Examples of microfluidic systems for related applications were previously reported. Two microfluidic chips were developed for microblood sampling in PET imaging (14,15), but no radiation detector was integrated. Samples had to be measured off-line in a well-counter, which can be limiting for short-half-life radioisotopes, that is, 15O (2 min), 13N (10 min), or 11C (20 min). Radiation detectors were used with microfluidic chips for DNA detection (16), protein adsorption (17), radiosynthesis monitoring (18), cell imaging (19), and protein crystallography (20), but with off-chip detectors. An early integrated chip design dedicated to charged-particle detection was proposed in the late 1990s for DNA detection (21), but the authors opted for fluorescence detection in the actual integration (22). More recently, a polydimethylsiloxane microfluidic chip was coupled to a position-sensitive avalanche-photodiode detector for cell imaging (23), but the interface thickness between sample and detector limited the sensitivity for PET tracers and did not allow the detection of low-energy CE such as the ones emitted by 99mTc.
In previous work, our group built a microfluidic channel directly above an unpackaged p-i-n silicon photodiode array, eliminating all unnecessary interfaces between blood and the photodiode detection layer to overcome these limitations (24,25). We also proposed a method to improve the blood compatibility of the microchannel polymer building material (26). The microfluidic geometry was optimized, the fabrication process detailed, and a preliminary characterization of the microfluidic chip was performed (27). In the present work, we describe a prototype blood-counting system comprising the microfluidic chip together with dedicated electronics, software, and pumping unit. Data corrections required to use the measured AIF in pharmacokinetic models are described and fully characterized for the most common PET and SPECT radiotracers. Finally, the system was used for the measurement of myocardial perfusion and oxygen consumption in mice using the PET tracer 11C-acetate and to determine the AIF of the SPECT tracer 99mTcO4− in mice.
MATERIALS AND METHODS
System Overview
The proposed microfluidic blood-counting system is based on direct β- or electron detection within a microchannel built above unpackaged p-i-n photodiodes. It consists of two separate hardware modules, a detection unit enclosed in a compact radiation shield linked to a peristaltic pump, and a control unit (Fig. 1). The supplemental materials provide a detailed description (supplemental materials are available at http://jnm.snmjournals.org).

Schematic view of microfluidic blood-counting system.
Microfluidic Detector
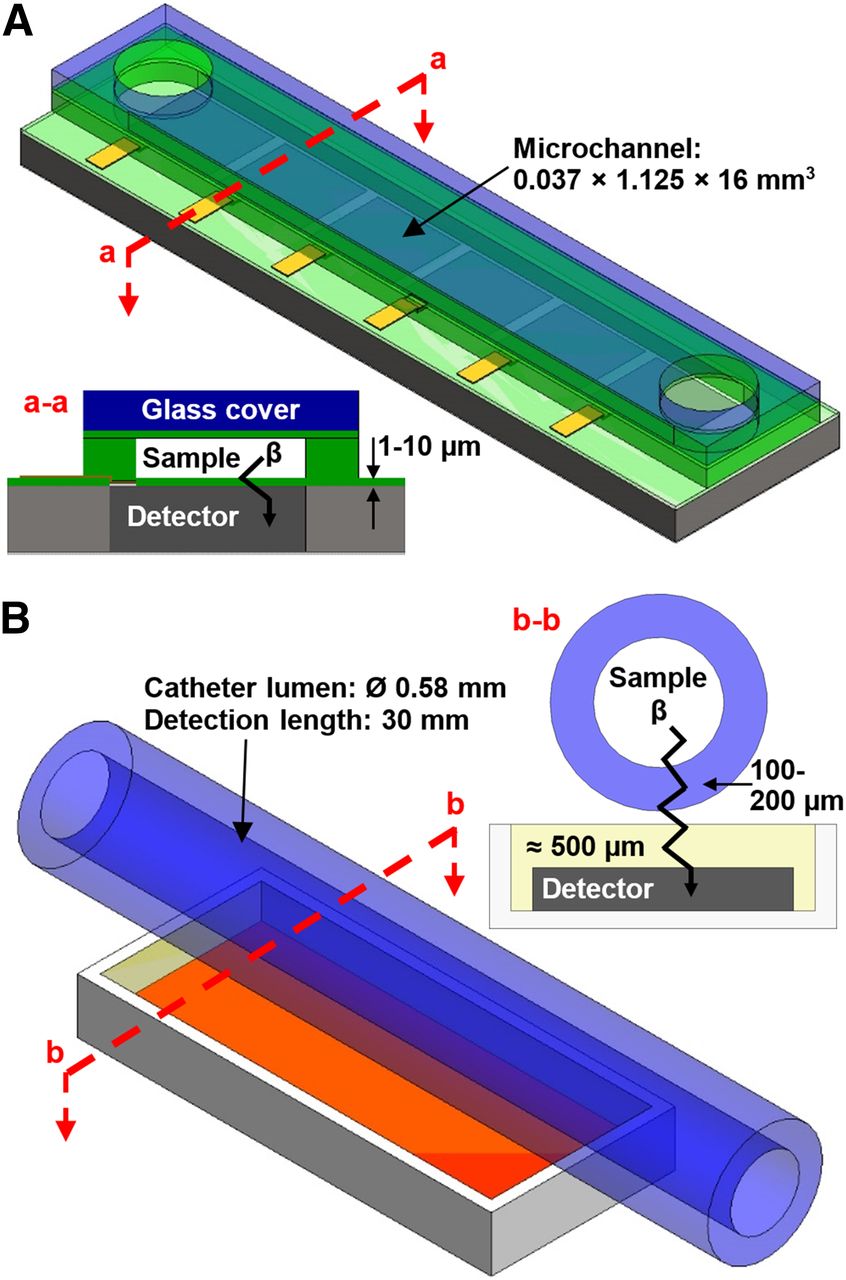
The microfluidic chips were built with a rectangular microchannel forming a quasi–two-dimesional source and, therefore, achieving quasiperfect geometric detection efficiency (Fig. 2A). Furthermore, the microfluidic chips were designed to leave only a few micrometers between the sample and the detector, drastically decreasing particle energy loss (27) before reaching the detection region (∼2 keV) compared with a conventional design built with a catheter (e.g., polyethylene tubing, Intramedic PE50 or PE10 [Becton Dickinson]) (∼200 keV).

Three-dimensional and cross-sectional views of microfluidic chip (A) and of catheter-based geometry for β-detection (B) (not to scale).
The channel was microfabricated over a 44 × 22 mm2 die containing a linear array of eight 2 × 2 mm2 silicon p-i-n photodiodes from Excelitas Technologies. The detailed fabrication process was reported elsewhere (27) and is briefly summarized in the supplemental materials. The resulting microfluidic chips had a 37 × 1125 μm2 cross section and 16-mm length for a detection volume of 0.66 μL.
As a first validation of the microfluidic blood-counting system, energy spectra were recorded at the shaping amplifier output and confirmed the validity of the measurement (25). Briefly, low-energy gammas and x-rays from 241Am and 133Ba sources provided a calibration factor of 4.38 mV/keV and a noise level of 25 keV. Liquid sources showed a characteristic continuous spectrum for a β-emitter (18F) and a peak for a CE emitter (99mTc).
Catheter-Based Detector
To characterize the gain in performance attributable to the microfluidics design, comparative measurements were conducted with a commercially packaged p-i-n photodiode (S3588-08, 3 × 30 mm2 with ∼500 μm epoxy protection layer, Hamamatsu Corp.) and a catheter bonded to its surface as pictured in Figure 2B.
Data Corrections
To be used as an AIF in pharmacokinetic models, the data recorded by the microfluidic blood-counting system must be corrected for radionuclide decay time, detector sensitivity, radioactivity dispersion, and propagation delay between the cannulation point and the detector. The system was also assessed for dead time, sensitivity to background radioactivity, and influence of sample temperature (supplemental materials). For all experiments, the detection threshold was adjusted to record a 5-cps background counting rate before injection of the radioactivity (8), and all recorded counting rates were decay-corrected by software referred to the acquisition start.
Sensitivity
The sensitivity relates the measured counting rate to the actual radioactive concentration in the detection volume. For direct β-detectors, the sensitivity is dependent on the incident particle energy and specific detection geometry; therefore, the sensitivity has to be characterized for each radionuclide. The microfluidic chip and a piece of PE50 or PE10 bonded to the catheter-based detector were consecutively injected with 10 kBq/μL solutions of four common PET radioisotopes (18F, 11C, 64Cu, and 68Ga) and a 40 kBq/μL solution of the SPECT isotope 99mTc. The detection threshold was adjusted, and data acquisition started for 2 min. The average counting rate, m (cps), corrected for radioactive decay, was used to calculate the device absolute detection efficiency η (%) for each radioisotope, following: Eq. 1where C (Bq/μL) is the calibrated solution concentration, and V (μL) is the device detection volume. Minimum and maximum detectable activities (Bq/μL) were then computed as:
 Eq. 2
Eq. 2 Eq. 3where b = 5 cps is the background counting rate, and Nmax = 65,535 cps is the maximum counting rate allowed by the control unit 16-bit counter. Equation 2, derived from the frequently quoted Curie equation, can be interpreted as the minimum activity ensuring a false-positive readout less than 5% of the time (28).
Propagation Delay
The dead volume between the cannulation point and the detector causes a propagation delay. For typical mouse studies, the fluid path consists of a 20-cm-long PE10 tubing (12 μL) from the animal to the detection unit entry and an 8-cm-long PE10 tubing (5 μL) inside the detection unit. The fluidic junctions to tubing have no dead volume. Hence, the total dead volume is 17 μL and the propagation delay is 35 s at 30 μL/min and 74 s at 14 μL/min.
Dispersion
Dispersion effects produce distortion of transient radioactive concentrations in catheters, and may have a great impact on pharmacokinetic parameters, especially when estimating fast blood-tissue exchange parameters, such as in blood flow measurements (29,30). Dispersion depends on several factors, including catheter internal diameter, withdrawal rate, and distance between the animal and detector. Fluidic junctions between the catheter and the microfluidic chip may also contribute to dispersion. The correction procedure for dispersion is based on a fit of the measured AIF using a biexponential model (the supplemental materials provide a detailed description).
To validate the method, an AIF measurement was simulated with radioactive water, corrected for dispersion and compared with manual samples. A reservoir was filled with 2 mL of cold water and placed on an agitating plate. The reservoir was sampled at 14 or 30 μL/min through a 20-cm-long PE10 catheter connected to the microfluidic counting system. 18F-FDG was injected 30 s after starting the acquisition (21.6 MBq, 0.3 mL at 0.9 mL/min using a syringe pump). A slow injection of cold water was started at the same time to simulate the tracer clearance (10 mL at 7 mL/min using another syringe pump). Manual samples (25 μL) were withdrawn using a micropipette every 10 s for 90 s, then every 15 s for 30 s and every 2 min up to the end of the 10-min acquisition. Each sample was weighted to assess the exact volume. The samples’ radioactivity was then measured using a γ-well counter (Cobra II Auto-γ; Canberra-Packard). AIF obtained both from manual samples and from the blood counter were corrected for radioactive decay and for the sensitivity of each counter. The latter was further corrected for propagation delay. A third AIF was obtained by correcting the AIF from the blood counter for dispersion as indicated above. To assess the efficiency of this correction, the three AIFs were compared using a repeated-measures 1-way ANOVA test with the Greenhouse–Geisser correction and Dunnett multiple comparison using the manual samples as a reference. The curves were considered significantly different for a P value of 0.05 or less.
Animal Studies
Animal Preparation
Animal experiments were performed in accordance with the recommendations of the in-house Ethics Committee for Animal Experiments and the Canadian Council on Animal Care. BALB/c and C57BL/6 mice had free access to food and water before the experiment. The animals were anesthetized with isoflurane (2% + 1.5 L/min O2) and cannulated in the caudal vein for injection and in the carotid artery for blood withdrawal (20-cm-long PE10 catheter prefilled with heparinized saline, 0.9%, 50 U/mL). The animal temperature was regulated, and the heart beat and breathing were monitored to ensure that physiologic conditions were maintained stable during the experiment.
PET Pharmacokinetic Study
A study was performed to investigate the measurement of myocardial blood flow and oxygen consumption in a mouse with 11C-acetate using the microfluidic blood-counting system. This study yielded an AIF from PET images in addition to the AIF measured by the blood counter. A cannulated BALB/c mouse (28 g) was placed in a LabPET4 scanner (31) (Gamma Medica Inc.) with a transaxial and axial field of view of 11 and 3.75 cm, respectively, and a nearly isotropic resolution of 1.35 mm. The heart was centered in the field of view, and the withdrawing cannula was connected to the microfluidic blood-counting system. To minimize the cannula length and keep it straight, the blood counter was placed at the rear of the scanner. The discriminator threshold of the blood counter was then adjusted, and the pump speed was set to 14 μL/min. Both the PET and the counter acquisitions were started in synchronization 30 s before the injection of 40.2 MBq of 11C-acetate (0.1 mL at 0.2 mL/min) in the animal. The blood drawing rate was lowered to 10 μL/min after 4 min and kept unchanged up to the end of the 20.5-min acquisition. After the experiment, a cylindric mouse phantom (1.2 kBq/μL, 26.6 mL) was scanned to calibrate the PET images.
Technetium AIF Measurement
A second mouse study was performed to validate the AIF measurement using the SPECT radiotracer 99mTcO4−. A C57BL/6 mouse (28 g) was anesthetized and cannulated as described above. A 45-min acquisition was then started on the microfluidic blood-counting system (14 μL/min), and 88 MBq (0.15 mL at 0.3 mL/min) of 99mTcO4− were injected 1 min later. After 5 min, the drawing rate was lowered to 10 μL/min for the remaining time. For this experiment, the input of the blood counter was switched back to nonradioactive saline after 43 min.
Data Analysis and Corrections
AIFs measured with the blood counter were corrected for decay time, sensitivity, propagation delay, and dispersion. The measured data, recorded every second, were also smoothed using a 10-s moving average filter to reduce statistical noise caused by the random nature of radioactive decay. PET images were reconstructed using a maximum-likelihood estimator algorithm with 15 iterations and using the dynamic sequence 1 × 30 (before injection), 12 × 5, 8 × 30, 2 × 150, and 2 × 300 s (25 frames). Attenuation and scatter corrections were not applied. Myocardium time–activity curves (mTAC) and image-derived input functions (IDIF) were obtained by manually drawing regions-of-interest (ROIs) on the myocardium and left ventricle, respectively, in the summed frames of the interval from 2 to 3 min. IDIF was corrected for spill-in effects assuming an ROI volume of 2.5 mm3, and both mTAC and IDIF were corrected for partial volume considering an ROI average diameter of 2.5 mm (32). A 3-compartment kinetic model was used for computing myocardial blood flow (K1) and oxygen consumption (k2) using the equations described in the supplemental materials. For validation, we performed a comparison between K1 and k2 parameters estimated using IDIF or AIF obtained from the microfluidic blood-counting system.
RESULTS
Data Corrections
Sensitivity
Sensitivity parameters computed using Equations 1–3 are summarized in Table 1 for different isotopes measured by microfluidic and catheter-based detectors. Absolute detection sensitivities (η) of the microfluidic detector for PET isotopes ranged from 20% to 47%, a 2- to 10-fold gain relative to the conventional catheter-based configurations. Minimum detectable activities (Amin) of PET isotopes ranged from 42 to 100 Bq/μL for Chip 1, whereas they ranged from 33 to 254 Bq/μL for PE10 and from 10 to 93 Bq/μL for PE50. These sensitivities are suitable for most pharmacokinetic PET studies in small animals. PE50 yields lower Amin but has a larger detection volume requiring more blood. For comparison purposes, estimates for Chip 2 with a larger detection volume (37 × 1,250 μm2 cross section, 31.5-mm detection length) were added in Table 1, assuming the same η as Chip 1. The resulting detection volume was 1.46 μL, yielding Amin ranging from 19 to 45 Bq/μL, up to twice lower than that obtained with PE50 having a detection volume of 7.93 μL. Finally, the microfluidic blood-counting system was able to record an AIF with 99mTc (Amin = 238–527 Bq/μL), which was not possible with the conventional catheter-based geometry (Amin > 1 kBq/μL). The maximum detectable activity ranged from 50 to 1,267 kBq/μL for PET isotopes and was above 500 kBq/μL for 99mTc.
Absolute Detection Efficiency and Detection Limit for Microfluidic and Catheter-Based Detectors
Dispersion
The AIF measured from manual samples and from the microfluidic blood-counting system with and without the correction for dispersion are shown in Figure 3. The ANOVA test showed that the blood counter curve corrected for dispersion was not statistically different from manual samples (P = 0.03), whereas it was without the correction (P = 0.74). The resulting fitted dispersion time constant τdisp was 5.4 and 2.8 s at 14 and 30 μL/min withdrawal rate, respectively.
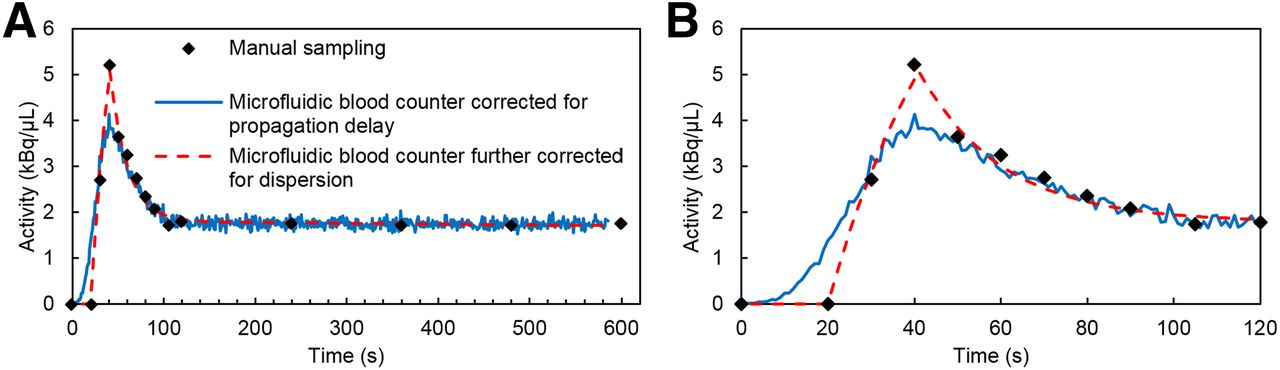
(A) AIF simulated by injecting 18F-FDG (21.6 MBq, 0.3 mL at 0.9 mL/min) in reservoir while flushing with cold water (10 mL at 7 mL/min). AIFs were obtained manually (micropipette) and with microfluidic blood-counting system (14 μL/min withdrawal) to validate dispersion correction. (B) Detailed view of bolus region.
Animal Studies
PET Pharmacokinetic Study
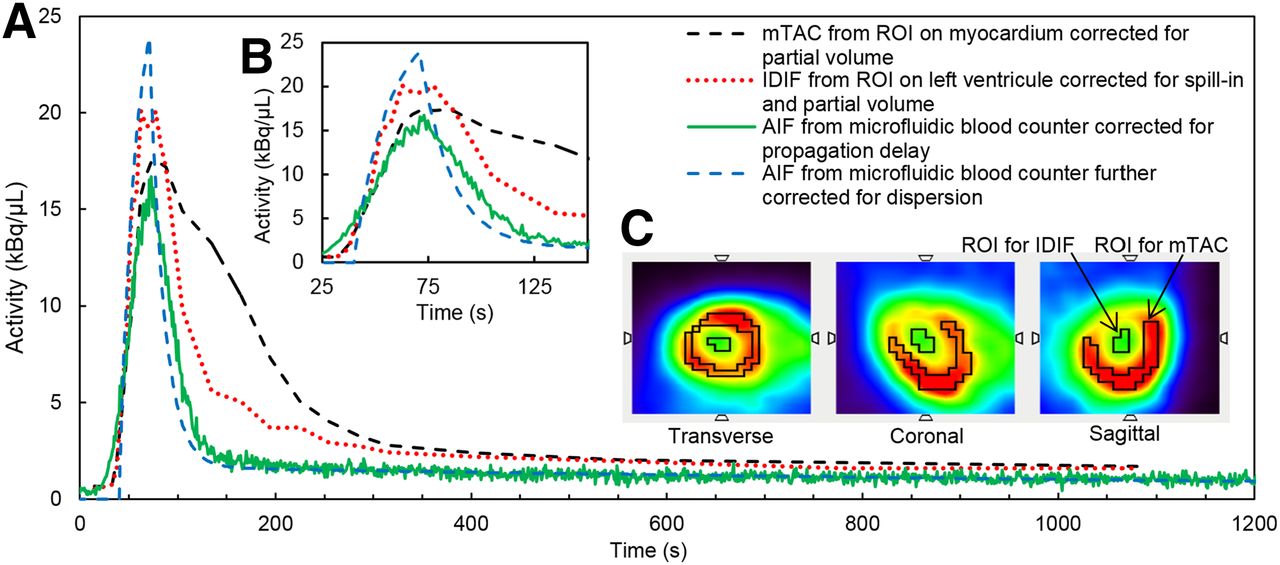
Typical IDIF and mTAC obtained from PET images and the corrected AIF obtained from the microfluidic blood-counting system are illustrated in Figures 4A and 4B, respectively, together with the PET images of the mouse heart for the 2- to 3-min time frame and the ROIs used to compute the mTAC and IDIF (Fig. 4C). The resulting myocardial blood flow and oxygen consumption indices given by the rate constants K1 and k2 are 3.4 and 0.9 min−1, respectively, using the IDIF as the blood curve in the kinetic model. These values are 3.5 and 0.7 min−1 using the AIF from the microfluidic blood-counting system corrected for dispersion. These values are in good agreement with values of K1 = 3.5 ± 1.0 min−1 and k2 = 1.3 ± 0.5 min−1 obtained in rats with a similar protocol (32). The dispersion time constant fitted by the dispersion correction model was τdisp = 9.4 s. As expected from fluid viscosities, the dispersion is higher in this experiment performed with blood than in the previous one performed with water for an identical setup.

(A) AIF, IDIF, and mTAC obtained after bolus injection of 11C-acetate (40.2 MBq in 0.1 mL at 0.2 mL/min, no flush) in 28-g BALB/c mouse. AIF was obtained at 14 μL/min withdrawal rate for 4 min, then at 10 μL/min for remainder of experiment. (B) Detailed view of bolus region. (C) IDIF and mTAC were calculated from ROIs on left ventricle and myocardium, respectively.
Technetium AIF Measurement
An AIF obtained with the microfluidic blood counter after 99mTc injection in a mouse is shown in Figure 5 with and without correction for dispersion. This experiment confirms the ability of the microfluidic system to measure AIF with the SPECT isotope 99mTc emitting only low-energy conversion electrons. It also confirmed the system’s ability to perform data acquisition up to 40 min without blood clotting and without any significant tracer adsorption to the microfluidic chip walls, because the counting rate returned to background level when nonradioactive saline was injected in the microfluidic counter.

AIF measured with microfluidic blood counter after bolus injection of 99mTcO4− (88 MBq in 0.15 mL at 0.3 mL/min, no flush) in 28-g C57BL/6 mouse. Withdrawal rate was reduced after 5 min. Measured data were corrected for radioactive decay and smoothed to decrease statistical error (moving average, 10 s).
DISCUSSION
Microfluidic Blood-Counting System
This work describes a microfluidic blood-counting system to monitor blood radioactivity from PET and SPECT radiotracers with high efficiency and high temporal resolution in a small blood volume. The technology is compatible with integration of other on-chip functionalities such as plasma separation from whole-blood and plasma sampling and analysis as a function of time to increase the throughput of new radiotracers development.
The invasiveness of external AIF measurement is often mentioned as a drawback that makes follow-up studies difficult, especially when the animal is cannulated in the carotid artery as in the studies presented in this work. Blood withdrawal is, however, necessary when chemical analysis of plasma samples is required to quantify metabolites of new radiotracers. Less invasive cannulation points such as the tail artery can then be adopted in conjunction with a microfluidic blood-counting system (33).
Sensitivity
The proposed microfluidic blood-counting system shows high absolute detection efficiency for PET tracers, especially for isotopes with the highest Eβmax, that is, 11C and 68Ga. The achieved efficiencies, respectively, 47% and 43%, are almost ideal considering that the emission is random and that the detector covers only 1 side of the microchannel.
The β-emitting isotopes with lower energy, 18F and 64Cu, have slightly reduced detection efficiency because a larger fraction of the particles do not reach the detector or produce a signal below the noise threshold. The detection efficiency of 64Cu is also affected by a β-emission probability of only 56%. Thanks to both, the thin interface thickness between the sample and detector and the more efficient detection geometry, the loss of detection efficiency for low-energy isotopes is much less significant with the microfluidic system, improving from more than a 5-fold drop between 11C and 64Cu for catheter-based detectors to only slightly more than a 2-fold reduction for the microfluidic detector.
The gain in sensitivity achieved with the current microfluidic device would still not be sufficient to be applicable for use in human studies, considering typical peak and equilibrium blood tracer concentrations of 74 and ∼7 Bq/μL, respectively. However, microfluidic devices with larger detection volumes (Table 1, Chip 2) and optimized detection geometry can readily be designed to achieve the required sensitivity.
Dispersion Correction
Kinetic parameters are estimated using the AIF and time–activity curve as inputs. However, dispersion of the radioactive bolus inside the catheter of an external blood counter distorts the AIF relative to the sampling site and leads to error in kinetic parameters. For example, Votaw et al. (34) measured a 0.3% error in cerebral blood flow estimated with H215O for a dispersion of 1.3 s. This error rises to 33% for a dispersion of 10 s. Dispersion can be reduced by minimizing the animal-to-detector distance, by decreasing the cannula internal diameter, and by maximizing the withdrawal rate. Unfortunately, dispersion is always significant in typical experiments with mice, mainly because of the limited withdrawal rate. If the injection site is far from the sampling site, dispersion inside the animal can also affect the measured AIF. Such dispersion should, however, be considered by the biexponential model used for correction (35).
The method implemented here to correct for dispersion yields satisfactory results. Compared with other methods reported in the literature, fitting of the measured AIF has the advantage of requiring no previous parameter estimation. However, initial parameters, especially the injection time, must have been well recorded to obtain reproducible results. In the present study (supplemental materials), two consecutive fits were made, the first one to have a good estimation of input parameters and the second for more accurate fitting of the tracer in vivo kinetics.
In one validation study, the experimentally simulated AIF was compared with manual sampling. Even if manual sampling is considered as the gold standard for AIF measurements, its temporal resolution is limited and may induce distortion in the AIF too (33). Another common reference for nondispersed AIF is the IDIF extracted from a ROI in PET images. However, the temporal resolution in dynamic image series can also be limited and such measurements require further partial-volume and spill-in corrections that may also introduce additional errors.
Animal Studies
The proposed microfluidic blood-counting system was successfully used with rats (27) and mice in this work after injection of PET and SPECT tracers. The counter-derived AIF was successfully compared with manual samples in a phantom experiment. Direct comparison of the AIF to IDIF in the present PET study with mice was not straightforward: on one hand, AIF must be corrected for propagation delay and dispersion; and on the other hand, IDIF is affected by partial volume and myocardium activity spilling in the left ventricle. Although the rising edges were similar, some contamination was visible on the falling edge of the IDIF (Fig. 4), even when applying spill-in correction. Moreover, the sampling period for IDIF is limited to approximately 5 s in practice, which induces undesirable smoothing of the peak corresponding to the bolus injection and reduces its maximum. All these factors influence the reliability and accuracy of pharmacokinetic parameters calculated from IDIF (4,5). Also, only whole-blood radioactivity can be estimated from IDIF, limiting its use to known radiotracers. In all those respects, the microfluidic blood-counting system will be an attractive alternative to IDIF and manual sampling for AIF measurements.
CONCLUSION
A blood-counting system, based on the detection of β-particles in a microfluidic chip, was developed to monitor the radioactivity in rodents’ blood in real time with high efficiency using a small blood volume. The system comprises dedicated electronics, software, and pumping unit for stand-alone use in PET and SPECT studies. Sensitive measurements can be performed with high temporal resolution for pharmacokinetic studies in mice. Furthermore, the microfluidic design enables the detection of 99mTc-based SPECT tracers, which is not possible with catheter-based β-detection systems. Experiments showed that the system was insensitive to background radioactivity and blood temperature and that no dead time correction was required. Simple and robust corrections were successfully applied for delay and dispersion. Microfluidics provides a reliable and attractive solution for blood radioactivity measurement in pharmacokinetic studies with small animals.
DISCLOSURE
The costs of publication of this article were defrayed in part by the payment of page charges. Therefore, and solely to indicate this fact, this article is hereby marked “advertisement” in accordance with 18 USC section 1734. This work was supported by the Canadian Institutes of Health Research (CIHR) grant #MOP-86717 and NanoQuébec. The Research Centre of CHUS (CRCHUS) hosting the Sherbrooke Molecular Imaging Centre is a FRQS-funded research organization. No other potential conflict of interest relevant to this article was reported.
Acknowledgments
We thank Dr. Henri Dautet of Excelitas Technologies for supplying the p-i-n photodiode wafers, Véronique Dumulon-Perreault and Mélanie Archambault from the Sherbrooke Molecular Imaging Centre for support with animal experiments, Sylvain Lauzier and Jean-Nicolas Mélançon-Emond from the Department of Electrical and Computer Engineering for help with the electronic boards, and the staff of the Nanofabrication and Nanocharacterisation Research Center (CRN2) of Université de Sherbrooke for microfabrication support.
Footnotes
Published online May 5, 2016.
- © 2016 by the Society of Nuclear Medicine and Molecular Imaging, Inc.
REFERENCES
- Received for publication June 26, 2015.
- Accepted for publication March 29, 2016.


