


Abstract
The aim of the present study was to evaluate whether extended analyses of O-(2-18F-fluoroethyl)-l-tyrosine (FET) uptake kinetics provide results superior to those of standard tumor-to-background ratios in predicting tumor grade in patients with pretreated gliomas. Methods: Dynamic 18F-FET PET studies (0–40 min after injection of 180 MBq of 18F-FET) were performed on 45 glioma patients with suspected tumor recurrence after multimodal treatment. For the standard method, tumoral maximal standardized uptake value (SUVmax) and the ratio to the background were derived from a summed image 20–40 min after injection. Dynamic data evaluation comprised several approaches: first, SUV within a 90% isocontour threshold (SUV90) and the respective ratio to the background calculated for each time frame between 5 and 40 min after injection; second, the time to peak analysis; and third, various parameters accounting for the individual time course of 18F-FET uptake. Results were correlated with the histopathologic findings of MRI/PET-guided stereotactic biopsies and were evaluated with respect to their discriminatory power to separate low- from high-grade tumors using receiver-operating characteristic (ROC) analyses. Results: The parameters taking into account the individual time course of 18F-FET uptake were able to differentiate low-grade from high-grade recurrent astrocytomas with high diagnostic accuracy, reaching the best differentiation with a sensitivity and specificity of 92% and an area under the ROC curve (AUC) of 0.94. For the other parameters, the respective values were considerably lower (time to peak: 85% sensitivity and 88% specificity; SUV90-to-background ratio for single-frame evaluation of the early-uptake phase: 100% sensitivity, 62% specificity, and 0.81 AUC). The lowest performance was provided by the standard method (SUVmax: 73% sensitivity, 54% specificity, and 0.60 AUC; SUVmax-to-background ratio: 62% sensitivity, 62% specificity, and 0.59 AUC). Time–activity curves (5–40 min after injection) slightly and steadily increased in tumor-free patients and in low-grade tumors, whereas high-grade tumors showed an early peak around 10–15 min after injection followed by a decrease. Conclusion: This study has shown differences in the dynamics of 18F-FET uptake between recurrent low- and high-grade gliomas. Therefore, parameters addressing the different kinetic behaviors allow discrimination with high diagnostic power between these 2 prognostically different groups. Thus, the techniques introduced here are clearly superior to the yet most widely used standard method.
The therapeutic management and outcome of glioma patients are quite variable and depend markedly on the histologic tumor grade (1). MRI has found a close correlation between contrast enhancement and malignant neovascularity and endothelial proliferation (2). Therefore, contrast enhancement has been associated with a higher grade of malignancy in untreated patients (3). After multimodal treatment, however, this principle is of limited value (4,5) because all reactive therapy–induced changes, both without and with tumor recurrence, may appear as a mass lesion accompanied by edema and contrast enhancement. Especially in pretreated patients, however, a reliable and early diagnosis of recurrence and of the grade of malignancy is mandatory for planning further treatment, because the risk of retreatment toxicity often outweighs its potential benefits.
PET with radiolabeled amino acids or amino acid analogs may help to overcome the noted limitations of morphologic imaging and has proven to be useful in the diagnostic work-up of brain tumors (6,7). O-(2-18F-fluoroethyl)-l-tyrosine (FET) is a promising 18F-labeled amino acid analog (8) that is taken up by the transport system L but is not incorporated into proteins (8,9). The first clinical studies have proven that 18F-FET PET identifies low- and high-grade gliomas and discriminates these from nonneoplastic lesions (10–13). Furthermore, 18F-FET PET has been shown to reliably differentiate tumor recurrence from reactive lesions induced by various treatments, such as surgery, external radiation therapy, and systemic or locoregional chemotherapy (14,15).
Apart from these applications, a key issue, namely whether radiolabeled amino acids or analogs are suitable to assess tumor grading, is still matter of controversy (11,12,16–18). Because standard evaluations have reported a marked overlap between histologic grades and have failed to separate high- from low-grade tumors (11,12,15), these techniques have been considered of little value in predicting tumor grading, particularly on an individual level. Recently, however, debate has been revived because of the results of a 18F-FET PET study showing different kinetic behaviors between newly diagnosed high- and low-grade tumors (10).
The aim of the present study was to prove and extend these findings in a different setting, namely in glioma patients after multimodal treatment. In this challenging population, the diagnostic performance of a variety of newly defined parameters taking into account tracer dynamics was compared with a standard ratio-based evaluation method. Histopathologic analysis derived from stereotactic serial biopsies served as the gold standard for tumor grading to evaluate the different approaches.
MATERIALS AND METHODS
Patients
Forty-five patients (16 women and 29 men; mean age ± SD, 46 ± 12 y) with a history of primary glioma were included in the study. Individual patient data are summarized in Table 1. When, during the course of their disease, patients presented with contrast enhancement on MRI suggestive of tumor recurrence, they were referred for a 18F-FET PET investigation and underwent stereotactic serial biopsy to confirm the diagnosis as a basis for further treatment. Two patients underwent biopsy twice (total of 47 stereotactic procedures), within an interval of 8 or 10 mo. The interval between the 18F-FET PET investigation and biopsy was at most 6 wk (mean, 13 ± 11 d).
Individual Patient Data and Time Span Between Initial Diagnosis and Suspected Recurrence
Stereotactic Biopsies
Stereotactic procedures were performed by a specialized stereotactic neurosurgeon using a modification of the Riechert head ring and a workstation for multiplanar trajectory planning (19). Based on multimodal planning after coregistration of CT, MRI, and PET data (@target or iPlan stereotaxy software; BrainLAB Inc.), serial biopsy samples were taken along a trajectory including the contrast-enhanced area on MRI and the area of highest 18F-FET uptake. The average amount of tissue per biopsy specimen was 1 mm3. Intraoperative cytologic investigations of smear preparations were performed in all cases by the attending neuropathologist to ensure diagnostically suitable specimens. Final histopathologic diagnosis was established by standard light-microscopic evaluation of the biopsy specimens stained with hematoxylin and eosin according to the criteria of the latest World Health Organization (WHO) brain tumor classification by at least 2 neuropathologists (20). Neuropathologists were aware of previous histopathologic diagnoses but did not know the MRI and PET findings.
PET Studies
18F-FET PET scans were obtained with an ECAT EXACT HR+ scanner (Siemens). To obtain standardized metabolic conditions, we asked patients to fast for a minimum of 6 h before undergoing scanning. The scanner acquires 63 contiguous transaxial planes, simultaneously covering 15.5 cm of axial field of view. After a 15-min transmission scan (68Ge sources), 180 MBq of 18F-FET were injected intravenously. Dynamic studies were acquired up to 40 min after injection (128 × 128 matrix, 3-dimensional mode) and comprised a total of 16 frames (7 × 10 s, 3 × 30 s, 1 × 2 min, 3 × 5 min, and 2 × 10 min). Data were reconstructed by filtered backprojection using a Hann filter and were corrected for scatter and attenuation. For further evaluation, data were transferred to a workstation (Hermes Medical Solutions). On this platform, the following quantification procedures were performed:
Standard Method
For the standard method, the slice with the highest 18F-FET uptake was determined on a summed image comprising the period from 20 to 40 min after injection (adding frames 15 and 16). For this slice, the maximal standardized uptake value (SUVmax) was determined and the respective ratio to the background was calculated as described previously (15). Background information was derived from a cortical region of interest (ROI) at the opposite non–tumor-bearing hemisphere.
Evaluation of Dynamic Data
For analysis of dynamic data and their correlation with histopathologic findings by reasons of low counting rates in the early perfusion phase, only results from frames 12 to 16 (5–40 min after injection; at least 5 min per frame) were finally considered.
Ratio Method Applied to Single Time Frames.
Similar to the standard method, the single time frames 12–16 were also evaluated by an SUV and a respective ratio to the background. Here, however, SUVmax was substituted by an SUV based on a 90% isocontour threshold ROI (SUV90) to omit incidental results due to low count statistics in short time frames. Next, we had to consider that the size and position of 90% threshold ROIs might have varied from frame to frame. To generate consistent data based on the same ROI in each frame, we established the ROI in the frame presenting with the highest SUV90 and applied that ROI to all other respective time frames of that study. Finally, based on the assumption that between 10 and 40 min after injection 18F-FET uptake is rather stable in the normal non–tumor-bearing cortex (13), background information was derived from a summed image (10–40 min after injection, 4 added slices, mean SUV of 2 cortical ROIs). Again, this procedure was chosen to omit an incidental influence of low count statistics in the single time frames.
Time to Peak Analysis.
This temporal parameter addressed the time frame in which the highest SUV90 was noted.
Parameters Accounting for Individual Time Course of 18F-FET Uptake.
Whereas the parameters mentioned so far were based on the analysis of a single time frame selected from the series acquired, the following newly defined parameters were designed to take the dynamics of 18F-FET uptake into account and particularly to address changes between frames (which reflect changes over time).
First, according to the following formula, parameters were established that take into account the absolute and relative changes of SUV90 and SUV90-to-background ratio from frame to frame. This evaluation weights the frames equally despite differences in their duration.
where i = frame number and n = SUV90 or SUV90-to-background ratio. In addition, these parameters were recalculated by multiplying the respective values by the duration of the respective time frame to take into account the inequality of time frames:
where di = time per frame. Furthermore, an integral of the curve was calculated according to the following formula: where wi = di.
Statistical Analysis
Data of the standard and dynamic evaluations were correlated with histopathologic results. All SUVs and SUV-to-background ratios are given as mean ± SD. When appropriate, histopathologic subgroups were compared using Student t test analysis. Error probabilities below 0.05 were defined as indicating statistical significance.
With the exception of the time to peak analysis (which does not allow variance of decision thresholds), the diagnostic performance of all approaches to differentiate between low- and high-grade astrocytomas was assessed by receiver-operating characteristic (ROC) analyses (21,22). For this purpose, data were categorized using the results of histopathology as the gold standard. Decision thresholds were considered optimal when the sum of paired values for sensitivity and specificity reached the maximum. In addition, for each method the total area under the curve (AUC) was calculated.
Because of the aberrant uptake behavior of oligoastrocytomas and their small sample size, this subgroup was excluded from analysis of the parameters accounting for the individual time course of 18F-FET uptake and from the respective ROC analyses to avoid an unjustified overestimation of uptake changes in the whole group.
RESULTS
Histopathology
Histopathologic analyses revealed radiation- or therapy-induced changes without evidence of vital tumor cells in 4 of 45 patients, and 41 patients eventually exhibited tumor recurrence. Tumor classifications are detailed in Table 1. In the 2 patients who underwent biopsy twice, the histopathologic classification did not change between the first and second biopsy (1 anaplastic astrocytoma, WHO III; 1 glioblastoma, WHO IV).
Standard-Method PET Results
SUVmax and the respective ratios to the background derived from the standard evaluation from 20 to 40 min after injection are given in Table 2. Only the differences between patients with and without recurrence were statistically significant. There was a slight but statistically insignificant increase from patients with low-grade recurrences to patients with high-grade recurrences, however, with a marked overlap between these classifications. The AUCs demonstrated a low ability to discriminate between low- and high-grade astrocytic recurrences for both SUVmax (73% sensitivity, 54% specificity, and 0.595 AUC) and SUVmax-to-background ratio (62% sensitivity, 62% specificity, and 0.587 AUC). Uptake was higher in the subgroup of oligoastrocytomas than in astrocytomas, and the uptake of low-grade oligoastrocytoma was therefore even higher than the uptake of high-grade astrocytoma.
18F-FET PET Results of Standard Method (Summed Image 20–40 min After Injection; Mean ± SD) and Statistical Differences Between Histopathologic Groups
Evaluation of Dynamic PET Data
Ratio Method Applied to Single Time Frames.
The respective values for the single time frames between 5 and 40 min after injection (frames 12–16) are detailed in Table 3. In addition, the time course of 18F-FET uptake for the different patient groups is illustrated in Figure 1. Both Figure 1 and Table 3 indicate that in tumor-free patients and in patients with low-grade tumors, 18F-FET uptake increased until the end of the acquisition, whereas in patients with high-grade tumors, uptake peaked between 5 and 15 min after injection and then decreased until the end of the acquisition. A representative example of a patient with a low-grade astrocytoma and a patient with a high-grade recurrent astrocytoma and the respective time courses of 18F-FET uptake are shown in Figure 2. Uptake changes over time for low- and high-grade tumors were similar between the subgroup of oligoastrocytomas and the respective astrocytomas; however, absolute values were higher in the former than in the latter.
18F-FET PET Results of Standard Method Applied to Single Time Frames of Dynamic Evaluation (Mean ± SD) and Statistical Differences Between Histopathologic Groups
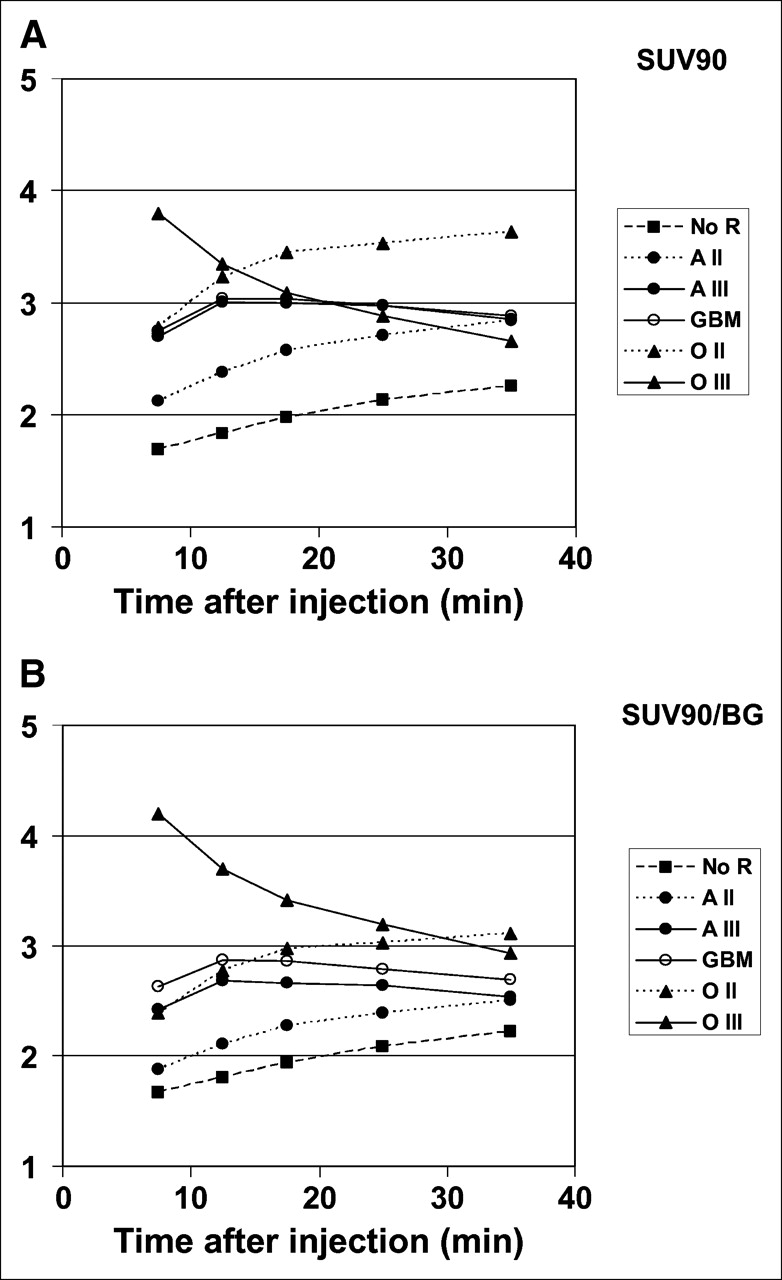
Course of 18F-FET uptake between frame 12 and frame 16 (5–40 min after injection) for patients without tumor recurrence (no R) and patients with recurrent astrocytoma WHO II (A II), WHO III (A III), or WHO IV (GBM), as well as for patients with recurrent oligoastrocytoma WHO II (O II) and oligoastrocytoma WHO III (O III): SUV90 values (A) and respective ratios to background (SUV90/background) (B).
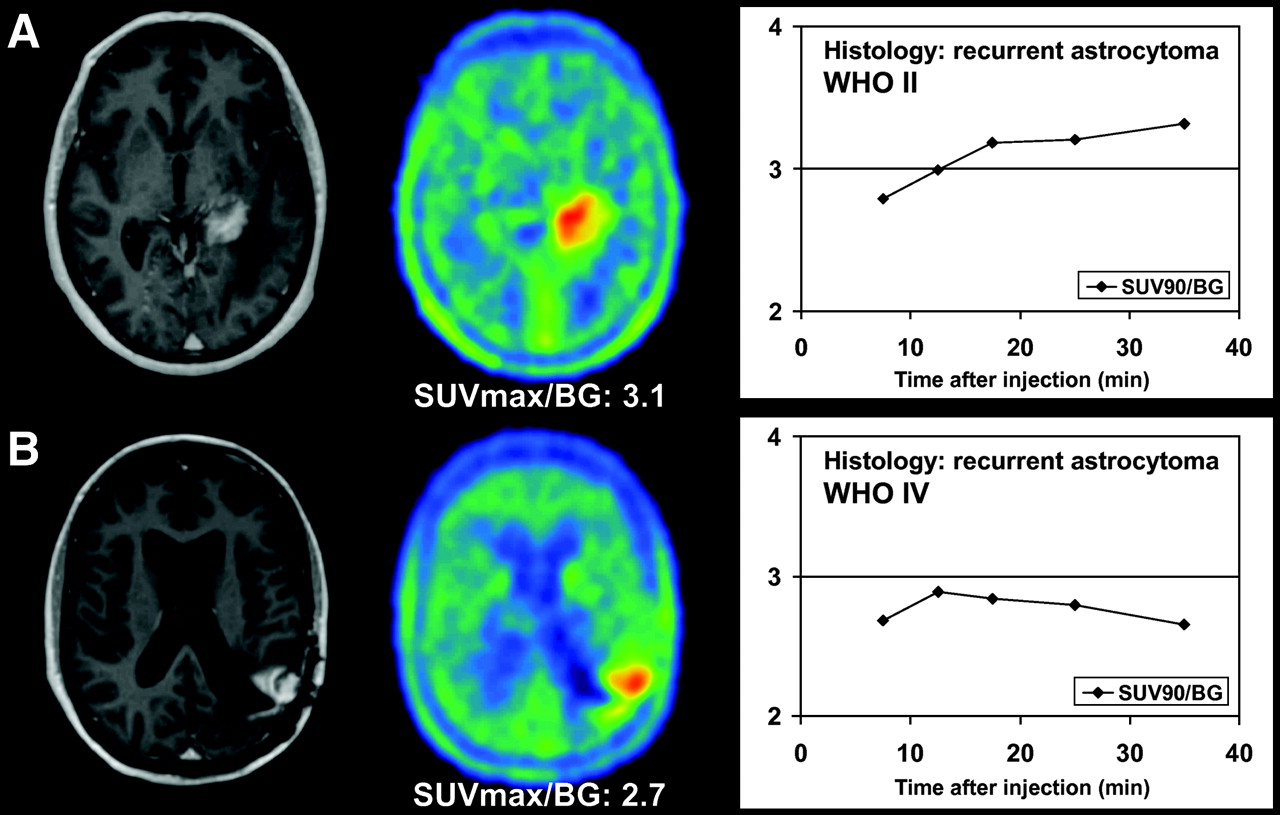
Examples of kinetic behaviors of low-grade (A) and high-grade (B) astrocytomas. Both studies show pathologic contrast enhancement on T1-weighted MRI as well as focal 18F-FET uptake (SUVmax-to-background ratios [SUVmax/BG] of standard ratio method are given below PET images). (A) 46-y-old woman after 125I-seed implantation for astrocytoma, WHO II. Dynamic evaluation shows increasing SUV90-to-background ratios (SUV90/BG) until end of acquisition. Histopathologic diagnosis is WHO II recurrence. (B) 40-y-old woman after surgery, 125I-seed implantation, and external radiation therapy for initially low-grade astrocytoma, WHO II. Dynamic evaluation shows peak of 18F-FET uptake 10–15 min after injection, followed by slightly decreasing SUV90/BG thereafter, indicating malignant transformation. Histopathologic diagnosis is WHO IV recurrence.
Compared with the standard method, single-time-frame analysis of frames 12 and 13 allowed differentiation at a higher level of significance (P < 0.01) between patients with and patients without recurrence. ROC analyses of the single-time-frame evaluation also demonstrated a notably higher ability to discriminate between low- and high-grade astrocytomas when the early acquisition period was considered (SUV90 for frame 12: 85% sensitivity, 62% specificity, and 0.737 AUC; SUV90-to-background ratio for frame 12: 96% sensitivity, 62% specificity, and 0.793 AUC; SUV90 for frame 13: 96% sensitivity, 62% specificity, and 0.749 AUC; SUV90-to-background ratio for frame 13: 100% sensitivity, 62% specificity, and 0.811 AUC).
Time to Peak Analysis.
For all tumor-free patients and 14 of 16 patients with low-grade recurrence, the individual peak of 18F-FET uptake occurred in the last time frame (frame 16, 30–40 min after injection). Both of the other patients (1 recurrent astrocytoma, WHO II, and 1 recurrent oligoastrocytoma, WHO II) showed maximal 18F-FET uptake in frame 14 (15–20 min after injection). Of the group of patients with recurrent WHO III tumors (n = 10 patients/11 biopsies), 5 patients showed peak uptake in frame 13, 3 patients in frame 14, and 2 patients in frame 16. In the patient with recurrent oligoastrocytoma, WHO III, the peak had already occurred by frame 12. Of the patients with WHO IV recurrence (n = 15 patients/16 biopsies), 3 patients showed their peak in frame 12, 8 patients in frame 13, 2 patients in frame 14, and only 2 patients in frame 16.
On the basis of this simple analysis of time to peak uptake using frame 16 as the decision threshold for low-grade tumors and frames 15 and below for high-grade tumors, the sensitivity and specificity in differentiating low-grade from high-grade tumors were 85% and 88%, respectively.
Parameters Accounting for Individual Time Course of 18F-FET Uptake.
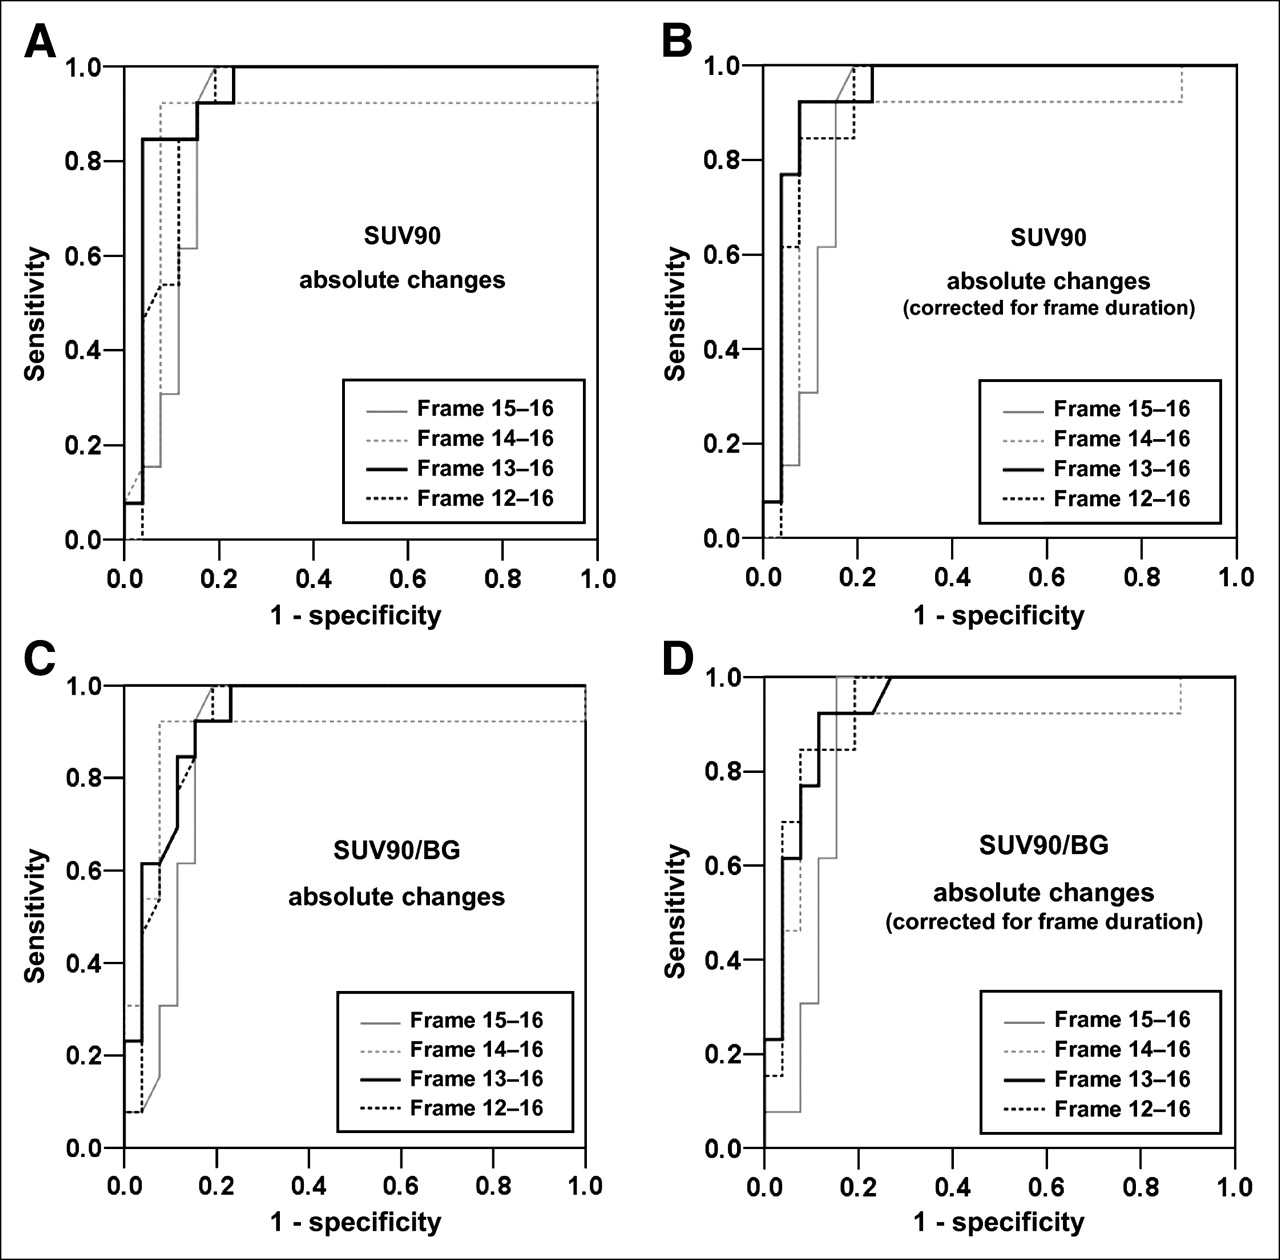
The results of the detailed analytic approaches toward dynamic data with respect to their power to differentiate between low- and high-grade astrocytomas are given in Table 4. The discriminatory power of these parameters was the highest of all those analyzed. In general, calculations based on SUV90 and SUV90-to-background ratio provided results in a similar range. The best differentiation between low- and high-grade recurrent astrocytomas, however, was reached by using the parameter addressing the sum of absolute changes of SUV90 and, in addition, by correcting the respective value for frame duration. The ROC curves of both these analyses are plotted in Figure 3. These parameters performed best for the acquisition period from 10 to 40 min after injection (frames 13–16). The parameter addressing the curve integral performed slightly less well.
Parameters Accounting for Individual Time Course of 18F-FET Uptake in Patients with Low- and High-Grade Astrocytomas (n = 39), with Respective Results of ROC Analyses (AUC) and Sensitivity/Specificity Pairs

ROC curves of parameters accounting for individual time course of 18F-FET uptake. Sum of absolute changes over time for SUV90 (A), SUV90-to-background ratio (B), and respective values corrected for frame duration (C and D) demonstrate high diagnostic performance for these methods in differential diagnosis of low- versus high-grade astrocytomas. Diagnostic optimum was obtained for calculation of absolute changes of SUV90 corrected for frame duration covering period from frames 13 to 16 (10–40 min after injection). SUV90/BG = SUV90-to-background ratio.
General Observations
None of the different dynamic parameters allowed reliable differentiation of tumor-free patients from patients with low-grade recurrence or of patients with high-grade WHO III recurrence from patients with WHO IV recurrence.
DISCUSSION
The value of PET using amino acid tracers for tumor grading is still controversial (11,12,16–18). Even though amino acid uptake has been shown to correlate with cell proliferative activity (16,17) and microvessel density (23) and seems to represent a prognostic factor (24), the use of standard, ratio-based methods has shown a marked overlap between the tumor classes. Therefore, neither for primary tumors (11,12,25) nor for recurrent tumors (15) has a reliable differentiation between low and high grades, especially between WHO grades II and III, been achieved with this approach. Recently, however, the debate has been newly stimulated by a report on 18F-FET uptake kinetics in untreated glioma patients showing a significantly different uptake between low- and high-grade gliomas in the early phase (0–10 min after injection) but not in the later period (30–40 min after injection) (10). On the basis of their results, the authors hypothesized that differentiation between low- and high-grade gliomas might be possible by taking their different kinetic behaviors into account.
Following this hypothesis, we wanted to substantially extend the reported observations by adding various new aspects. First, we investigated glioma patients who had completed multimodal treatment, for whom establishing a diagnosis is even more challenging because of posttherapeutic changes. Second, we markedly extended the dynamic analysis by introducing various new parameters, with the aim of defining the most suitable one. Third, we compared the results of the dynamic evaluations with those of a standard, ratio-based method.
As expected, the standard method was able to differentiate patients without recurrence from those with recurrence. Even though the significance of this observation is limited because of the small number of tumor-free patients (n = 4), the ability of 18F-FET PET using the standard method to reliably distinguish between tumor recurrence and therapy-induced benign effects has already been assessed in a larger population (15). More important, in line with data in the literature (10–12), we observed only a low ability to discriminate between low- and high-grade recurrences. Optimal sensitivity/specificity pairs of 73%/54% (SUVmax) and 62%/62% (SUVmax-to-background ratio) were disappointing and disqualify this approach for that purpose. In contrast, the same type of analysis applied only to time frames of the early phase, between 5 and 15 min after injection, markedly increased its diagnostic potential (100% sensitivity and 62% specificity). Plotting the time course of SUV90 and SUV90-to-background ratio showed an early peak of 18F-FET uptake between 5 and 15 min after injection in high-grade recurrence and a decrease thereafter, whereas low-grade tumors had a more slowly increasing uptake peaking at the end of the scan. This behavior makes evident that single-frame analysis of only the early uptake phase will allow differentiation between low- and high-grade recurrences, because the most significant spread of 18F-FET uptake was seen in this period (P < 0.01) whereas later curves merged and ended at almost the same level.
A simple evaluation of time to peak uptake allowed a correct prediction of histologic grading in 14 of 16 recurrent low-grade tumors and in 23 of 27 recurrent high-grade tumors (85% sensitivity and 88% specificity). The parameters accounting for the individual time course of 18F-FET uptake were able to differentiate low-grade from high-grade recurrent astrocytomas with the highest diagnostic accuracy. The diagnostic optimum was achieved for the parameter addressing changes from frame to frame corrected for the frame duration from 10 to 40 min after injection. This parameter resulted in a sensitivity and specificity of 92% and an AUC of 0.944. Generally, evaluation of percentage changes was not superior to evaluation of absolute changes. The integral of the curve showed slightly lower diagnostic accuracy than did the above-mentioned approaches.
Differentiation between high-grade WHO III and IV tumors was possible neither with the standard evaluation nor with any of the dynamic parameters. Nevertheless, for treatment decisions the most important factors are the reliable discrimination of tumor-free patients from those with tumors (by using standard methods or, at a higher level of significance, by calculating 18F-FET uptake in the early phase) and the differentiation of patients with low-grade tumors from those with high-grade tumors. The latter factor has a major impact on therapeutic management. Low-grade recurrences allow one to await the further course of the disease without treatment when symptoms are absent or to apply only low-grade conforming treatments when symptoms are present. In contrast, high-grade recurrences require either aggressive treatment as early as possible or just palliative care in cases that cannot be treated.
Some methodologic assumptions require further comment. In contrast to the standard method (SUVmax), for dynamic evaluations the SUV was determined within a 90% isocontour threshold. This threshold was arbitrarily set. Choosing lower thresholds may have provided more false-negative results in high-grade tumors because the ROI might then have also covered areas of benign posttherapeutic lesions in cases of very small tumors. In contrast, higher thresholds might have resulted in very small ROIs (at the extreme, 1 pixel in SUVmax), which might have been more susceptible to errors from low counting rates in the comparatively short single-frame sampling periods. Because analyses of SUVs generally provided similar or even better diagnostic information than did the respective ratios to the background, no clear rationale exists for using the latter in future projects.
In general, oligoastrocytomas showed higher uptake than did astrocytomas, but the two had the same characteristic time course. Because of the higher 18F-FET uptake that consequently resulted in higher values for absolute changes from frame to frame, the oligoastrocytoma subgroup was excluded from analyses accounting for the individual time course of 18F-FET uptake. In our view, this exclusion was justified to avoid an overestimation of results related to few subjects.
Several factors may contribute to the different kinetic behaviors of low- and high-grade tumors. Weckesser et al. (10) suggested that the higher initial uptake in high-grade tumors might be due to a higher regional blood volume as a consequence of increased angiogenesis and intratumoral microvessel density in patients with malignant progression (26). Another explanation has been offered by Miyagawa et al. (27), who suggested that facilitated amino acid transport, which is most responsible for increased 18F-FET uptake in gliomas (8,9), is upregulated by an increased amino acid transporter expression in tumor vessels. Both factors may contribute to a higher initial uptake in high-grade than in low-grade tumors, as was further supported by the findings of Kracht et al., who demonstrated that angiogenesis and increased amino acid uptake are closely related in gliomas (23).
Once having penetrated the cell, 18F-FET is not incorporated into proteins (8). The mechanism responsible for retaining 18F-FET within the cell is still unknown (8). After the early uptake period, high-grade tumors showed stable or slightly decreasing 18F-FET uptake whereas low-grade tumors showed slightly increasing values until the end of the scan. Weckesser et al. (10) have suggested that the disruption of the blood–brain barrier in high-grade gliomas may ease the passive backdiffusion of 18F-FET, especially of unbound tracer, and be responsible for the faster decrease of uptake in high-grade than in low-grade tumors. We consider this mechanism not likely to be the only explanation, because in our pretreated patients, differentiation between low- and high-grade tumors based on kinetic behavior was still possible despite their exhibiting contrast enhancement on MRI indicating blood–brain barrier disruption. Even though we cannot provide other satisfactory biologic explanations for our findings, we favor possible differences in amino acid transport characteristics as playing the more dominant role.
In this context, another possible explanation deserving discussion is the degree of exchange with endogenous amino acids. Competitive inhibition studies using 2-aminobicyclo-[2.2.1]-heptane-2-carboxylic acid (system L) and 2-methylaminoisobutyric acid plus serine (systems A and ASC) have shown that 18F-FET is transported solely by the bidirectional transport system L (9). The activity of system L, however, is related to cellular growth conditions and is mediated by changes in cellular amino acid levels (28,29). Transport of an amino acid by exchange can occur in either direction. For this reason, loss of intracellularly accumulated amino acids, such as unbound and unmetabolized 18F-FET, might be partly explained by exchange transport.
In vitro and animal studies are warranted to further clarify the molecular fundamentals of the differences in kinetic behavior between low- and high-grade tumors.
CONCLUSION
This study has shown differences in the kinetic behavior of 18F-FET uptake between recurrent low- and high-grade gliomas after multimodal treatment. Suitable parameters addressing these differences in kinetic behavior allowed the prediction of low- and high-grade recurrent glioma with high diagnostic power (92% sensitivity and specificity). Thus, the techniques introduced here are clearly superior to the yet most widely used standard method. Even though the results presented are promising, larger studies have to answer whether and under which circumstances the results of dynamic 18F-FET evaluations might be suitable for contributing to histologic confirmation. Current investigations focus on the question of whether this approach may modify the indications for and timing of further histologic confirmation in high-risk and functionally important areas.
Acknowledgments
Part of this work was supported by grant 10-3163-Wi3 from Deutsche Krebshilfe.
References
- Received for publication October 13, 2005.
- Accepted for publication December 15, 2005.


Jump to section
Related Articles
Cited By...
- Early Postoperative 18F-FET PET/MRI for Pediatric Brain and Spinal Cord Tumors
- Determination of an Optimal Pharmacokinetic Model of 18F-FET for Quantitative Applications in Rat Brain Tumors
- Influence of Bevacizumab on Blood-Brain Barrier Permeability and O-(2-18F-Fluoroethyl)-L-Tyrosine Uptake in Rat Gliomas
- Biological tumor volume in 18FET-PET before radiochemotherapy correlates with survival in GBM
- The Usefulness of Dynamic O-(2-18F-Fluoroethyl)-L-Tyrosine PET in the Clinical Evaluation of Brain Tumors in Children and Adolescents
- Prognostic Significance of Dynamic 18F-FET PET in Newly Diagnosed Astrocytic High-Grade Glioma
- Comparison of the Amino Acid Tracers 18F-FET and 18F-DOPA in High-Grade Glioma Patients
- Prediction of Glioma Recurrence Using Dynamic 18F-Fluoroethyltyrosine PET
- Dynamic 18F-FET PET in Newly Diagnosed Astrocytic Low-Grade Glioma Identifies High-Risk Patients
- Role of O-(2-18F-Fluoroethyl)-L-Tyrosine PET as a Diagnostic Tool for Detection of Malignant Progression in Patients with Low-Grade Glioma
- 18F-AFETP, 18F-FET, and 18F-FDG Imaging of Mouse DBT Gliomas
- Diagnostic Performance of 18F-FET PET in Newly Diagnosed Cerebral Lesions Suggestive of Glioma
- Comparative Evaluation of 18F-Labeled Glutamic Acid and Glutamine as Tumor Metabolic Imaging Agents
- Role of O-(2-18F-Fluoroethyl)-L-Tyrosine PET for Differentiation of Local Recurrent Brain Metastasis from Radiation Necrosis
- Accurate Differentiation of Recurrent Gliomas from Radiation Injury by Kinetic Analysis of {alpha}-11C-Methyl-L-Tryptophan PET
- Predominant influence of MGMT methylation in non-resectable glioblastoma after radiotherapy plus temozolomide
- Correlation of 6-18F-Fluoro-L-Dopa PET Uptake with Proliferation and Tumor Grade in Newly Diagnosed and Recurrent Gliomas
- Comparison of O-(2-18F-Fluoroethyl)-L-Tyrosine and L-3H-Methionine Uptake in Cerebral Hematomas
- Kinetics of 3'-Deoxy-3'-18F-Fluorothymidine During Treatment Monitoring of Recurrent High-Grade Glioma
- Angiogenesis as a Therapeutic Target in Malignant Gliomas
- Tumor Cell Metabolism Imaging
- Metabolic Imaging of Cerebral Gliomas: Spatial Correlation of Changes in O-(2-18F-Fluoroethyl)-L-Tyrosine PET and Proton Magnetic Resonance Spectroscopic Imaging
- 18F-FDOPA Kinetics in Brain Tumors
- Prognostic Value of O-(2-18F-Fluoroethyl)-L-Tyrosine PET and MRI in Low-Grade Glioma