


Abstract
Because the clinical course of low-grade gliomas in the individual adult patient varies considerably and is unpredictable, we investigated the prognostic value of dynamic 18F-fluorethyltyrosine (18F-FET) PET in the early diagnosis of astrocytic low-grade glioma (World Health Organization grade II). Methods: Fifty-nine patients with newly diagnosed low-grade glioma and dynamic 18F-FET PET before histopathologic assessment were retrospectively investigated. 18F-FET PET analysis comprised a qualitative visual classification of lesions; assessment of the semiquantitative parameters maximal, mean, and total standardized uptake value as ratio to background and biologic tumor volume; and dynamic analysis of intratumoral 18F-FET uptake over time (increasing vs. decreasing time–activity curves). The correlation between PET parameters and progression-free survival, overall survival, and time to malignant transformation was investigated. Results: 18F-FET uptake greater than the background level was found in 34 of 59 tumors. Dynamic 18F-FET uptake analysis was available for 30 of these 34 patients. Increasing and decreasing time–activity curves were found in 18 and 12 patients, respectively. Neither the qualitative factor presence or absence of 18F-FET uptake nor any of the semiquantitative uptake parameters significantly influenced clinical outcome. In contrast, decreasing time–activity curves in the kinetic analysis were highly prognostic for shorter progression-free survival and time to malignant transformation (P < 0.001). Conclusion: Absence of 18F-FET uptake in newly diagnosed astrocytic low-grade glioma does not generally indicate an indolent disease course. Among the 18F-FET–positive gliomas, decreasing time–activity curves in dynamic 18F-FET PET constitute an unfavorable prognostic factor in astrocytic low-grade glioma and, by identifying high-risk patients, may ease treatment decisions.
World Health Organization (WHO) grade II (low-grade) gliomas in adult patients are known to comprise a heterogeneous group of primary brain tumors with highly variable clinical outcome (1,2). Although some patients experience an indolent disease course for years even without any treatment, others present with rapid tumor progression and malignant transformation to high-grade glioma and die within months from initial diagnosis (3). Several prognostic factors influencing the disease course have been proposed, such as patient age, histologic subtype, and tumor diameter (4). Recently, different molecular-genetic factors have been shown to correlate with outcome, in particular TP53 mutations and isocitrate dehydrogenase gene mutation (IDH1) in astrocytic gliomas (5–8).
Because the natural disease course is not yet predictable in the individual patient, treatment strategies for low-grade glioma remain a matter of controversy and therapeutic options vary considerably, ranging from a wait-and-see strategy to local treatment regimens (e.g., surgical resection and stereotactic brachytherapy) and adjuvant chemo- or radiotherapy. The choice of the optimal treatment strategy, however, is challenging and represents a tightrope walk between potentially harmful overtreatment and insufficient treatment of more aggressive low-grade glioma.
To optimize the management of treatment for the individual patient, a better stratification of patients with high-risk low-grade glioma and low-risk low-grade glioma is strongly needed. In recent years, dynamic PET using the amino acid analog 18F-fluorethyltyrosine (18F-FET) has gained increasing interest, as it was shown to reliably depict glioma tissue. Furthermore, additional information for differentiation between low- and high-grade gliomas by kinetic analysis has been proposed by various groups (9–12) but is still a matter of controversy.
In the current study, we systematically investigated the prognostic value of dynamic 18F-FET PET analysis, including both static and kinetic parameters, for a large cohort of patients with newly diagnosed astrocytic low-grade glioma.
MATERIALS AND METHODS
Inclusion Criteria
We retrospectively identified adults with newly diagnosed, untreated supratentorial WHO grade II astrocytoma who, between 2005 and 2011, had undergone 18F-FET PET at the University of Munich, Germany. The study was approved by the ethical review board of the University of Munich. All patients gave written informed consent before each 18F-FET PET investigation as part of the clinical routine.
MR Imaging
MR imaging was performed according to standard protocols (11,13). The MR imaging protocols included acquisition of axial T2-weighted sequences and 3-dimensional T1-weighted sequences with a slice thickness of 1 mm before and after administration of an intravenous contrast agent (gadobenate dimeglumine, 0.1 mmol/kg [MultiHance; BraccoImaging]). We also assessed presence of contrast enhancement, midline crossing, and largest tumor diameter on T2-weighted sequences.
18F-FET PET Image Acquisition and Assessment
Forty-minute dynamic 18F-FET PET scans were acquired with an ECAT Exact HR+ scanner (Siemens) according to standard protocols (12,14).
Static and dynamic 18F-FET PET data were evaluated as described previously on a Hermes workstation (Hermes Medical Solutions) (12). In a first visual analysis, tumors were evaluated qualitatively and categorized in 18F-FET–negative lesions (with reduced or equal uptake when compared with healthy brain tissue) and 18F-FET–positive lesions (with uptake greater than the cortical background activity [BG]).
Semiquantitative evaluation included assessment of the maximal standardized uptake value (SUVmax) of the tumor corrected for the mean BG in the healthy contralateral hemisphere (SUVmax/BG), an estimated biologic tumor volume (BTV) as defined by semiautomatic threshold-based calculation of a volume of interest (SUV/BG ≥ 1.8), the mean tracer uptake within the BTV (SUVmean/BG), and the total tumoral uptake volume (SUVtotal/BG = SUVmean/BG × BTV) to accommodate the differing sizes of the lesions.
Dynamic PET recordings were evaluated according to our standardized clinical procedure using the software PET Display Dynamic implemented in the Hermes workstation as described previously (12). The early summation image (10–30 min after injection) was used for the definition of a 90% isocontour threshold region of interest, which was semiautomatically generated for each individual slice within the area of 18F-FET uptake. Subsequently, these regions of interest were applied to the corresponding slices of the entire set of dynamic PET images to extract individual time–activity curves for the kinetic analysis. Two different types of tumor time–activity curves were defined: tumors with increasing time–activity curves, with SUVs constantly ascending or reaching a peak followed by a plateau in the subsequent frames throughout all slices, and tumors with decreasing time–activity curves, with SUVs showing a peak followed by a constant descent (12,15), either homogeneously in all slices throughout the tumor or heterogeneously in at least 2 adjacent slices. Figure 1 shows a heterogeneous time–activity curve pattern within the tumor in a patient with low-grade glioma.
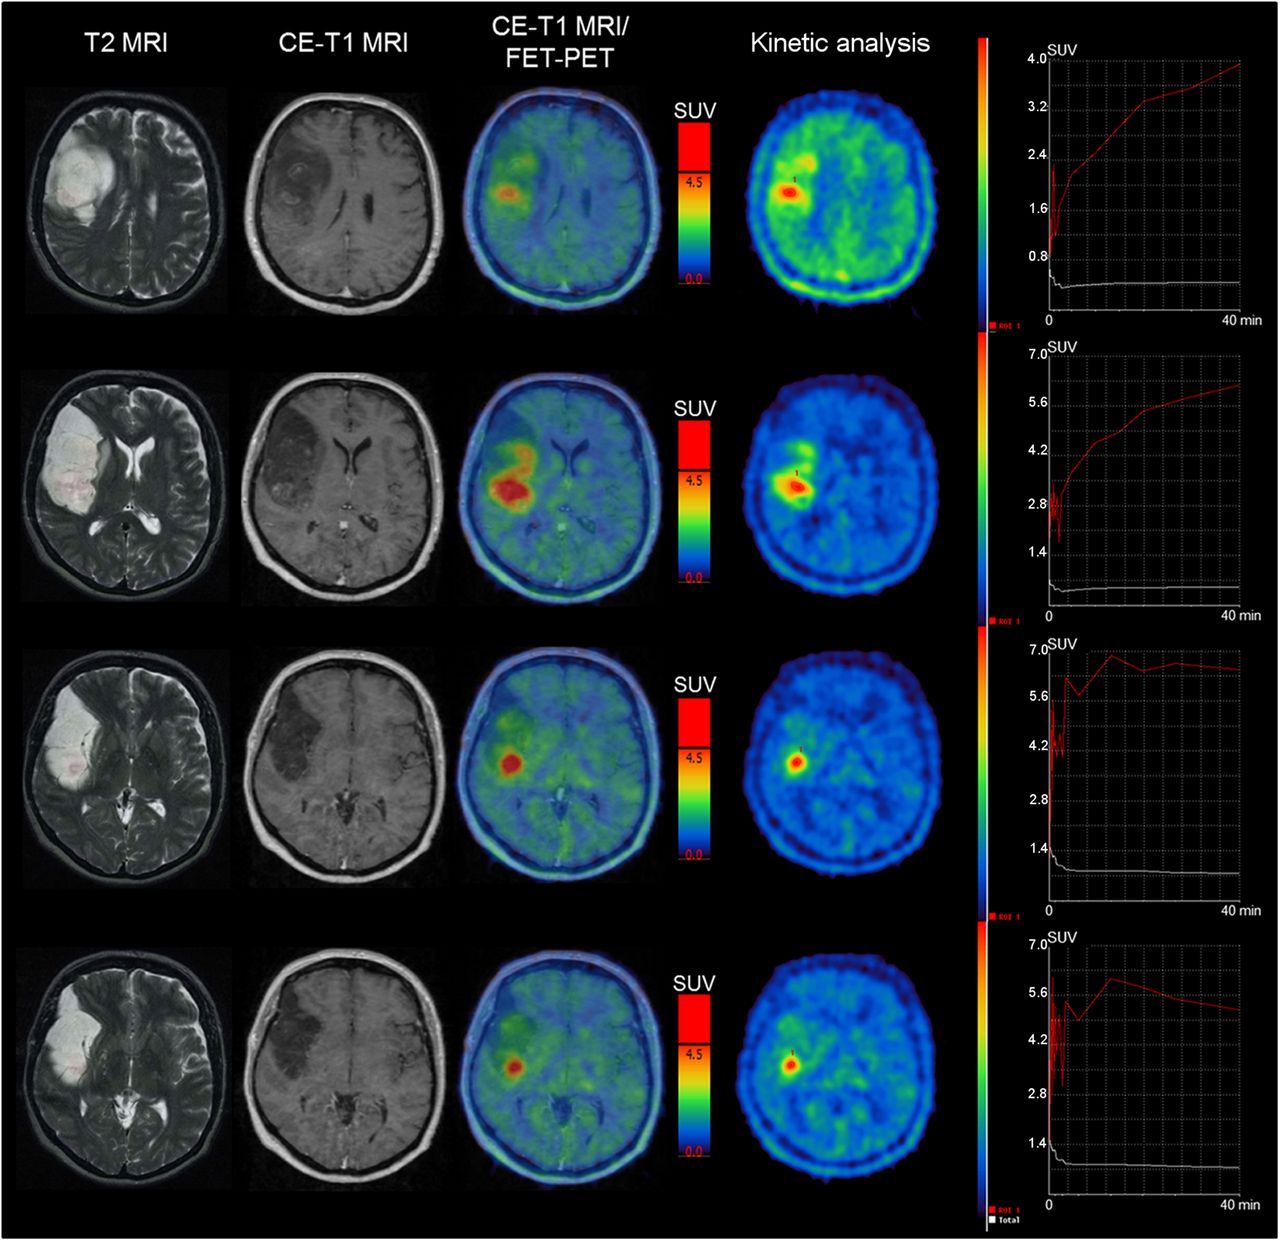
Axial MR images (T2-weighted and contrast-enhanced [CE] T1-weighted) and corresponding 18F-FET PET images (including time–activity analysis) of patient with histologically confirmed low-grade glioma. Tumor showed contrast enhancement on MR imaging and heterogeneous 18F-FET uptake. Area of 18F-FET uptake was larger than area of contrast enhancement. Additional kinetic analysis revealed increasing time–activity curves in cranial portion of tumor but decreasing time–activity curves in 4 adjacent slices of lower portions of tumor. Tumor was classified as having decreasing time–activity curves.
Tissue Sampling and Histologic Evaluation
PET-guided stereotactic biopsy procedures or neuronavigated microsurgery with MR imaging and PET image fusion (Brainlab) were used to ensure a spatially precise tissue-sampling procedure throughout the tumors under investigation (8). The mean number of tissue samples per patient was 5.
Histologic classification and tumor grading were performed according to the current WHO guidelines at the respective time point of histopathologic assessment (16).
Patient Evaluation
The primary endpoint of the study was tumor progression; secondary endpoints were malignant transformation and death. Progression-free survival (PFS) was calculated from the baseline PET examination to the first event of clinical deterioration, that is, new neurologic symptoms, worsening as indicated by Karnofsky performance score or an increase in administered steroid medication, or tumor growth on conventional MR imaging according to RANO criteria (17) or on additional 18F-FET PET images, especially in cases of unclear findings suggestive of pseudoprogression (e.g., after stereotactic brachytherapy (18)). When indicated, tumor progression was verified by histologic analysis of tissue specimens obtained by stereotactic biopsy. Time to malignant transformation (TTM) and overall survival (OS) were correspondingly measured from the baseline PET scan to the date of histologic diagnosis of malignant transformation and death, respectively.
Statistical Analysis
SPSS for Windows (version 17.0; IBM) was used for statistical calculations.
For univariate testing, all 18F-FET PET parameters, as well as other patient-, tumor- and treatment-related factors, were included. Numbers of events in the overall population and within the 18F-FET PET–defined subgroups did not allow for multivariate testing. The prognostic influence of categoric variables on OS, PFS, and TTM were calculated with the Kaplan–Meier method using the log-rank test. The prognostic influence of continuous parameters was tested using univariate proportional hazards models. To evaluate significant differences in the distribution of categoric parameters, the χ2 test was performed. Continuous parameters were reported as mean ± SD and range. A 2-tailed P value of less than 0.05 was considered significant.
RESULTS
Patient Characteristics
Fifty-nine adult patients (mean age ± SD, 42.6 ± 11.3 y; 32 men and 27 women) with newly diagnosed diffuse astrocytoma were identified. In 11 patients, tumors showed contrast enhancement on the initial MR imaging. Tissue specimens for histologic assessment were obtained by stereotactic biopsy in 52 patients and by microsurgical resection in 7 patients. Patient characteristics are shown in Table 1 and in greater detail in Supplemental Table 1 (supplemental materials are available at http://jnm.snmjournals.org).
Characteristics of the 59 Patients with Astrocytic Low-Grade Glioma
Qualitative assessment of PET images revealed 25 18F-FET–negative and 34 18F-FET–positive cases. Kinetic analysis was available for 30 of these 34 18F-FET–positive patients: 18 of 30 patients exhibited increasing time–activity curves, and 12 of 30 presented with decreasing time–activity curves. Contrast enhancement on initial MR imaging was seen in 50.0% (6/12) of the tumors with decreasing time–activity curves but in only 27.8% (5/18) of those with increasing time–activity curves (P > 0.05). Detailed results for the 18F-FET PET parameters are presented in Table 2.
Qualitative, Semiquantitative, and Dynamic 18F-FET PET Parameters in Astrocytic Low-Grade Glioma
Follow-up Data
The median follow-up time of the overall population was 47.0 mo. At the time of the last follow-up, 29 of 59 patients had experienced tumor progression, of whom 21 presented with a histologically proven malignant transformation into anaplastic astrocytoma (11 patients) or glioblastoma (10 patients). Median PFS was 39.2 mo. Tumor progression or recurrence was proven by stereotactic rebiopsy in 24 patients; the remaining patients did not undergo histologic reevaluation because of progressive clinical deterioration, which was judged as local tumor recurrence or progression under consideration of MR imaging and PET follow-up data. Median TTM was not reached (mean, 58.2 mo). Among the patients with malignant transformation, 20 of 21 were confirmed histologically. Overall, 11 of 59 patients had died during the study period, 10 of them after histologically proven malignant transformation.
Among 18F-FET–negative glioma patients, 11 of 25 experienced tumor progression, 8 of them with malignant transformation, and 6 patients had died. In the 18F-FET–positive group, 18 of 34 patients had a progressive disease course, including 13 patients with malignant transformation and 5 patients who died. Median follow-up time did not differ between the groups. The rate of events (progression, malignant transformation, or death) and of PFS, TTM, and OS did not differ between 18F-FET–negative and 18F-FET–positive gliomas (Fig. 2). However, chemo- or radiotherapy were applied more often to patients with 18F-FET–positive gliomas (15/34), whereas careful observation or mere application of localized treatment strategies (resection/brachytherapy) were more frequent in the 18F-FET–negative group (22/25; P = 0.003).

Kaplan–Meier estimates for astrocytic low-grade glioma stratified by qualitative 18F-FET uptake (18F-FET–positive vs. 18F-FET–negative) for PFS (A), TTM (B), and OS (C). No significant differences exist between 18F-FET–positive and 18F-FET–negative gliomas.
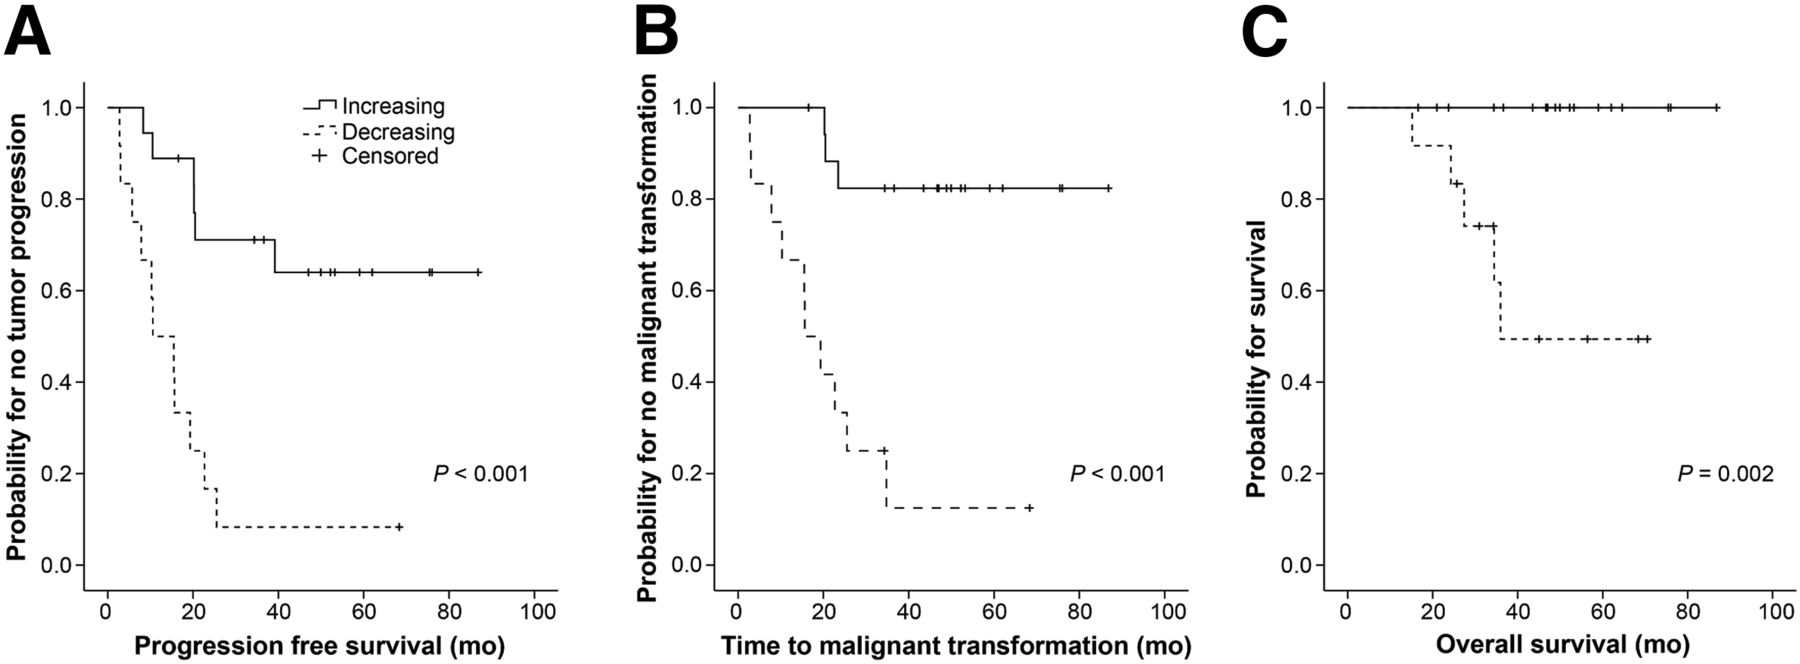
Among those 18F-FET–positive patients with increasing time–activity curves, 6 of 18 presented with tumor progression, 3 of them with malignant transformation, but none had died. In the subgroup of 18F-FET–positive low-grade glioma with decreasing time–activity curves, 11 of 12 patients experienced tumor progression, including 10 with malignant transformation and 5 who died. No difference was found in the applied treatment regimens between groups (P = 0.97). Overall, patients with increasing time–activity curves presented with significantly longer PFS (P ≤ 0.001), TTM (P ≤ 0.001), and OS (P = 0.002; Fig. 3).

Kaplan–Meier estimates for astrocytic low-grade glioma stratified by time–activity curves (increasing vs. decreasing) for PFS (A), TTM (B), and OS (C). Highly significant differences exist, with better outcome for gliomas with increasing vs. decreasing time–activity curves.
In the univariate analyses, we tested for the factors sex, age (continuously and categorically < 40 y vs. ≥ 40 y), Karnofsky performance score (continuously and categorically ≥ 90 vs. < 90), treatment strategy (wait-and-see vs. local treatment [resection and brachytherapy] vs. adjuvant chemo- or radiotherapy), contrast enhancement on initial MR imaging (no vs. yes), largest tumor diameter on MR imaging (<6 cm vs. ≥ 6 cm), tumor crossing midline (no vs. yes), qualitative 18F-FET uptake (18F-FET–negative vs. 18F-FET–positive), semiquantitative parameters (SUVmax/BG, SUVmean/BG, SUVtotal/BG, BTV), and time–activity curves (increasing vs. decreasing). For PFS, largest tumor diameter on MR imaging and time–activity curves were identified as the only significant univariate factors (P = 0.01 and P < 0.001; Table 3). For TTM, significant results were found for sex (P = 0.02), age (P = 0.01), and time–activity curves (P < 0.001). For OS, only time–activity curves were significant (P = 0.002).
P Values for Determination of Prognostic Factors Regarding Tumor Progression
DISCUSSION
Molecular genetic profiles and metabolic imaging data are increasingly being integrated into the diagnostic framework and prognostic evaluation of patients with MR imaging–suspected low-grade gliomas. In particular, PET imaging has gained increasing value, especially PET using radiolabeled amino acids or amino acid analogs, which overcome the limitation of 18F-FDG PET by showing high tumor-to-background contrast due to the relatively low uptake in healthy brain tissue. A variety of radiotracers has been proposed, such as 11C-methionine, the 18F-labeled FET, and 18F-fluorodopa. The first 18F-fluorodopa studies have indeed provided promising results, and uptake of 18F-fluorodopa in gliomas was previously shown to correlate with the proliferation index (19). However, a high physiologic uptake in the basal ganglia limits the diagnostic accuracy when the tumor is close to the basal ganglia. Many studies have focused on 11C-methionine, which enabled an accurate delineation of gliomas even in non–contrast-enhancing gliomas (20); however, its use in clinical practice is restricted to centers with an on-site cyclotron. Therefore, the fluorinated amino acid analog 18F-FET has emerged as a powerful complementary tool for glioma imaging (21,22). 18F-FET PET was shown to be useful for biopsy and treatment planning by accurate delineation of the tumor borders and demarcation of most malignant tumor parts (11,21,23–25) and for subsequent treatment monitoring including differentiation between benign therapy-induced changes and tumor recurrence (13,18,26–28). Furthermore, the additional use of kinetic analysis of 18F-FET PET was shown to enable more accurate tumor grading, even in individual patients: increasing time–activity curves are considered to be associated with less malignant low-grade glioma tissue, whereas decreasing time–activity curves were shown to be prevalent in more aggressive high-grade glioma tissue (9,10). In addition, the identification of high-grade glioma by decreasing time–activity curves was previously shown to have high sensitivity even in lesions with low or diffuse 18F-FET uptake, which would easily be misclassified considering the static PET images alone (12).
To our knowledge, this was the first study systematically investigating the prognostic value of both static and dynamic 18F-FET PET data in patients with histologically verified, untreated astrocytic low-grade glioma. Low-grade glioma with an oligodendroglial phenotype was not addressed, as these tumors differ considerably with respect to clinical prognosis (29,30) and 18F-FET uptake characteristics (9,10,12).
In accordance with a previous study (31), the semiquantitative 18F-FET parameters SUVmax/BG, SUVmean/BG, SUVtotal/BG, and BTV did not correlate with outcome measurements. Moreover, not even the qualitative factors “presence” or “absence” of 18F-FET uptake within the tumor gained prognostic influence, since outcome did not differ between 18F-FET–negative and 18F-FET–positive patients in our study. The latter finding, however, seems to contradict data from a previous report (31) showing that 18F-FET–negative low-grade glioma had a significantly better outcome than 18F-FET–positive low-grade glioma. Differences between the studies might be explained by differences in the study populations (no inclusion of contrast-enhancing low-grade glioma or of 18F-FET–negative low-grade glioma with a diffuse MR pattern in the above-mentioned study) and applied treatment regimens: none of the patients in the study of Floeth et al. received chemo- or radiotherapy (31). In our study, however, similar outcome scores for 18F-FET–negative and 18F-FET–positive tumors might partly be explained by more aggressive treatment selectively of 18F-FET–positive tumors and subsequently improved outcome scores. In total, taking into consideration the surprisingly high rate of malignant transformation in the 18F-FET–negative low-grade glioma, our results imply that 18F-FET–negative low-grade glioma cannot be generally interpreted as indolent glioma with low metabolic tumor activity.
The prognostic significance of amino acid uptake intensity in low-grade glioma still remains unclear. Even when comparing the results of the research group of Ribom et al., who investigated the impact of 11C-methionine uptake in low-grade glioma, one can find controversial results: although one study reported low 11C-methionine uptake to be an independent prognostically favorable factor in low-grade glioma along with oligodendroglial histology (32), a later study showed an impact of 11C-methionine uptake intensity on untreated oligodendroglial low-grade glioma but not on astrocytic low-grade glioma (33), and the latest study, in which 11C-methionine uptake was added as a prognostic factor to the European Organisation for Research and Treatment of Cancer criteria, an impact was found for the small group of “high-risk” patients only, and a similar trend was found for the “low-risk” patients with oligodendroglial tumors (34). For a better understanding of the prognostic impact of amino acid uptake, larger studies with clearly homogeneous patient groups stratified by histologic subtype and with similar patient management (e.g., all patients untreated or all with surgical resection) would be extremely helpful.
Among the 18F-FET–positive gliomas, kinetic analysis was shown to be the strongest predictor for the disease course of astrocytic low-grade glioma, since decreasing time–activity curves were related to significantly shorter PFS and TTM. It is worth mentioning, however, that our study comprised a relatively high rate of astrocytic low-grade glioma with decreasing time–activity curves when compared with other studies (12). This might, to a certain degree, be due to the inclusion of low-grade glioma with contrast enhancement on MR imaging, which showed a higher percentage of decreasing time–activity curves than those without contrast enhancement.
The remarkably strong correlation of decreasing time–activity curves, usually characteristic of high-grade glioma tissue, with worse prognosis leads to the following hypothesis. Decreasing time–activity curves may be caused by changes in the regional cerebral blood volume or in amino acid transport and turnover (e.g., due to hypervascularization, increased angiogenesis, higher intratumoral microvessel density, facilitated bidirectional amino acid transport, or impaired ability of cellular 18F-FET transport and retention) (12,35) and reflect more aggressive features of low-grade glioma with a more malignant phenotype, which remarkably can be identified by 18F-FET PET analysis but evade conventional histologic diagnosis.
This hypothesis is supported by perfusion-weighted MR imaging studies showing that regional cerebral blood volume is higher in patients who are undergoing malignant transformation and that the increases of regional cerebral blood volume can be seen up to 12 mo before contrast enhancement becomes apparent (36). Furthermore, the vascular density has been reported to be linked to early malignant transformation in gliomas (37) but is not a feature of anaplasia according to WHO. Moreover, a strong correlation has been described between regional cerebral blood volume and outcome, independently of the WHO grading. Accordingly, high perfusion has been identified as an unfavorable prognostic factor in astrocytomas (38–40). Future studies correlating perfusion-weighted MR imaging and dynamic 18F-FET PET data are needed to further test this hypothesis. Moreover, it will be interesting to see how stratification into high-risk and low-risk low-grade glioma according to 18F-FET PET criteria will correlate with molecular-genetic profiles.
CONCLUSION
18F-FET–negative astrocytic low-grade gliomas do not generally present with a benign course. Among 18F-FET–positive gliomas, decreasing time–activity curves in the kinetic analysis correlate with shorter PFS and faster malignant transformation. Therefore, dynamic acquisition of 18F-FET PET scans enables the identification of high-risk low-grade glioma patients and should be implemented for an optimized, individualized treatment management.
DISCLOSURE
The costs of publication of this article were defrayed in part by the payment of page charges. Therefore, and solely to indicate this fact, this article is hereby marked “advertisement” in accordance with 18 USC section 1734. The study was funded in part by the German Glioma Network, supported by German Cancer Aid (Deutsche Krebshilfe 70-3163-Wi 3). No other potential conflict of interest relevant to this article was reported.
Footnotes
Published online Dec. 30, 2013.
- © 2014 by the Society of Nuclear Medicine and Molecular Imaging, Inc.
REFERENCES
- Received for publication April 3, 2013.
- Accepted for publication September 10, 2013.


Jump to section
Related Articles
Cited By...
- Imaging Tumor Metabolism
- Amino Acid Tracer PET MRI in Glioma Management: What a Neuroradiologist Needs to Know
- 18F-FET PET Uptake Characteristics in Patients with Newly Diagnosed and Untreated Brain Metastasis
- Serial 18F-FET PET Imaging of Primarily 18F-FET-Negative Glioma: Does It Make Sense?
- Prognostic Significance of Dynamic 18F-FET PET in Newly Diagnosed Astrocytic High-Grade Glioma
- Clinical Impact of Amino Acid PET in Gliomas