


Abstract
Locally advanced breast cancer (LABC) is commonly treated with neoadjuvant chemotherapy followed by definitive surgery. The factors influencing the response of LABC to presurgical chemotherapy are incompletely understood. To characterize in vivo tumor biology in patients with LABC, we performed serial measurements of blood flow and glucose metabolism in LABC patients over the course of neoadjuvant chemotherapy and compared measurements with response. Methods: Thirty-five patients with newly diagnosed LABC underwent 18F-FDG and 15O-water PET imaging before therapy and after 2 mo of chemotherapy. Tumor metabolism was estimated from graphical analysis of dynamic 18F-FDG studies and was expressed as the metabolic rate of 18F-FDG (MRFDG). Blood flow was estimated from dynamic images after bolus 15O-water injection using a 1-compartment model. Metabolism and blood flow data were analyzed with and without partial-volume corrections to account for changes in tumor size over the course of therapy. Changes in tumor blood flow and metabolism were compared with response to chemotherapy and with patient survival. Results: For all patients, the mean MRFDG after 2 mo of chemotherapy decreased by 54% and the mean blood flow by 21%. Responders showed a greater decline in MRFDG than did nonresponders; however, the difference was of borderline significance (P = 0.05) after correction for partial-volume effects. Patients who responded had a decline in tumor blood flow, whereas nonresponders had an average increase (−32% vs. +48%, P < 0.005); the difference between responders and nonresponders remained significant after partial-volume correction (P < 0.01). There was also a statistically significant association between the pathologic degree of response and the percentage change in blood flow at 2 mo with and without partial-volume correction; this was not the case for MRFDG. The change in blood flow after 2 mo of therapy predicted disease-free and overall survival. Conclusion: Although both resistant and responsive LABC tumors have an average decline in MRFDG over the course of chemotherapy, resistant tumors have an average increase in blood flow. Patients whose tumors fail to have a decline in blood flow after 2 mo of therapy have poorer disease-free and overall survival. Further investigations are needed to elucidate the tumor biology underlying these findings.
Breast cancer that is greater than 5 cm in diameter, invades the chest wall or skin, has fixed lymph node metastases, or is inflammatory is defined as locally advanced breast cancer (LABC) (1,2). Current approaches to the treatment of LABC include chemotherapy given before definitive surgical therapy, termed neoadjuvant, primary, or induction chemotherapy (2). Although recent trials reported clinical response rates in excess of 70%, a smaller fraction of patients achieves a complete macroscopic response to therapy, defined as an absence of gross viable tumor at definitive surgery after therapy (3), which is a prognostically important endpoint (3,4). Despite the development of new techniques to characterize the biologic features of breast tumors, the factors influencing the quality of response to therapy remain obscure. Biologic markers have demonstrated an ability to predict breast cancer response to particular forms of therapy (5–7); however, the literature regarding such markers in neoadjuvant chemotherapy of LABC is sparse.
In a prior report (8), we showed that pretherapy PET measurements of blood flow and glucose metabolism, obtained using 15O-water and 18F-FDG, provided information on tumor biology that was distinct from standard clinical and pathologic data. High pretherapy tumor glucose metabolism, expressed as the metabolic rate of 18F-FDG (MRFDG), was associated with a poor response to neoadjuvant chemotherapy. Furthermore, a low ratio of glucose metabolism to blood flow predicted a complete response (CR) to chemotherapy and improved disease-free survival (DFS).
We now extend our earlier report to describe changes in tumor blood flow and metabolism over the course of neoadjuvant chemotherapy. The hypothesis underlying our study is that changes in glucose metabolism and blood flow over the course of treatment are predictive of ultimate response and survival in LABC patients treated with neoadjuvant chemotherapy. Several earlier reports have shown that serial 18F-FDG PET over the course of neoadjuvant chemotherapy accurately indicates tumor response compared with both clinical and pathologic measurements (9–13). Our work differs from the prior studies in two ways. The first of these differences is that we performed simultaneous measurements of both tumor blood flow and glucose metabolism over the course of treatment. Tumor blood flow is an indirect measure of angiogenesis, which has been shown to predict breast cancer aggressiveness and patient outcome (14,15). Changes in tumor blood flow in response to therapy may therefore provide insights into tumor behavior. The second difference is that in this study, we accounted for the influence of changes in tumor size over the course of therapy, using partial-volume corrections, to measure changes in tumor biologic properties independent of the influence of changes in tumor size on apparent tracer uptake.
Patients were studied before therapy and after 2 mo of chemotherapy based on clinical considerations. Two months is approximately halfway through the typical course of neoadjuvant chemotherapy and is also the earliest time point at which most clinicians are willing to change treatment if the selected chemotherapy has not elicited a tumor response (16). Previous studies of 18F-FDG PET in patients with LABC receiving neoadjuvant chemotherapy have also used this time point for serial imaging (9,10). If changes in blood flow or metabolism at 2 mo predict ultimate response, then these parameters could be used to help guide treatment and direct a change in therapeutic approach, if necessary. Furthermore, quantitative PET imaging provides unique measurements of in vivo tumor biology over the course of treatment that may provide insights into the factors affecting tumor response and resistance to neoadjuvant chemotherapy.
MATERIALS AND METHODS
Patient Selection
Patients presenting to the University of Washington Breast Cancer Specialty Center with LABC and being considered for neoadjuvant chemotherapy were eligible for the study. Patients were excluded if they were pregnant, unwilling or unable to undergo PET imaging studies, or not considered surgical candidates. Fifty-three patients were initially enrolled in the study and underwent pretherapy imaging. Thirty-five patients were included in this analysis of changes in metabolism and blood flow over the course of therapy; 25 of 35 were included in our previous pretherapy analysis (8). Of the 18 patients excluded from final analysis, 2 patients were unable to tolerate the imaging protocol, resulting in noninterpretable images due to significant motion during the study. One patient was excluded because of failure of the PET scanner 20 min into the follow-up study. 18F-FDG PET detected distant metastases (stage IV disease) on the pretherapy scan of 1 patient; when the metastases were confirmed, the patient no longer met the study eligibility criteria. Fourteen patients underwent pretherapy imaging but did not undergo repeated imaging. Of these 14 patients, 5 received neoadjuvant chemotherapy but were unable to undergo follow-up imaging, 5 elected not to receive neoadjuvant chemotherapy, 3 sought medical care at another institution, and 1 died from complications of concomitant cystic fibrosis. Although referring physicians were not unaware of the PET findings, those findings were not used to select therapy. Patients provided signed informed consent for PET studies according to the guidelines of the University of Washington Human Subjects Committee.
Pretherapy Clinical and Pathologic Parameters
Before the start of chemotherapy, patient age, menopausal status, tumor size, and the presence or absence of clinically positive lymph nodes, as assessed by the referring oncologist, were recorded. These factors, shown to have prognostic significance, were used in the survival analysis described below. Pretherapy biopsy samples were obtained by fine-needle aspiration, incisional biopsy, or core-needle biopsy. Measurements and in vitro assays to determine tumor histologic grade, estrogen receptor status, c-erbB-2 (HER2/Neu) expression, p53 overexpression, and Ki-67 (MIB1) index of tumor proliferation were performed as previously described (8).
Tumor Measurements and Assessment of Response
The modality providing the best definition of tumor size in the opinion of the referring medical oncologist was used to assess clinical response and included ultrasound, mammography, or physical examinations, as we have previously reported (8,17). A response was defined as a greater than 50% decline in the product of the 2 greatest perpendicular tumor dimensions (18). Patients not achieving this endpoint were classified as having no response (NR) clinically. Patients were judged to have a clinical CR when no viable tumor could be observed by diagnostic imaging or palpated by physical examination. Patients with a residual mass detected at the end of therapy and a minimum 50% reduction in the size of the mass were considered to have a partial response (PR) clinically.
Pathologic response was determined from the report of the pathologist performing gross and histopathologic evaluation of the posttherapy surgical breast specimen. By standard definitions, a macroscopic pathologic CR was defined as the absence of macroscopic tumor by gross examination at the time of surgery (3). This response endpoint has been used in several prior studies of neoadjuvant treatment of LABC and has been shown to carry prognostic significance (3,4). Patients with macroscopic abnormalities on gross pathology and minimal evidence of invasive tumor on histologic analysis were considered to have a macroscopic CR. Patients with a macroscopic CR were further classified as having a microscopic CR if no invasive tumor was seen by microscopic examination of the specimen. Patients with residual macroscopic tumor—that is, a pathologic response other than CR—were further classified as having NR or a PR by comparison with pretherapy clinical size measurements. Pathologic lack of response in patients with NR clinically was confirmed by comparing tumor size measurements of the surgical specimen with clinical size measurements that had indicated a lack of response. Similarly, pathologic evidence of PR was confirmed by a comparison of pathologic tumor size with pretherapy clinical size measurements. Any discrepancy between posttherapy clinical size measurements and pathologic size measurements was reflected in the pathologic response category (PR or NR). Tumors with equivocal findings were reviewed and classified by a pathologist specializing in breast pathology, who was unaware of the PET imaging results.
PET Imaging
We have previously described in detail our imaging and data analysis methods (8). We summarize those methods here, highlighting differences from our prior study. All imaging was performed using the Advance tomograph (General Electric Medical Systems). Blood flow imaging was performed using 962–1,998 MBq of 15O-water produced as previously described (8). Tracer was administered by bolus intravenous injection in a 1- to 4-mL volume, and dynamic 15O-water images were collected for 7.75 min after injection. Peak total coincidence count rates did not exceed 700 kcps and were therefore well within the ability of the tomograph to perform accurate dead-time corrections (19). Metabolism imaging was performed using 259–407 MBq of 18F-FDG, prepared using the method of Hamacher et al. (20). 18F-FDG radiochemical purity was in excess of 95%, and specific activity was greater than 47 GBq/μmol in all cases. 18F-FDG was infused over 2 min in a 7- to 10-mL volume. Dynamic imaging was performed for 60 min after the start of the 18F-FDG infusion. For both tracers, dynamic imaging data were corrected for random coincidences, scattered coincidences, and attenuation and were reconstructed into 35 × 128 × 128 matrices using a Hanning filter yielding a reconstructed spatial resolution of 10–12 mm (19). Image count data were converted to kBq/cm3 values obtained weekly by scanning calibration vials of known activity measured in a dose calibrator (Radioisotope Calibrator CRC-7; Capintec, Inc.). PET imaging studies were performed before therapy and were repeated after approximately 2 mo of therapy.
PET Image Analysis
Analysis of dynamic images was performed as previously described (8). Regions of interest (ROI) were drawn over the tumor, contralateral normal breast, and left ventricle to obtain the blood time-activity curves (21). Tumor ROIs were 1.5-cm-diameter circles placed on 3 adjacent imaging planes (total axial distance, 1.3 cm) and surrounded the area of maximal tumor 18F-FDG uptake seen on the 30- to 60-min summed images. This area was chosen to be representative of the most metabolic portion of the tumor and therefore likely represented the area with the most biologically aggressive behavior. The area of highest 18F-FDG uptake was used for both the pretherapy and the 2-mo images, even if the location of those sites was slightly different on the pretherapy and 2-mo images. Because some breast tumors substantially changed in size and shape over the course of treatment, it was difficult to ensure that exactly the same region was used in both analyses. We therefore chose to use the area of maximum 18F-FDG uptake to guide consistent region selection over the course of treatment.
Water studies were analyzed according to the method of Wilson et al. (22) using a 1-compartmental model as previously described (8). In the current analysis, parameters were estimated through an optimized modeling approach using the software package Berkeley Madonna. Model optimization was verified using simulated time-activity curves generated by the modeling program used in previous analyses, and parameter estimates were compared with estimates from our previous analysis (8) obtained using EXCEL (Microsoft). Parameter estimates using the current approach yielded similar results (r = 0.95) to those of our previous approach. Simulations of data with statistical noise added to match that observed in clinical studies revealed an SE of 13% for blood flow. A single repeated study on 1 patient yielded a difference of 11% for blood flow.
18F-FDG studies were analyzed through a standard Patlak-Gjedde graphical analysis approach to estimate the tracer flux constant, Ki (mL/min/g), obtained from the slope of the graphical relationship of normalized tissue uptake versus normalized time (23), using the decay-corrected data obtained from 30 to 60 min after injection. MRFDG values (μmol/min/100 g) were calculated as the product of plasma glucose (μmol/mL) and Ki.
To account for changes in tumor size over the course of treatment, partial-volume correction was performed. Size estimates were obtained from ultrasound, mammography, or physical examinations, depending on which examination best delineated tumor boundaries. Partial-volume correction was not applied to the posttreatment scans of 5 patients whose tumor uptake could not be clearly distinguished from the normal breast. In this case, ROI placement was based on the location of the tumor on the pretherapy scan.
Tumor time-activity curves for 15O-water and 18F-FDG were corrected for partial-volume effects as follows (24):
 Eq. 1 where A′(t) is the partial-volume-corrected tumor time-activity curve, A(t) is the uncorrected tumor time-activity curve, Bck(t) is the background time-activity curve obtained from the contralateral normal breast ROI, and RC is the recovery coefficient. The RCs, which are equal to the measured activity concentration divided by the true activity concentration, were obtained from the analysis of hot-sphere phantoms using the same ROIs used to obtain tumor time-activity curves (24). In Equation 1, when there is no partial-volume count loss (RC = 1), then A′(t) = A(t). The lesion diameter obtained from ultrasound, mammography, or physical examinations was used to select the correct RC value, using linear interpolation between values obtained from the sphere sizes included in the phantom measurements.
Because the statistical noise in individual time points on the tumor and background time-activity curves can be high, we also performed a simplified analysis assuming that blood flow and MRFDG behave like simple tracer uptake measures according to the following equation:
 Eq. 2 where P′t and Pt are the partial-volume corrected and uncorrected estimated parameters (MRFDG or blood flow), respectively, for the tumor and PBck is the estimated parameter for the background tissue (normal breast). This correction is approximate in that it treats the parameters like simple uptake measures and does not account for the effect that any differences between the shape of the tumor and background time-activity curves may have on the final parameter estimates. Although this approach can potentially introduce bias, it is more likely than the approach outlined in Equation 1 to be tolerant of statistical noise, which can be high in water studies.
For each imaging study, tumor parameter estimates were recorded without partial-volume correction, with full partial-volume correction (Eq. 1), and with approximate partial-volume correction (Eq. 2).
Statistical Analysis
Differences in the change in quantitative PET measurements for responders versus nonresponders and the association between the change in PET measures and the pathologic degree of response (NR, PR, or CR) versus PET measures were tested using the Kruskal-Wallis test. Analysis of DFS and overall survival (OS) was performed using Kaplan-Meier curves. Univariate analysis testing of the association of clinical, pathologic, and PET parameters with DFS and OS was performed using the Wilcoxon test. All statistical analyses were performed using the JMP software package (SAS Institute).
RESULTS
Patients
Thirty-five patients with LABC underwent serial 18F-FDG and 15O-water PET imaging. The pretherapy PET results for 25 of these 35 patients have been reported previously (8). The mean age at the time of diagnosis was 49 y (range, 32–76 y). Fourteen of the patients were postmenopausal and 21 were premenopausal. Median primary tumor size was 5.5 cm (range, 1.9–11 cm). Patients with smaller tumors were classified as having LABC because of advanced axillary disease. Two patients with N2 disease had a 1.9- and 2.2-cm primary, 1 patient with N1 disease had a 2-cm primary, and all other patients had a primary tumor size of 2.5 cm or greater. Pretherapy diagnosis was confirmed by core-needle biopsy in 33 patients, surgical biopsy in 1 patient, and fine-needle aspiration in 1 patient. Tissue diagnosis was infiltrating ductal carcinoma in 32 of 35 patients and infiltrating lobular carcinoma in 3 of 35 patients. Four of 35 breast carcinomas were classified as inflammatory on the basis of clinical presentation. Twenty-six patients had abnormal axillary lymph nodes by physical examinations. Twenty-two tumors were estrogen receptor-positive, and 12 patients had tumors overexpressing the HER2/Neu oncogene.
Treatment
Thirty-two of 35 patients receiving neoadjuvant chemotherapy underwent weekly dose-intensive doxorubicin with granulocyte colony-stimulating factor support. Twenty-eight of 32 had doxorubicin plus cyclophosphamide; 2 of 32 had doxorubicin, cyclophosphamide, and fluorouracil; and 2 of 32 had doxorubicin only. Of the remaining 3 patients, 1 received 3-wk cycles of docetaxel and vinorelbine, 1 underwent cyclophosphamide/methotrexate/fluorouracil chemotherapy with concurrent radiation, and 1 was treated with weekly paclitaxel and trastuzumab. PET imaging results were not used to select chemotherapy regimens. The mean duration of chemotherapy was 14.4 wk (range, 8–24 wk). A mean of 0.9 (range, 0–5) treatment was withheld because of toxicity or patient illness over the course of therapy. After the completion of therapy, 27 patients underwent mastectomy and 8 patients underwent lumpectomy. Surgery was performed a mean of 3.2 wk after the completion of therapy (range, 0.7–1.9 wk). Pretherapy PET imaging was performed a mean of 4.1 d (range, 0–12 d) before the first chemotherapy dose. The second PET examination, performed during therapy, occurred a mean of 9.3 wk (range, 6–15 wk) after the first chemotherapy dose.
Response
Clinical response to neoadjuvant chemotherapy was determined by serial measurements of tumor dimensions. Clinical measurement of tumor size was made by ultrasound in 23 patients, mammography in 1 patient, and physical examinations in 9 patients. Tumor size measurements from MRI were used in 2 patients not routinely followed by the other imaging modalities and whose tumors were difficult to follow by physical examinations. Pathologic response was based on examination of the surgical specimen. Comparison of clinical and pathologic response is summarized in Table 1. In general, there was agreement between resistant and responsive tumors (NR vs. CR or PR), with discrepancies in the extent of response (CR vs. PR). Of 14 patients with a pathologic macroscopic CR, 3 had no evidence of invasive disease by microscopy (microscopic CR) and 11 had residual microscopic invasive carcinoma (microscopic PR). Chemotherapy regimen type was not significantly associated with response. Twenty-six of 35 patients had one or more positive nodes at surgery after chemotherapy (median number of positive nodes, 2.5). Twenty-two of 26 (85%) patients with positive nodes at the time of surgery had abnormal axillary 18F-FDG uptake on the pretherapy PET scan.
Clinical vs. Pathologic Response Assessment to Neoadjuvant Chemotherapy
PET Measurements
An example of PET images of blood flow and metabolism for a patient with NR, PR, and macroscopic CR are shown in Figure 1.
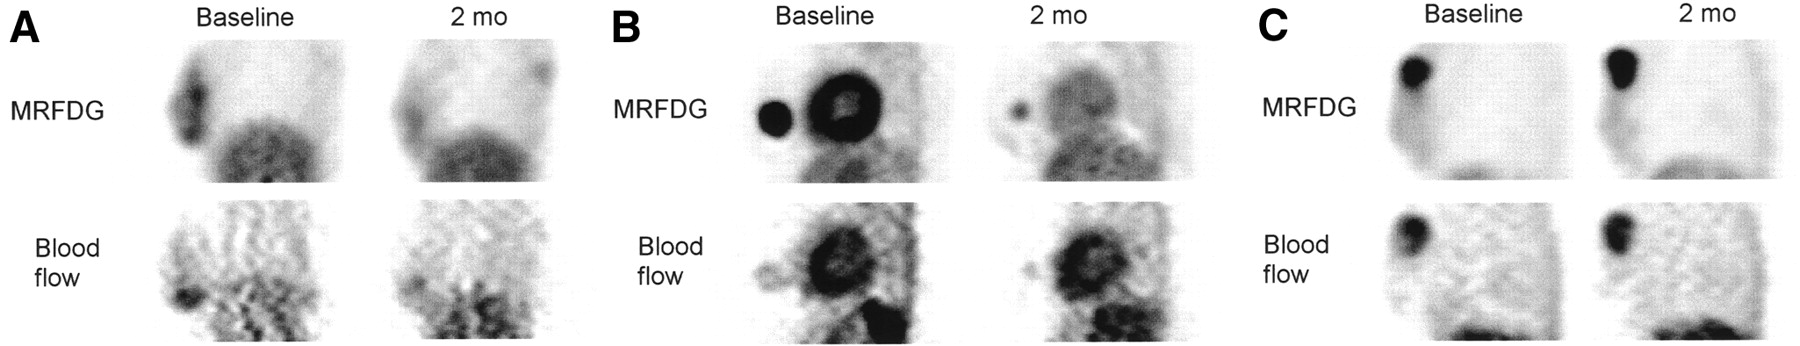
Thick sagittal images of breast and chest of patients before therapy (left) and after 2 mo of therapy (right) showing 18F-FDG and 15O-water uptake. 18F-FDG images are summed images of data 30–60 min after injection; 15O-water images are summed 30–60 s after injection. Patient with macroscopic CR (A), patient with PR (B), and patient with NR (C) are shown.
For all patients, the mean MRFDG ± SD was 9.2 ± 7.1 μmol/min/100 g before therapy and 3.7 ± 4.8 μmol/min/100 g after therapy. Mean blood flow was 0.30 ± 0.14 mL/min/g before therapy and 0.23 ± 0.19 mL/min/g after therapy. As in our prior study (8), patients with grade I lobular carcinomas (n = 3) had low pretherapy MRFDG values despite large tumor size (pretherapy MRFDG for grade I lobular tumor, 1.6 ± 0.3 μmol/min/100 g; all others, 9.9 ± 7.0 μmol/min/100 g; P < 0.01). As in our prior analysis with well-differentiated lobular tumors excluded (8), a high pretherapy MRFDG was associated with a poor response to therapy (P < 0.01), and tumors achieving a CR had lower pretherapy ratios of MRFDG to blood flow (P = 0.03).
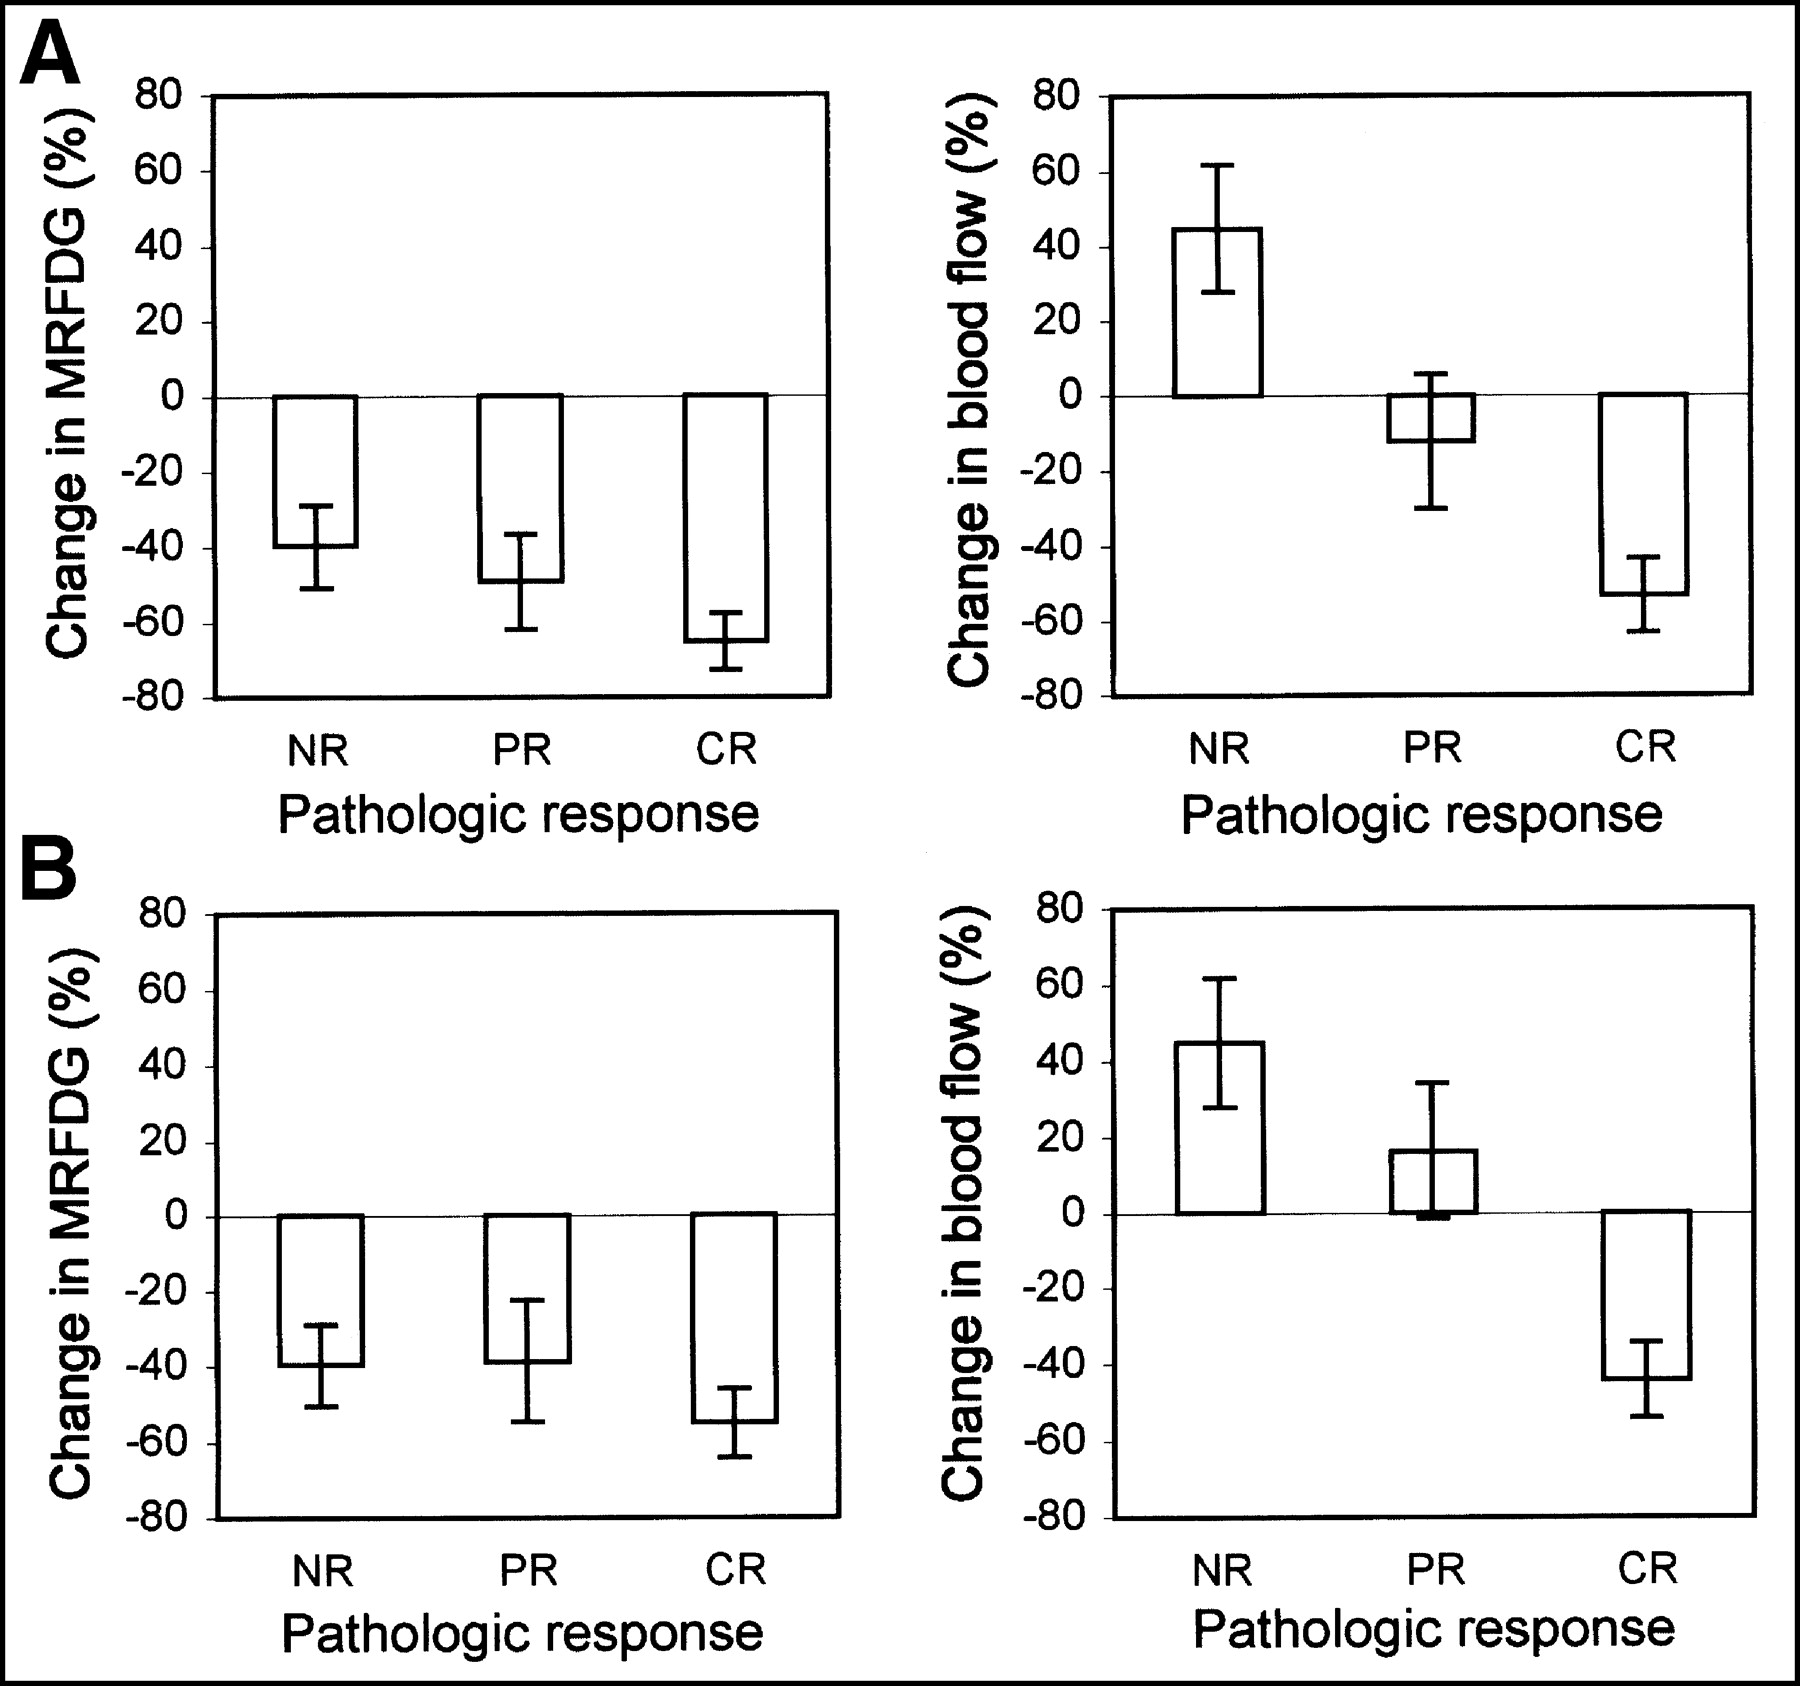
Figure 2 and Table 2 describe the changes in MRFDG and blood flow over the course of therapy for clinical responders versus nonresponders, and Figure 3 and Table 3 describe MRFDG and blood flow changes for the different categories of pathologic response (NR, PR, and CR). Measures are reported without partial-volume correction and with approximate partial-volume correction (Eq. 2) and full partial-volume correction (Eq. 1). Without partial-volume correction, MRFDG declined more for clinical responders than for nonresponders (P = 0.01). With simple partial-volume correction, the difference was of borderline significance (P = 0.05). There was not a significant association between the percentage decline in MRFDG and pathologic response, especially after correction for partial-volume effects. Blood flow, on the other hand, showed a striking average difference between clinical responders and nonresponders, with responders showing an average decline in blood flow and nonresponders showing an average increase in blood flow (P < 0.005 for the difference). There was also an association between the change in blood flow and pathologic response (P = 0.001). Both associations remained highly statistically significant after partial-volume correction by both full and simplified methods. Other factors, including chemotherapy regimen, were not significantly associated with response or changes in PET estimates.

Percentage change in MRFDG and blood flow vs. clinical response, for patients having response (R) and patients having NR. MRFDG and blood flow without partial-volume corrections are shown. Error bars indicate SEM.

Percentage change in MRFDG and blood flow vs. pathologic response, for macroscopic CR, PR, and NR. MRFDG and blood flow results without partial-volume correction (A) and with simple partial-volume correction (B) are shown. Error bars indicate SEM.
Percentage Change in Serial Measurements of MRFDG and Blood Flow vs. Clinical Response to Neoadjuvant Chemotherapy
Percentage Change in Serial Measurements of MRFDG and Blood Flow vs. Pathologic Response to Neoadjuvant Chemotherapy
The results of preliminary survival analysis are summarized in Table 4, and representative Kaplan-Meier plots are shown in Figures 4 and 5. The median follow-up was 28.3 mo, and of the patients studied, 10 experienced relapse and 6 died. Of the post-therapy variables, only 2-mo blood flow showed a significant association with DFS and OS (P = 0.04 and P = 0.03, respectively). Lower residual MRFDG at 2 mo and fewer than 4 positive nodes after therapy showed a trend toward an association with improved DFS (P = 0.12). After partial-volume correction, the association of lower blood flow and improved DFS and OS remained statistically significant (P < 0.05 for both). In this small patient group with limited follow-up, the established prognostic factors of macroscopic complete response and greater than or equal to 4 nodes positive were not significantly associated with DFS or OS. In our previous analysis of a smaller group of patients (8), the number of positive nodes was predictive of survival in Cox proportional hazards analysis. Subsequent analysis showed that this association was driven by a small number of patients with a large number of positive nodes and poor DFS. With the use of the more robust approach of Kaplan-Meier analysis and an established cutoff of 4 positive nodes as the grouping variable (25), the trend toward poorer DFS with more positive nodes remained but was no longer statistically significant.
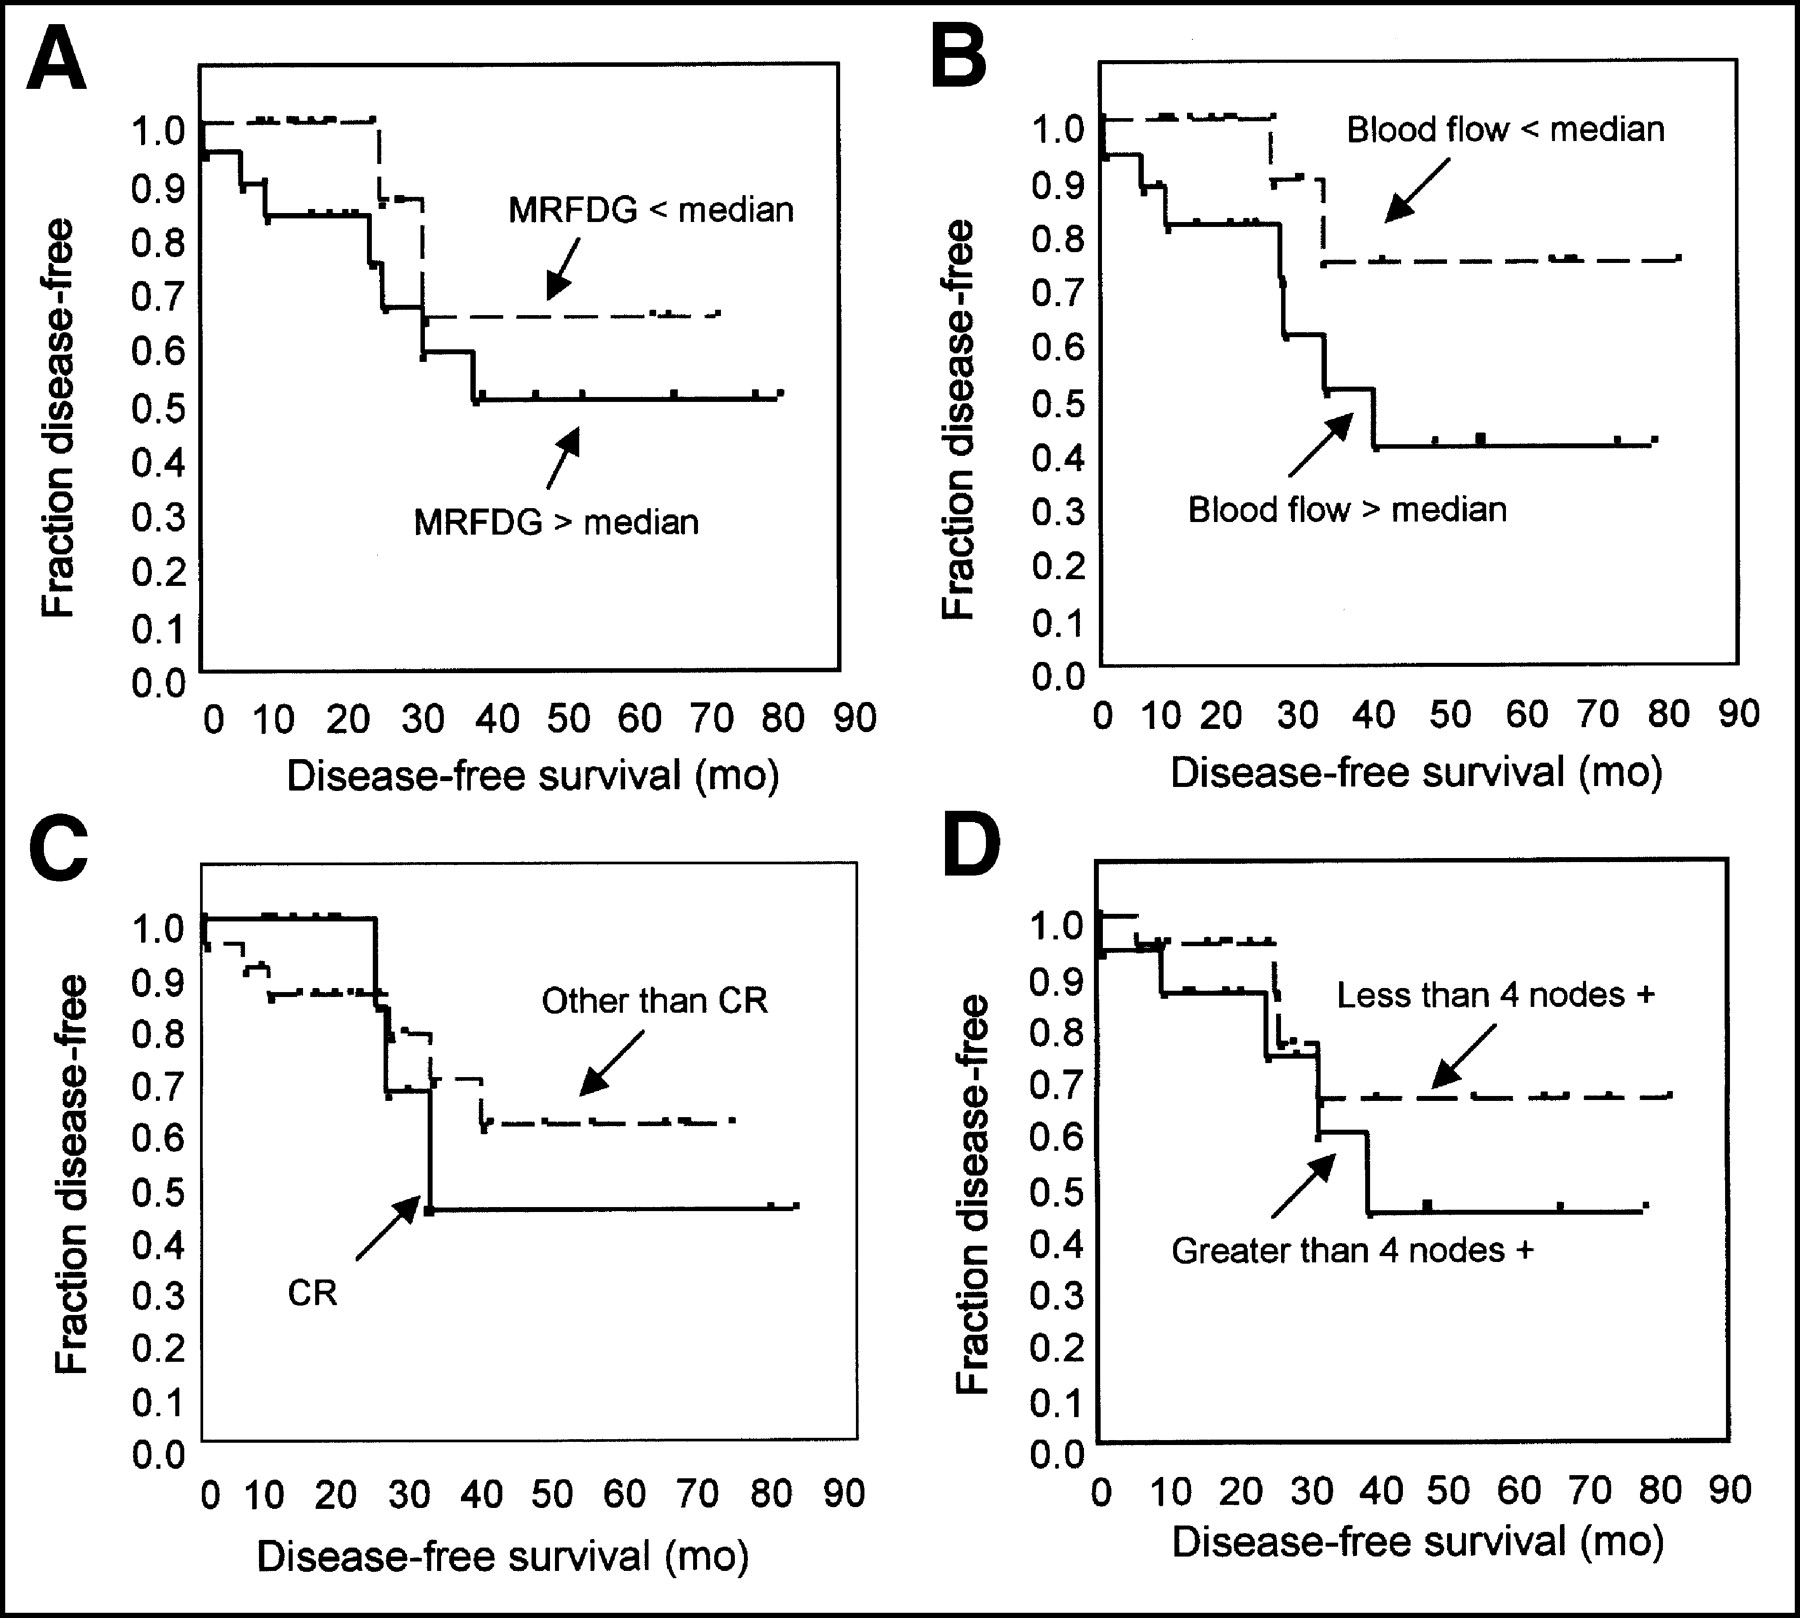
Kaplan-Meier plots of disease-free survival for representative parameters: (A) residual MRFDG at 2 mo, (B) residual blood flow at 2 mo, (C) macroscopic CR vs. other response, and (D) posttherapy axillary nodal status.
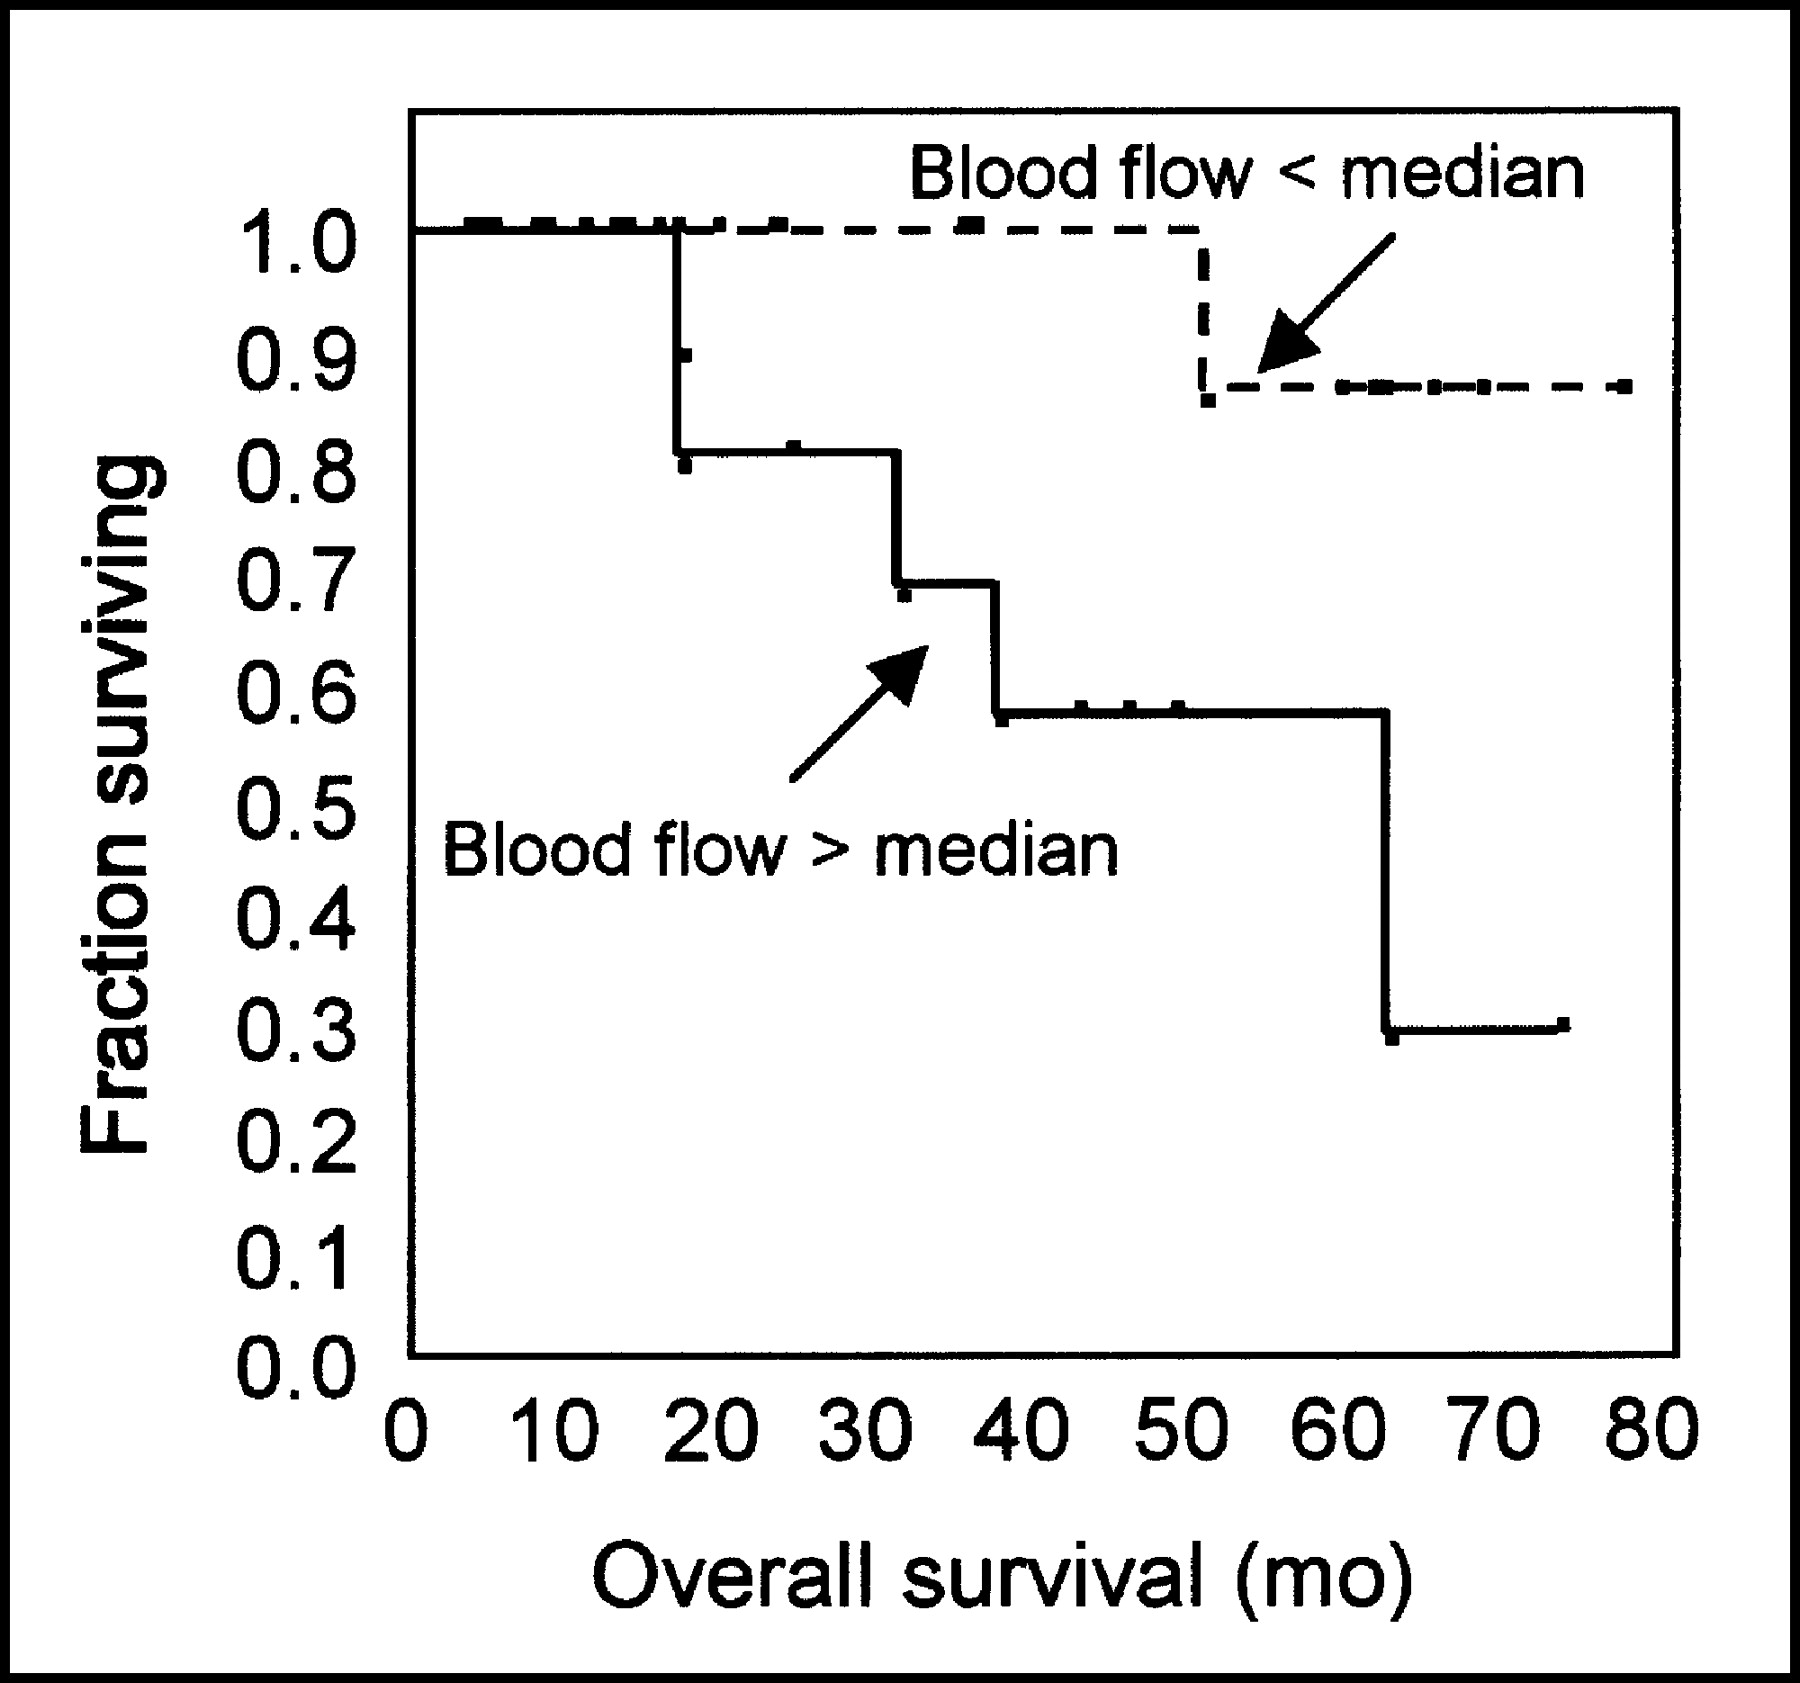
Kaplan-Meier plot of overall survival stratified by residual blood flow at 2 mo.
Univariate Analysis of Factors Potentially Associated with Disease-Free and Overall Survival
DISCUSSION
Our study examined changes in tumor glucose metabolism and blood flow during neoadjuvant chemotherapy of LABC. We found that average tumor glucose metabolism declined over the course of therapy for both responders and nonresponders, with a greater decline in patients whose tumor responded to treatment. With partial-volume corrections to account for the effect of decreasing tumor size with treatment, an effect that is greater in responders than nonresponders, the average difference in percentage decline in MRFDG between responders and nonresponders was relatively small. There was, however, a striking difference in the average change in tumor blood flow for responders versus nonresponders, and this difference was highly significant even after partial-volume corrections. In particular, there was an average 48% increase in tumor blood flow for clinical nonresponders, with a small decline (−12%) in tumor blood flow in responders, after correction for partial-volume effects. The residual tumor blood flow after 2 mo of therapy was predictive of both disease-free survival and OS, with patients who had higher residual blood flow having significantly poorer survival.
Several other studies have shown that serial 18F-FDG PET accurately monitors response, in that patients with a favorable response to therapy had a greater decline in 18F-FDG uptake than did patients with a poorer response (9–13). We found similar results in data that were not partial-volume corrected but found smaller, less significant differences after partial-volume correction. A limitation of our approach is that the precise assessment of tumor size in treated breast cancer is difficult (3), and this difficulty could conceivably decrease the reliability of the partial-volume-corrected data. We would expect a similar partial-volume effect for both blood flow and MRFDG; however, changes in blood flow were significantly associated with response, even after partial-volume correction. These results suggest that a decrease in tumor size contributes to the apparent decline in 18F-FDG uptake in LABC patients responding to neoadjuvant chemotherapy. This does not necessarily diminish the utility of 18F-FDG PET for measuring breast cancer response to therapy but should be considered in interpreting the clinical and biologic significance of a decline in apparent 18F-FDG PET uptake in a shrinking tumor.
It is likely that the timing of follow-up 18F-FDG PET relative to the start of chemotherapy affects the difference in 18F-FDG uptake for responders versus nonresponders. For example, Smith et al. (12) found a more significant difference in 18F-FDG uptake for patients with CR versus patients with other than CR after the first dose of chemotherapy and a less significant difference for scans taken after the fourth dose of chemotherapy. Although only patients with CR had an average decline in 18F-FDG uptake after the first dose in the Smith study, both categories of patients had an average decline in 18F-FDG uptake after the fourth dose, similar to our findings. The timing of our 2-mo scan was similar to the timing of the fourth-dose scan in the Smith study. It is possible that by 2 mo, effects such as neovascularization and inflammatory cell infiltration may confound estimation of response using tumor glucose metabolism.
In our study, tumor response and percentage change in blood flow were significantly correlated, even with correction for partial-volume effects. The residual blood flow after 2 mo of therapy predicted DFS. Tumor blood flow is influenced by a variety of factors, including tumor vascularity (26). The association of residual blood flow with DFS parallels other studies showing predictive capability, in untreated tumors, for histologically based measures of breast tumor vascularity (14,15,27). The strong association of blood flow change and response may also explain why imaging studies influenced by tumor blood flow and vascularity, such as contrast-enhanced MRI, 99mTc-sestamibi imaging, and Doppler ultrasound, have been shown to accurately measure the response of LABC to neoadjuvant chemotherapy (17,28–32). These modalities may, in fact, provide more clinically feasible methods of assessing tumor blood flow over the course of therapy.
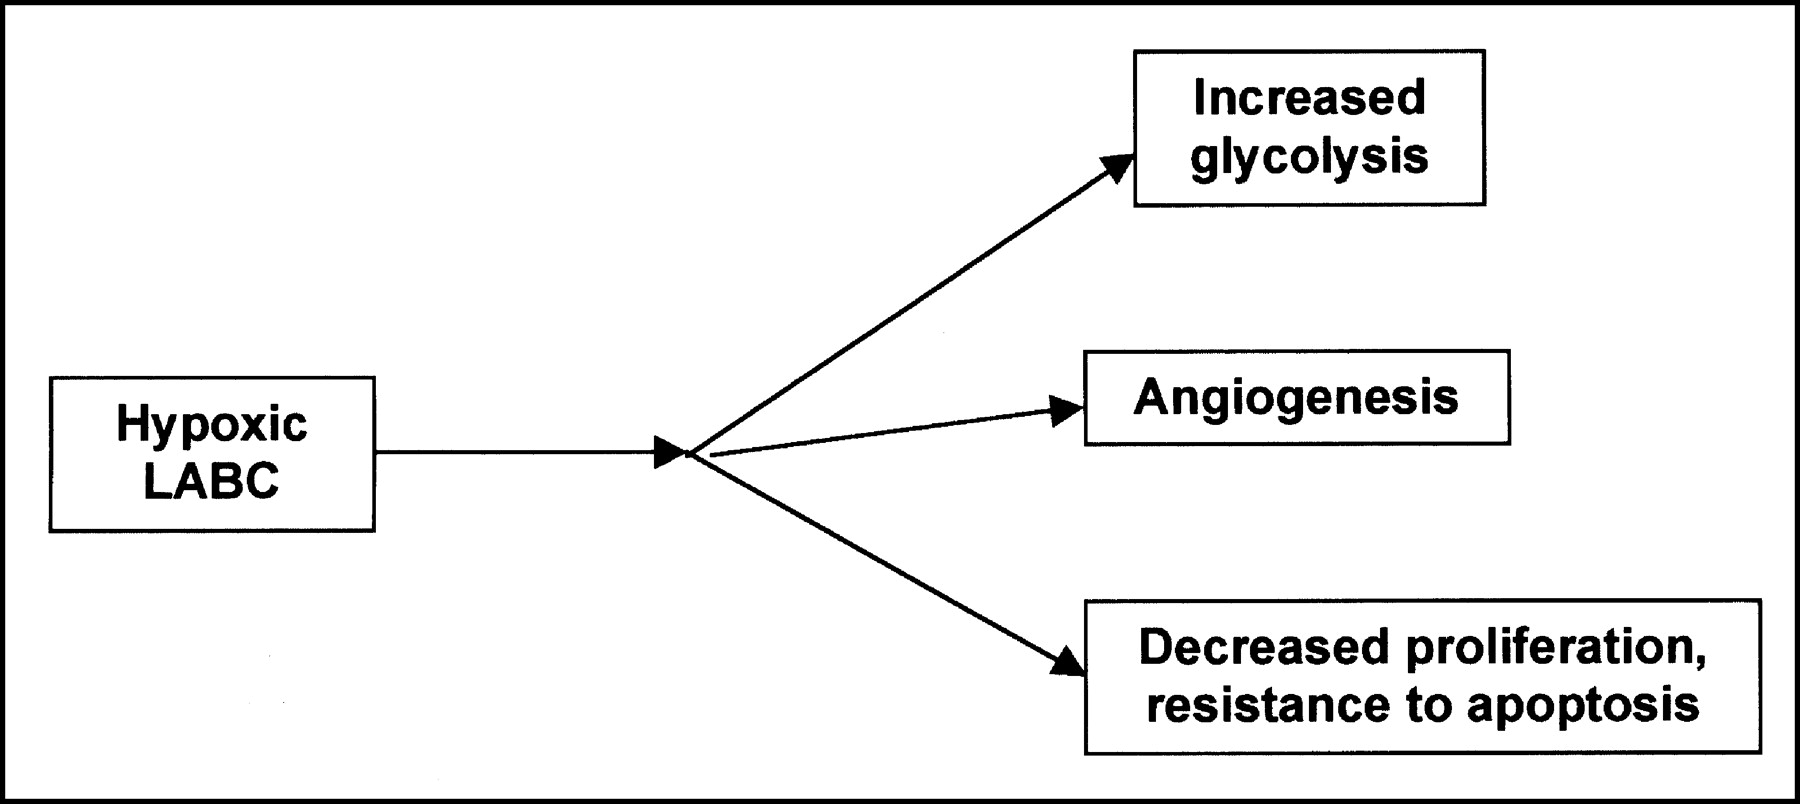
Although there are significant associations between the changes in blood flow and response to treatment, there is considerable overlap in blood flow change over therapy between response categories. Thus, it would be difficult to make clinical decisions after 2 mo of treatment based solely on the PET findings. The importance of our findings is that they elucidate some of the phenotypic factors of resistant LABC that would be difficult to measure without quantitative in vivo imaging. Our findings also indicate that the incorporation of information on tumor biology after treatment may enhance the current practice of making postchemotherapy decisions based solely on tumor size. In particular, together with our previous analysis of pretherapy blood flow and metabolism (8), we found LABC resistance to neoadjuvant chemotherapy to be associated with high pretherapy glucose metabolism, a high pretherapy ratio of glucose metabolism to blood flow, and failure to diminish tumor blood flow with therapy. One possible explanation for these findings is tumor hypoxia, as illustrated in Figure 6. Hypoxia has been established as a factor in radiotherapy resistance but has more recently also been implicated in resistance to chemotherapy (33–35). Recent work has shown that tumor hypoxia, through a variety of mediators including the transcription factor, hypoxia-inducible factor 1 (HIF-1), leads to several downstream effects that may explain some of our findings (33,36). HIF-1 leads to increased glycolysis and expression of glycolytic enzymes, possibly explaining our finding of increased glucose metabolism in many resistant tumors (36). Hypoxia and HIF-1 lead to strong angiogenic signals (37), which would explain persistent or even increased blood flow with treatment. Finally, recent work has suggested that hypoxia reduces cell cycling (35) and that alterations in metabolism accompanying hypoxia may confer resistance to apoptosis (38–40), both of which would diminish response to cytotoxic chemotherapy. These concepts form a hypothesis for our ongoing work to investigate the tumor biology underlying our findings, including PET imaging measurements of tumor hypoxia and in vitro assay of tumor biopsy material for the downstream effects of hypoxia.

Diagram illustrating hypothesis that hypoxia underlies resistance of some LABC to neoadjuvant chemotherapy and that downstream effects of hypoxia explain PET findings and response to treatment.
CONCLUSION
Our studies show that although both resistant and responding LABCs have a decline in MRFDG with chemotherapy, resistant tumors have an average increase in tumor blood flow with therapy. The change in blood flow after 2 mo of therapy is predictive of DFS. Further work is necessary to elucidate the tumor biology underlying these findings.
Acknowledgments
This work was supported by grants CA72064 and CA42045 from the National Institutes of Health. The authors thank Dr. Jeanne Link and John Courter for isotope production; Dr. Thomas Lewellen, Steven Kohlmeyer, Barbara Lewellen, Pam Pham, and the nuclear medicine technologist staff of the University of Washington for technical assistance with the imaging studies; Drs. Janet Eary and Kenneth Krohn for helpful comments; the late Dr. Aaron Charlop for long-time collaboration; and Mimi Shurts for patient care coordination. The authors also acknowledge the staff of the University of Washington Breast Cancer Specialty Center for help with patient referrals.
Footnotes
Received Dec. 20, 2002; revision accepted May 15, 2003.
For correspondence or reprints contact: David A. Mankoff, MD, PhD, Division of Nuclear Medicine, Box 356113, UWMC, 1959 NE Pacific St., Seattle, WA 98195.
E-mail: dam{at}u.washington.edu
REFERENCES
In this issue


Jump to section
Related Articles
Cited By...
- Principles of Tracer Kinetic Analysis in Oncology, Part II: Examples and Future Directions
- Breast Cancer Blood Flow and Metabolism on Dual-Acquisition 18F-FDG PET: Correlation with Tumor Phenotype and Neoadjuvant Chemotherapy Response
- 18F-FDG PET-Derived Tumor Blood Flow Changes After 1 Cycle of Neoadjuvant Chemotherapy Predicts Outcome in Triple-Negative Breast Cancer
- Predicting Responses to Neoadjuvant Chemotherapy in Breast Cancer: ACRIN 6691 Trial of Diffuse Optical Spectroscopic Imaging
- The Impact That Number of Analyzed Metastatic Breast Cancer Lesions Has on Response Assessment by 18F-FDG PET/CT Using PERCIST
- 18F-FDG PET/CT for Monitoring of Treatment Response in Breast Cancer
- Imaging of Apoptosis: The Need to Distinguish Tracer Uptake Rate from Regional Contribution of Blood Flow
- Preclinical Kinetic Analysis of the Caspase-3/7 PET Tracer 18F-C-SNAT: Quantifying the Changes in Blood Flow and Tumor Retention After Chemotherapy
- Role of Positron Emission Tomography for the Monitoring of Response to Therapy in Breast Cancer
- Noninvasive Quantification of Solid Tumor Microstructure Using VERDICT MRI
- Early Predictive Value of Non-response to Docetaxel in Neoadjuvant Chemotherapy in Breast Cancer Using 18F-FDG-PET
- Baseline Tumor Oxygen Saturation Correlates with a Pathologic Complete Response in Breast Cancer Patients Undergoing Neoadjuvant Chemotherapy
- The Flow-Metabolic Phenotype of Primary Colorectal Cancer: Assessment by Integrated 18F-FDG PET/Perfusion CT with Histopathologic Correlation
- PET Tumor Metabolism in Locally Advanced Breast Cancer Patients Undergoing Neoadjuvant Chemotherapy: Value of Static versus Kinetic Measures of Fluorodeoxyglucose Uptake
- Multiagent PET for Risk Characterization in Sarcoma
- Monitoring Response to Antiangiogenic Therapy in Non-Small Cell Lung Cancer Using Imaging Markers Derived from PET and Dynamic Contrast-Enhanced MRI
- Tumor Metabolism and Blood Flow as Assessed by Positron Emission Tomography Varies by Tumor Subtype in Locally Advanced Breast Cancer
- Imaging Breast Cancer Chemotherapy Response with Light
- 18F-FDG Small-Animal PET/CT Differentiates Trastuzumab-Responsive from Unresponsive Human Breast Cancer Xenografts in Athymic Mice
- The Role of Radiotracer Imaging in the Diagnosis and Management of Patients with Breast Cancer: Part 2--Response to Therapy, Other Indications, and Future Directions
- Response to Therapy in Breast Cancer
- Reproducibility of Tumor Blood Flow Quantification with 15O-Water PET
- Tumor Metabolism and Blood Flow Changes by Positron Emission Tomography: Relation to Survival in Patients Treated With Neoadjuvant Chemotherapy for Locally Advanced Breast Cancer
- Quantitative Imaging of Estrogen Receptor Expression in Breast Cancer with PET and 18F-Fluoroestradiol
- Tumor-Specific Positron Emission Tomography Imaging in Patients: [18F] Fluorodeoxyglucose and Beyond
- Partial-Volume Effect in PET Tumor Imaging
- Dynamic and Static Approaches to Quantifying 18F-FDG Uptake for Measuring Cancer Response to Therapy, Including the Effect of Granulocyte CSF
- Predicting response to breast cancer neoadjuvant chemotherapy using diffuse optical spectroscopy
- Monitoring of Early Response to Neoadjuvant Chemotherapy in Stage II and III Breast Cancer by [18F]Fluorodeoxyglucose Positron Emission Tomography
- Positron Emission Tomography As an Imaging Biomarker
- A Physiologic Imaging Pilot Study of Breast Cancer Treated with AZD2171
- PET for response assessment in oncology: radiotherapy and chemotherapy
- Early Prediction of Response to Chemotherapy in Metastatic Breast Cancer Using Sequential 18F-FDG PET
- Sonographic Evaluation of Early-Stage Breast Cancers That Undergo Neoadjuvant Chemotherapy
- 18F-FDG Kinetics in Locally Advanced Breast Cancer: Correlation with Tumor Blood Flow and Changes in Response to Neoadjuvant Chemotherapy
- Locally Advanced Breast Cancer: Is PET Useful for Monitoring Primary Chemotherapy?