


Abstract
The aim of this study was to characterize the biologic response of locally advanced breast cancer (LABC) to chemotherapy using 15O-water–derived blood flow measurements and 18F-FDG–derived glucose metabolism rate parameters. Methods: Thirty-five LABC patients underwent PET with 15O-water and 18F-FDG before neoadjuvant chemotherapy and 2 mo after the initiation of treatment. Kinetic analysis for 15O-water was performed using a single tissue compartment model to calculate blood flow; a 2-tissue compartment model was used to estimate 18F-FDG rate parameters K1, k2, k3, and the flux constant, Ki. Correlations and ratios between blood flow and 18F-FDG rate parameters were calculated and compared with pathologic tumor response. Results: Although blood flow and 18F-FDG transport (K1) were correlated before chemotherapy, there was relatively poor correlation between blood flow and the phosphorylation constant (k3) or the overall 18F-FDG flux (Ki). Blood flow and 18F-FDG flux were more closely matched after chemotherapy, with changes in k3 accounting for the increased correlation. These findings were consistent with a decline in both the Ki/flow and k3/flow ratios with therapy. The ratio of 18F-FDG flux to transport (Ki/K1) after 2 mo of chemotherapy was predictive of ultimate response. Conclusion: The pattern of tumor glucose metabolism in LABC, as reflected by analysis of 18F-FDG rate parameters, changes after therapy, even in patients with modest clinical responses. This may indicate a change in tumor “metabolic phenotype” in response to treatment. A low ratio of glucose metabolism (reflected by Ki) to glucose delivery (reflected by K1 and blood flow) after therapy is associated with a favorable response. Further work is needed to understand the tumor biology underlying these findings.
Locally advanced breast cancer (LABC) is defined as a large primary tumor (T3 or greater) or advanced axillary disease (N2) without evidence of distant metastases (1). These tumors are frequently treated using primary or neoadjuvant chemotherapy before definitive surgery (2). Prior studies have suggested that serial measurements of tumor glucose metabolism using 18F-FDG PET are helpful for monitoring tumor response (3–7).
We have studied LABC response using serial dynamic 15O-water and 18F-FDG scans to investigate how tumor blood flow and glucose metabolism change after presurgical neoadjuvant chemotherapy. Our previous results have shown that high glucose metabolism or an imbalance between blood flow and glucose metabolism before chemotherapy predict a poor response to neoadjuvant chemotherapy (8). We have also shown that changes in blood flow after 2 mo of treatment predict response to chemotherapy: Responders have a decrease in tumor blood flow, whereas nonresponders have an increase in tumor blood flow (9).
We now extend our prior work to include a more detailed analysis of glucose metabolism and its relationship to blood flow using a 2-tissue compartmental model for 18F-FDG (10). Similar work has been presented by Zasadny et al. (11), who performed kinetic analysis of 18F-FDG in 9 untreated breast cancers patients. Their study showed a positive correlation between blood flow and glucose metabolism and provided insights into the pattern of glucose metabolism in untreated LABC. The authors suggested that areas of the tumor with low blood flow and high metabolism might be hypoxic. This is consistent with prior invasive studies that showed hypoxic areas heterogeneously distributed within some LABC (12) and with our prior work showing that high glucose metabolism and low blood flow predicts a less favorable response to treatment (8).
In this article we report the kinetic analysis of glucose metabolism in a series of 35 patients who had both 15O-water and 18F-FDG PET studies before and 2 mo after the initiation of neoadjuvant chemotherapy. This report differs from previous studies in the size of the patient population and the inclusion of measurements both before and after chemotherapy. The aim of the study was to characterize the relationship among the individual 18F-FDG rate parameters, compared with 15O-water–derived blood flow and to pathologic macroscopic response to neoadjuvant chemotherapy. Our hypothesis is that changes in the pattern of tumor metabolism, including the relationship between substrate utilization and delivery, will elucidate tumor biology and suggest factors important in resistance or response of LABC to chemotherapy.
METHODS AND MATERIALS
Patient Characteristics, Treatment, and Response Evaluation
Thirty-five LABC patients underwent serial 15O-water and 18F-FDG PET studies according to the University of Washington Human Subjects Committee guidelines. These 35 patients are the same patients who have been previously described (9); this work is a more detailed analysis of these previously reported imaging studies. Our patient selection criteria, chemotherapy regimen, and response evaluation have been previously described (9) and are summarized below and in the Results.
Patients underwent approximately 4 mo of neoadjuvant chemotherapy before surgery and lymph node dissection. Postchemotherapy surgical excision tumor samples were classified for tumor type and were graded for pathologic response to neoadjuvant chemotherapy by standard definitions (13) as in our prior studies (9). A macroscopic complete response (mCR) was defined as absence of macroscopic tumor by histopathologic examination. Patients with a residual mass and with a >50% reduction in size compared with prechemotherapy clinical size measurements based on ultrasound, mammography, or physical examination were considered a partial response (PR). The remaining patients were classified as no response (NR).
PET
Our radiopharmaceutical production methods and PET acquisition parameters have been described (8,9) and are summarized briefly here. PET images were obtained on an Advance Tomograph (General Electric Medical Systems) with 35 transaxial planes, 4.25-mm thick. Images were corrected for random coincidences, scatter, and attenuation. Filtered backprojection reconstruction was performed with a Hanning filter using a 35 × 128 × 128 image matrix and yielded a reconstructed spatial resolution of approximately 10–12 mm (14). Imaging was performed with 960–2,000 MBq (26–54 mCi) of 15O-water and a 2-min infusion of 260–407 MBq (7–11 mCi) of 18F-FDG. Glucose concentrations were checked immediately before the administration of 18F-FDG (mean, 93 mg/dL; range, 60–170 mg/dL). Dynamic images were obtained for 7.75 min for 15O-water and 60 min for 18F-FDG. The dynamic imaging sequence for 15O-water was 15 × 2 s, 15 × 5 s, 12 × 10 s, 8 × 15 s, and 6 × 20 s. The imaging sequence for 18F-FDG was 4 × 20 s, 4 × 40 s, 4 × 1 min, 4 × 3 min, and 8 × 5 min.
Tumor regions of interest (ROIs) were drawn as 1.5-cm-diameter circles on the 18F-FDG images around the area of maximum tumor activity over 3 contiguous planes chosen to be the most biologically aggressive portion of the tumor. The choice of circular 1.5-cm ROIs was a compromise between selecting regions of sufficient size and counts for analysis and more severe partial-volume (PV) effects for larger regions. These ROIs were copied onto the 15O-water scans. ROIs were drawn within the left ventricular cavity—close to the valve plane to avoid spillover from adjacent myocardium—to provide a blood input function. ROIs were also drawn around the contralateral breast to serve as background. Images were obtained before neoadjuvant chemotherapy (mean, 4.1 d; range, 0–12 d) and approximately 2 mo after the initiation of chemotherapy (mean, 9.3 wk; range, 6–15 wk). The mean duration of chemotherapy was 14.4 wk (range, 8–24 wk).
Kinetic Models
The 15O-water analysis used a single tissue compartment model described by the following differential equation according to Wilson et al. (15):
 Eq. 1 where A(t) is the tissue activity, Cb(t) is the blood activity, F is blood flow, Vd is the volume of distribution, and λ is the radioactive decay constant for 15O.
The 18F-FDG analysis used a 2-tissue compartment model described by the following differential equations, which were modified from Sokoloff et al. (10) to incorporate decay of the radiotracer:
 Eq. 2
Eq. 2
 Eq. 3 where CFDG(t) is the free 18F-FDG tissue activity, CFDG−P(t) is the phosphorylated 18F-FDG tissue activity, Cb is the blood activity, K1 is the 18F-FDG transport rate constant from blood to tissue, k2 is the 18F-FDG transport rate constant from tissue to blood, k3 is the phosphorylation rate constant of 18F-FDG, and λ is the radioactive decay constant for 18F. The overall flux constant, Ki, is represented by the following equation:
 Eq. 4
Eq. 4
In addition to K1, k2, k3, and Ki, we also calculated the Ki/K1 ratio. This ratio Ki/K1 is equivalent to k3/(k2 + k3) and reflects the balance between 18F-FDG delivery to tissue (K1) and 18F-FDG phosphorylation (k3) (16). Ratios close to 0 suggest that the flux constant Ki is limited by the phosphorylation step. Ratios close to 1 suggest that 18F-FDG delivery K1 is rate limiting.
For the 18F-FDG model, tissue time–activity curves are the sum of the CFDG and CFDG−P compartments and a small contribution from the intravascular blood volume. For the 18F-FDG analysis, a BV·Cb(t) term was added to the tissue ROI, where BV is the percentage of intravascular blood volume in the tissue. We fixed BV at 4% based on literature values for breast tumors (17–19). Simulations showed that 2-fold changes in BV did not significantly change the 18F-FDG parameters, K1, k2, and k3. For the 15O-water model, we followed the convention of Wilson et al. (15) and ignored the small intravascular volume. Simulations showed that blood volume could not be estimated accurately from the 15O-water data, and an attempt to estimate blood volume in the 15O-water study analysis increased variability of the flow estimates.
Parameter estimation via optimization was performed using Berkeley Madonna software. During optimization, parameters were constrained to a range of 0 to 1 (mL/min/g for blood flow, Ki, and Ki; min−1 for k2 and k3) with the exception of k3, which had a lower constraint of 0.0001 min−1. Parameter accuracy was estimated by simulations with statistical noise added to match the levels observed in clinical studies. For 15O-water, the 1-min time point had a coefficient of variation of 7.5%. For 18F-FDG, the 10-min time point had a 3.6% coefficient of variation. Simulations suggested a typical SE of 13% for blood flow, 11% for K1, 23% for k2, 21% for k3, and 3% for Ki. Using Kinetic Imaging System software, the mean SEs for the individual patient’s parameters were estimated as 16% for blood flow, 11% for K1, 22% for k2, and 25% for k3, which were in close agreement with the simulations.
Flux constants estimated by compartmental analysis were compared with previously reported Ki estimates from Patlak graphical analysis (9). The flux constants estimated for these 2 methods were nearly identical (graphical Ki vs. compartment Ki, r = 0.98).
PV Correction
To account for effects of changes in tumor size on parameter estimates, imaging data were also corrected for PV effects as described previously (9,20). Tumor size was assessed by ultrasound, mammography, or physical examinations within 1 wk of PET. Prior studies in our tomograph have shown that PV correction is necessary for tumors <3 cm (20). This was the case for 6 tumors before chemotherapy (4 mCR and 2 PR) and 15 tumors after chemotherapy (7 mCR and 8 PR). PV correction was performed as has been previously described (9,20):
 Eq. 5 where A′(t) is the PV-corrected tumor activity, A(t) is the uncorrected tumor activity, Bkgd(t) is the background activity obtained from an ROI from the contralateral breast, and RC is the recovery coefficient measured using phantom studies (20).
Statistical Analysis
The means and SDs were determined for the 18F-FDG parameters, K1, k3, and Ki, for each of the pathologic groups, mCR, PR, and NR, before and after chemotherapy. Since k2 can be derived from K1, k3, and Ki, this parameter was not included in the reported results. Differences between the parameters before and after chemotherapy were tested for significance (P < 0.05) using the 2-tailed paired Student t test and retested with the Wilcoxon matched-pairs signed-ranks test.
Correlations between blood flow and the 18F-FDG rate parameters were calculated using the Pearson correlation coefficient. To minimize the effects of one far outlier with unusually high blood flow and metabolism, we excluded this patient from subsequent Pearson correlation coefficient analyses. All patients were included in an analysis with the nonparametric rank correlation test, Spearman ρ, which was performed to minimize the influence of the outlier. Differences in correlations before and after chemotherapy were assessed by performing a Fischer transformation on the correlation coefficients to obtain a z-score and then assessed for significance using a t test (21).
To evaluate whether the parameter estimates were influenced by the decreasing size of the lesion, PV corrections were applied, and the correlations were reassessed. In addition, ratios of the 18F-FDG rate parameters to blood flow were calculated to minimize the influence of PV effects, since both terms in the ratio are affected similarly by partial volume. Ratios before and after chemotherapy were compared using the 2-tailed paired Student t test and retested with the Wilcoxon matched-pairs signed-ranks test.
Differences among the pathologic response groups’ Ki/flow and Ki/K1 ratios after chemotherapy were tested for significance using the nonparametric Kruskal–Wallis test (21). Since both Ki and K1 can be influenced by plasma glucose concentrations, glucose correction was applied to Ki and K1 by multiplying the terms by the plasma glucose concentration and then retested for significance. Glucose correction was also used to retest significance when comparing the parameters before and after chemotherapy. Statistical analyses were performed using JMP software (SAS Institute).
4-Parameter 18F-FDG Model
The 18F-FDG model described above has 3 parameters, K1, k2, and k3 (3-parameter model) and assumes that there is no appreciable dephosphorylation of 18F-FDG-6-phosphate—that is, k4 = 0. To test the effect of dephosphorylation on our results, we tested an additional model that incorporated a k4 term (4-parameter model) as described by Phelps et al. (22). An upper bound of 0.03 min−1 was placed on the k4 term based on literature values (23–27). This model was used to determine the effect of including a k4 parameter on the estimates of the remaining parameters, K1, k2, k3, and Ki and for changes in the significance levels for the above tests.
RESULTS
Patient Characteristics, Treatment, and Response Evaluation
The patient characteristics have been previously described (9) and are summarized here. The mean patient age was 49 y (range, 32–76 y). The mean primary tumor size was 5.5 cm (range, 1.9–11.0 cm). The chemotherapy regimen consisted of a combination of weekly dose-intensive doxorubicin with granulocyte colony-stimulating factor support for 32 patients; 28 of 32 also had cyclophosphamide and 2 of 32 patients also had cyclophosphamide and fluorouracil. For the remaining 3 patients, 1 had 3-wk cycles of docetaxel and vinorelbine, 1 had cyclophosphamide/methotrexate/fluorouracil and concurrent radiation, and 1 had weekly palitaxel and trastuzumab.
Tumors were classified as infiltrating ductal carcinoma in 32 patients and infiltrating lobular carcinoma in 3 patients. A mCR was achieved in 14 of 35 patients, PR in 16 of 35 patients, and NR in 5 of 35 patients.
18F-FDG Rate Parameters Before and After Chemotherapy
The 18F-FDG parameters K1, k2, k3, and Ki before neoadjuvant chemotherapy (prechemotherapy) and after approximately 2 mo of chemotherapy (postchemotherapy) are shown in Table 1. For all parameters, the mean value of the rate constant decreased significantly after therapy when including all patients (P < 0.001). PV correction did not alter the significance of these results.
18F-FDG Kinetic Parameters Before and After Chemotherapy for Response Groups
Data for the individual response groups mCR, PR, and NR are also presented in Table 1. After chemotherapy, mean K1 declined in the mCR and PR groups, whereas it increased in the NR group. This pattern was also seen for blood flow, as reported previously (9). Mean Ki and k3 parameters decreased for all groups, with the largest declines occurring in the mCR group and the smallest declines occurring in the NR group. Ki also declined after therapy in all patients except 1 patient who had very low uptake before therapy, making the small increase after therapy difficult to interpret. Retesting the significance levels using the nonparametric Wilcoxon matched-pairs signed-ranks test showed similar significance levels except for the NR group for Ki and k3, which showed a trend toward significance (P = 0.06). PV correction did not affect the significance levels. A summary graph showing the mean blood flow and Ki changes before and after chemotherapy for the mCR, PR, and NR groups is shown with SEMs (Fig. 1).
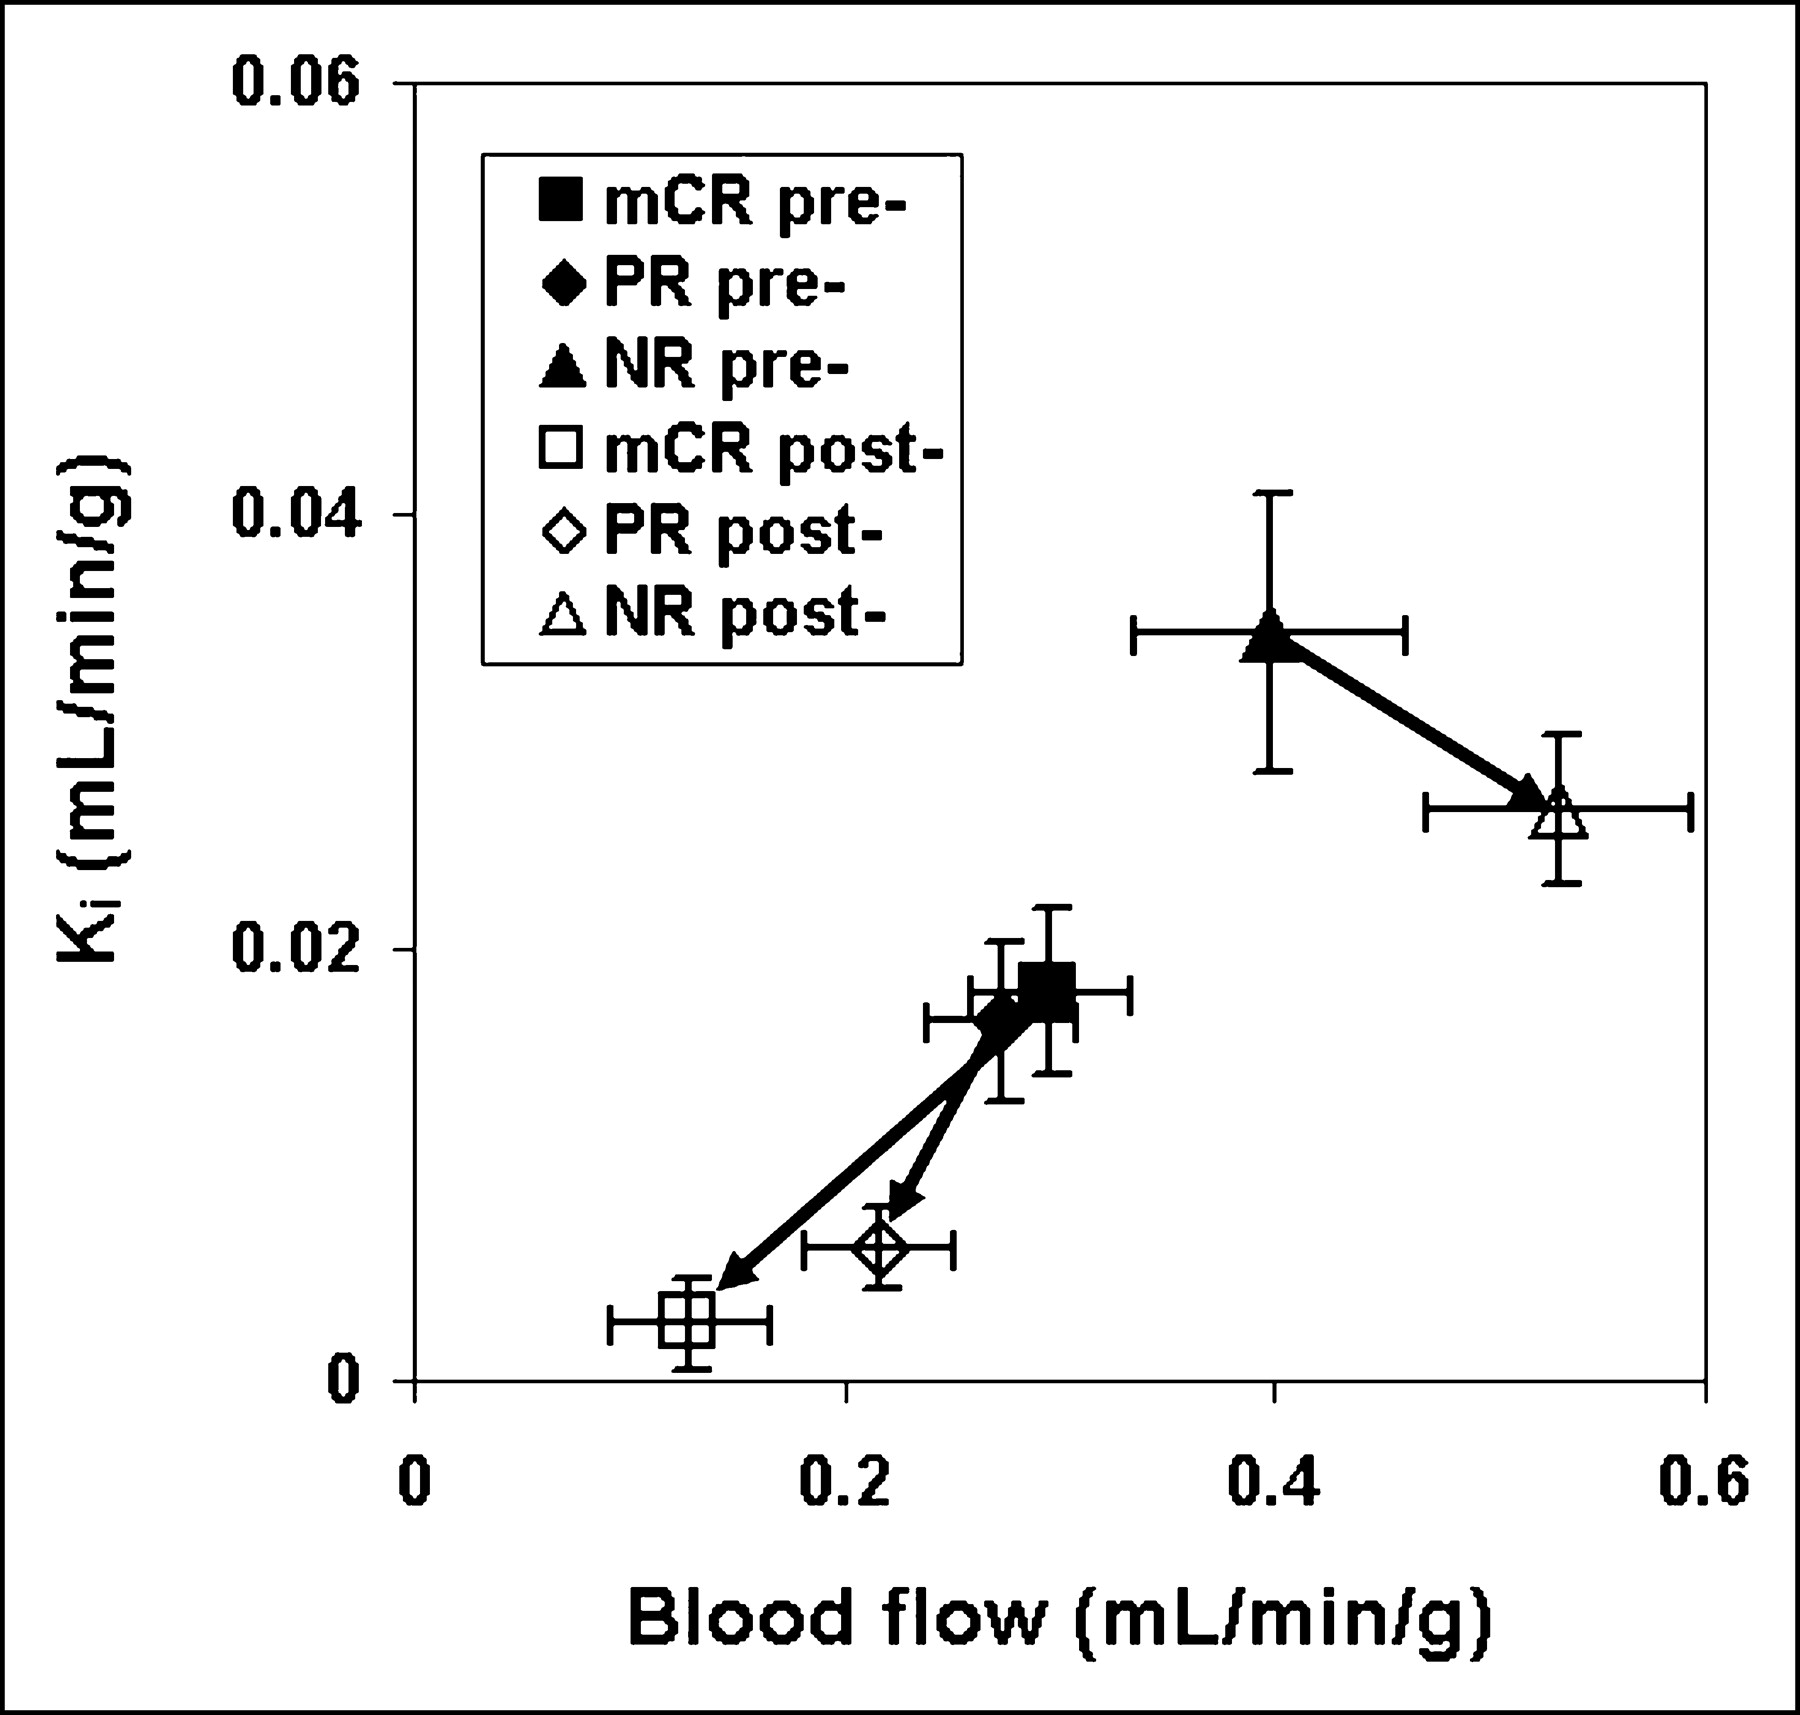
Arrows show direction of changes in mean blood flow and Ki values before → after chemotherapy. Ki decreased for all response groups. Blood flow decreased for mCR and PR groups; however, it increased for NR group. Error bars represent SEM.
Correlations Between Blood Flow and 18F-FDG Parameters
Correlations between blood flow and K1, k3, or Ki before and after chemotherapy were tested using the Pearson correlation coefficient. Before chemotherapy, the correlation coefficient between blood flow and Ki was 0.60 (Fig. 2); however, there was 1 outlying patient, which artificially elevated the correlation. After removing the outlier from all subsequent analyses (Table 2, upper half), the correlation between blood flow and Ki was much poorer (r = 0.34, P = 0.05). With the outlier excluded, a moderately strong correlation between blood flow and K1 persisted (r = 0.62, P < 0.001). There was no significant correlation between blood flow and k3 (r = 0.11, P = 0.52).
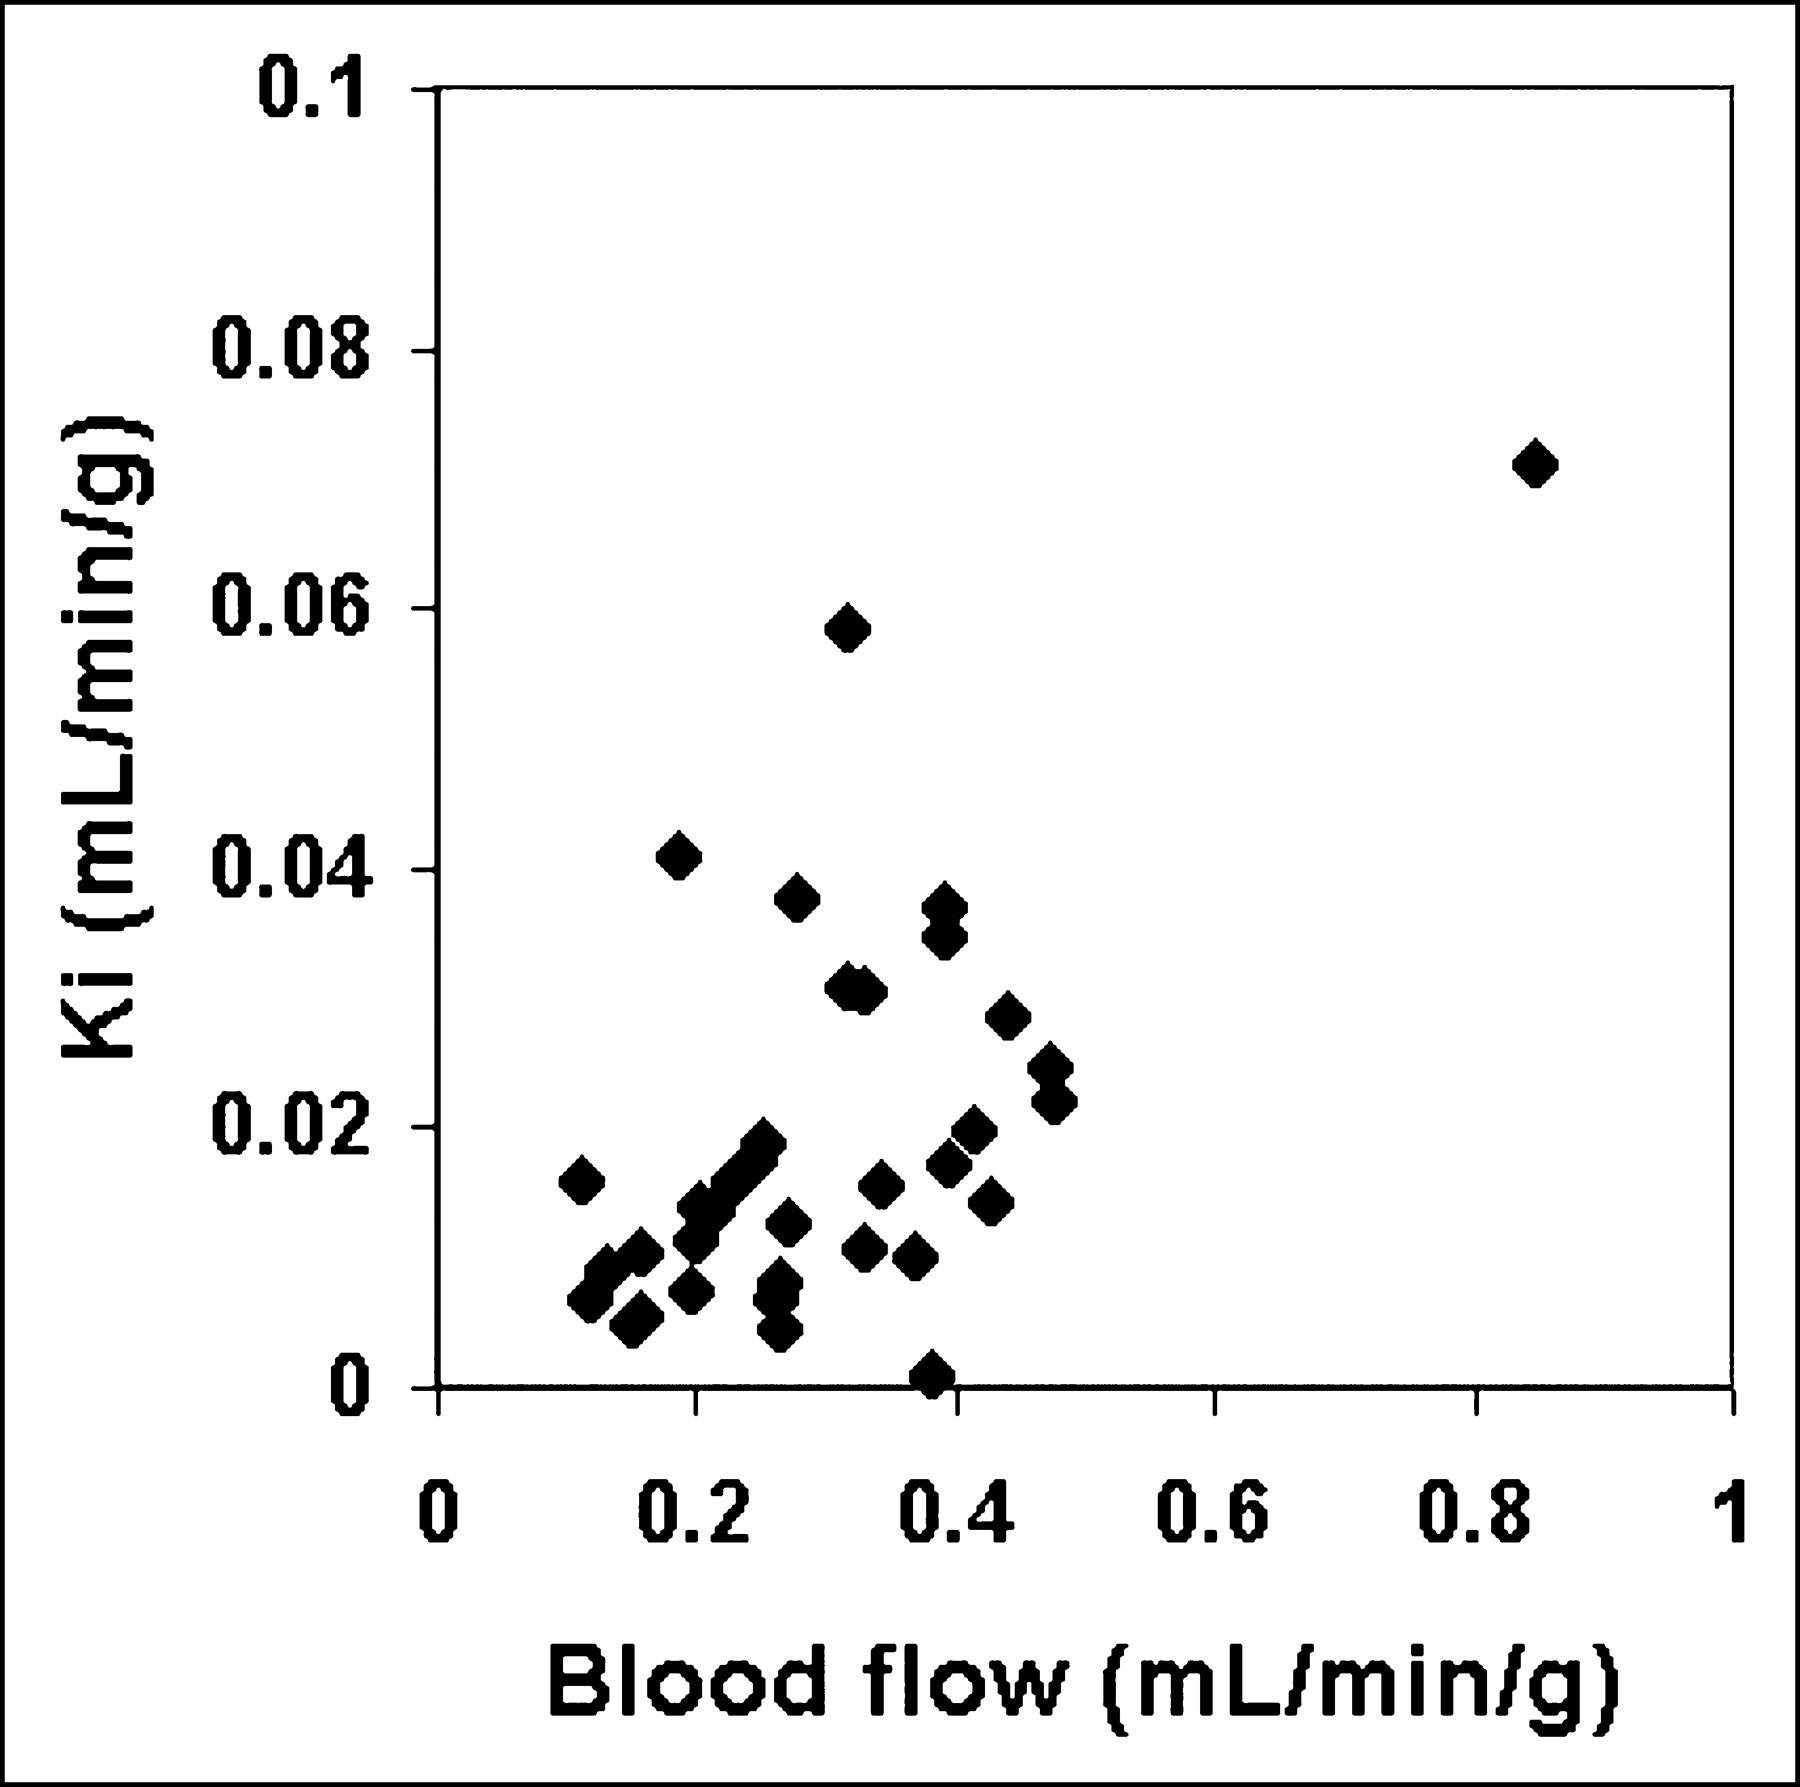
Correlation between blood flow and Ki before chemotherapy for all patients revealed 1 far outlier.
Correlations Between Blood Flow and 18F-FDG Kinetic Parameters Before and After Chemotherapy
After chemotherapy, the correlations were stronger between blood flow and Ki (r = 0.76) and k3 (r = 0.66), whereas the correlation between blood flow and K1, which was already moderately strong, improved only slightly (r = 0.81). Analyses with the nonparametric rank correlation test, Spearman ρ, revealed similar correlations and significance levels (Table 2, lower half). Representative graphs for the correlations between blood flow and Ki or K1 before and after chemotherapy are shown (Figs. 3A–3D).
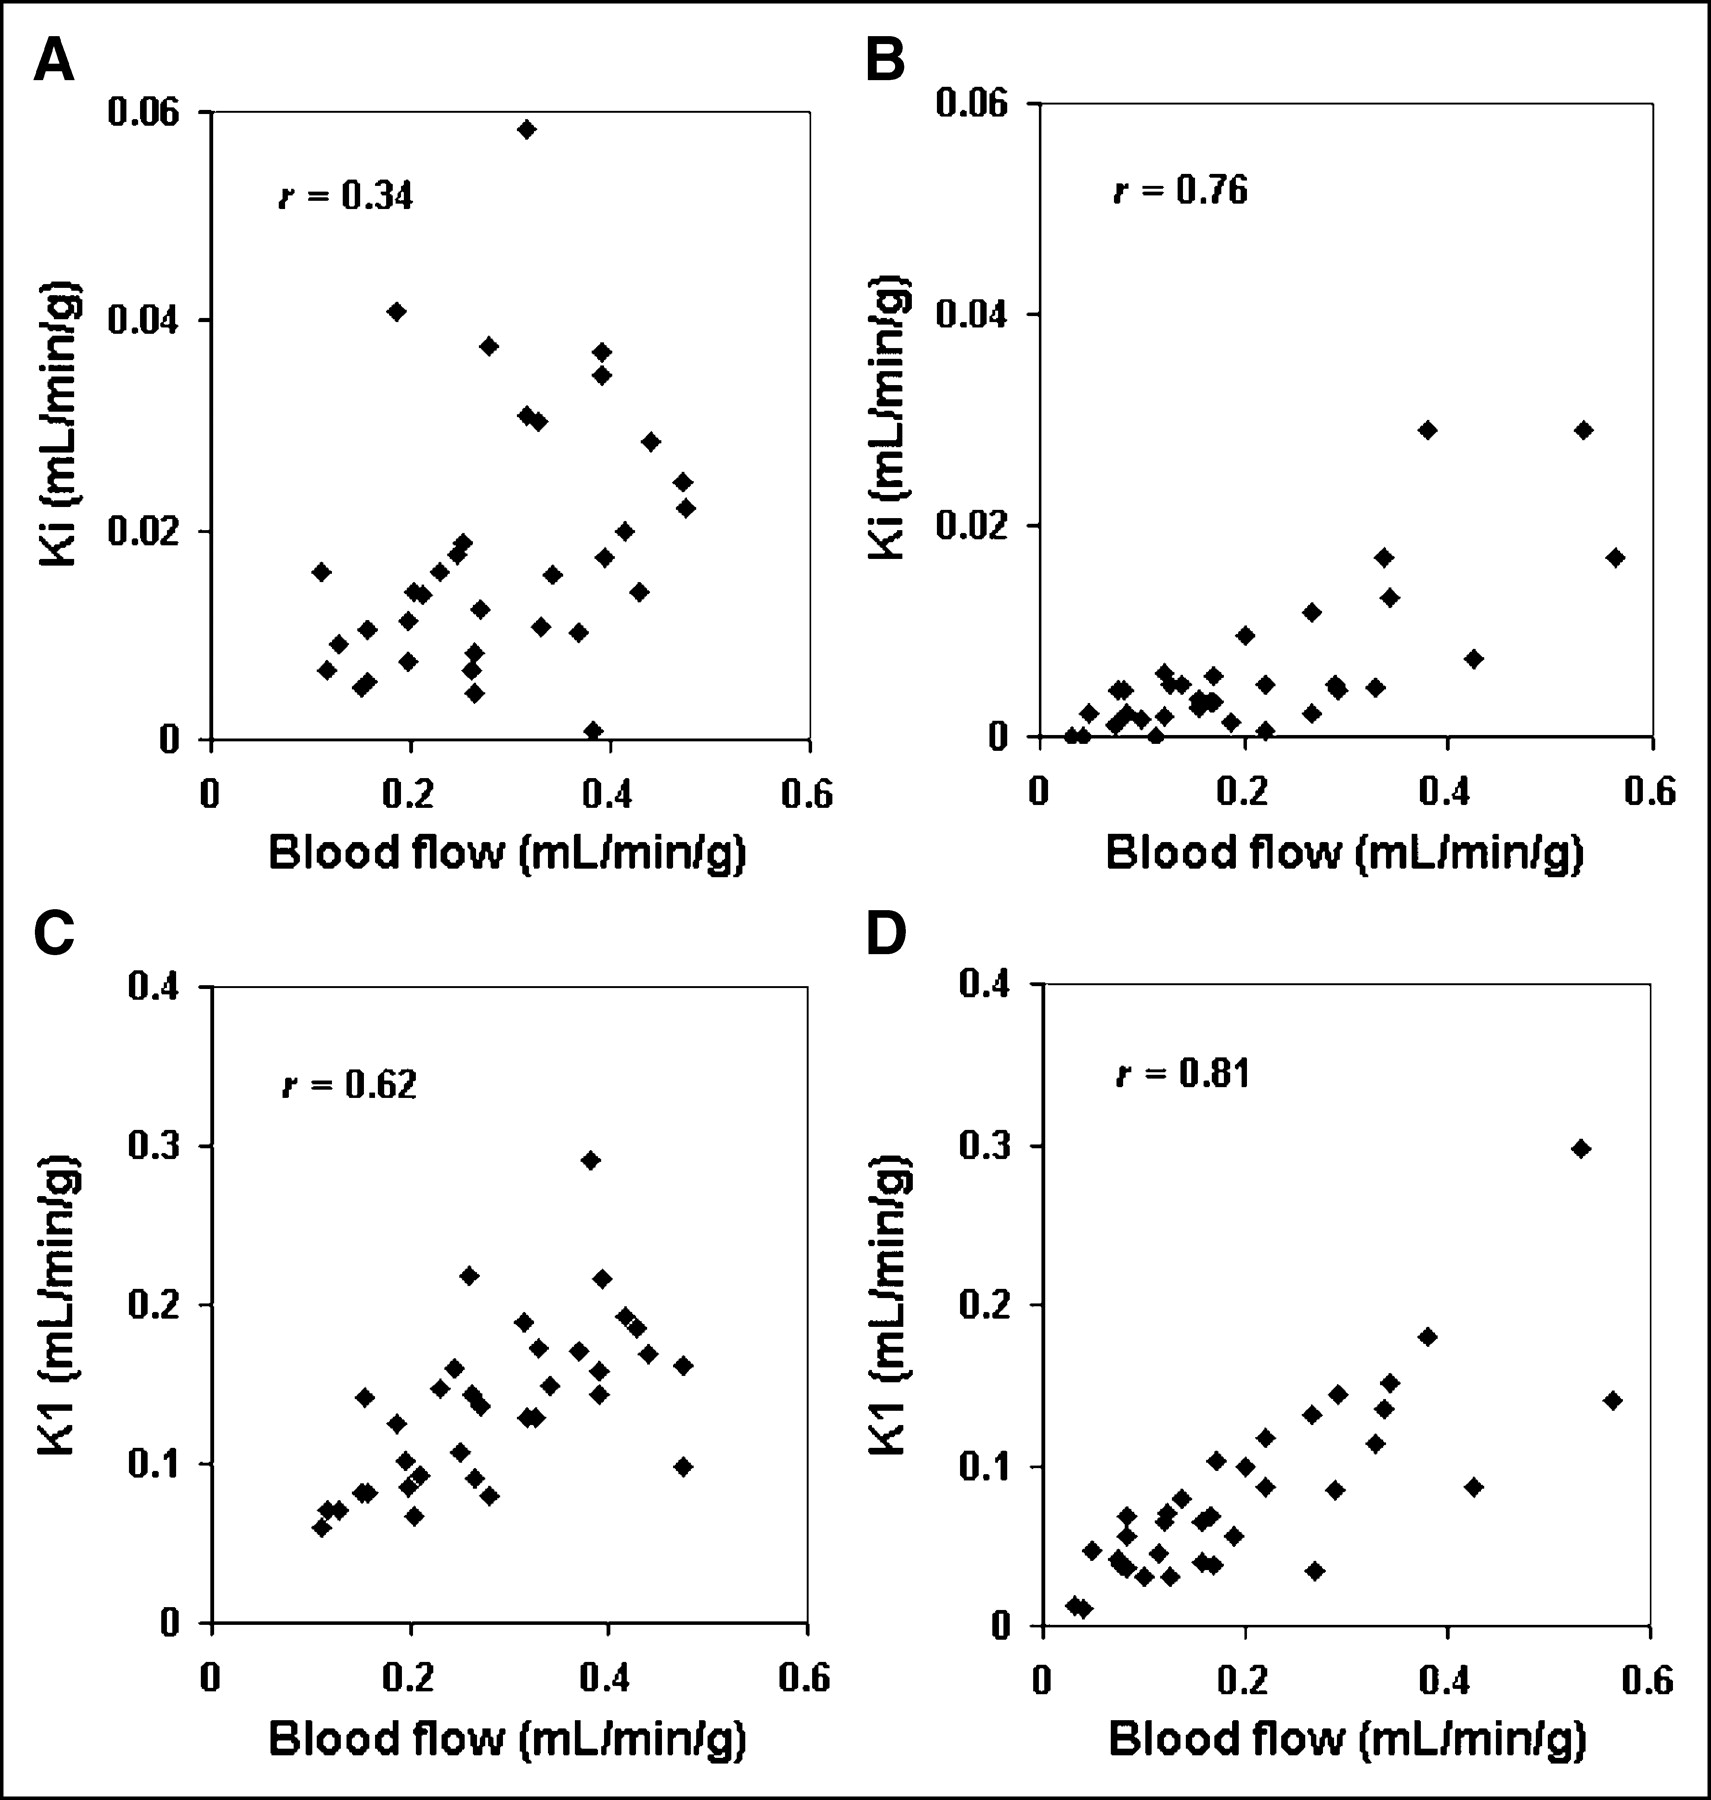
Correlations between blood flow and Ki or K1 before and after chemotherapy excluding 1 far outlier. (A) Blood flow and Ki before chemotherapy. (B) Blood flow and Ki after chemotherapy. (C) Blood flow and K1 before chemotherapy. (D) Blood flow and K1 after chemotherapy. Correlation between blood flow and Ki improved after chemotherapy.
The P values for the difference in correlation coefficient before and after chemotherapy are given on the right side of Table 2. The correlation coefficient for blood flow versus K1 did not show a significant change, whereas the correlation coefficients for blood flow versus Ki and blood flow versus k3 showed significant differences (P = 0.01 for both).
With PV corrections, correlations between blood flow versus Ki and blood flow versus k3 were somewhat poorer after chemotherapy, and before and after differences were no longer significant; however, the trends remained.
Ratios of 18F-FDG Parameters to Blood Flow
The relationship between blood flow and the 18F-FDG parameters were also examined using ratios to minimize the influence of PV effects. Ratios of the 18F-FDG parameters to blood flow before and after chemotherapy are shown in Table 3. The ratios showed a significant decline in the Ki/flow ratio (P < 0.001) and the k3/flow ratio (P < 0.001) after chemotherapy, but not for the K1/flow ratio (P = 0.11).
18F-FDG Parameters to Blood Flow Ratios Before and After Chemotherapy
Since blood flow is highly correlated with K1, we also assessed the Ki/K1 ratio after chemotherapy. Similar to the Ki/flow ratio, there was a significant decline for the Ki/K1 ratio before to after chemotherapy (P < 0.001). PV correction did not change the significance of these results. Retesting the significance levels using the Wilcoxon matched-pairs signed-ranks test showed similar results.
Ki/Flow and Ki/K1 Versus Response After Chemotherapy
The Ki/flow ratio is analogous to the metabolic rate of 18F-FDG (MRFDG)/flow ratio presented in our previous work (8), which was predictive of macroscopic response for the values before chemotherapy. In the current analysis, the ratios after chemotherapy for Ki/flow showed a trend for significant differences among the response groups (Table 4), with mean ratios of mCR = 0.020, PR = 0.031, and NR = 0.045 (P = 0.09). However, the trend was lost with PV correction. The Ki/flow ratio for the mCR group approached values seen for normal contralateral breast (0.016).
Ratios for Response Groups After Chemotherapy
We also tested the Ki/K1 ratios and found a significant difference among the response groups after chemotherapy (Table 4), with mean Ki/K1 ratios of mCR = 0.044, PR = 0.074, and NR = 0.12 (P < 0.01). The mCR group, which had the lowest ratio, decreased to a value close to that of the normal contralateral breast (0.039). Repeat analysis of the ratios with PV-corrected data showed that the relationship to response remained significant (P = 0.04).
Testing Effect of a k4 Model
By adding a k4 term in the compartment models, k4 was estimated as a mean of 0.014 ± 0.012 min−1 before chemotherapy and 0.019 ± 0.022 min−1 after chemotherapy. Using the 4-parameter model, the rate parameters K1, k2, and k3 and Ki increased on average by 11%, 40%, 77%, and 41%, respectively. This is expected as a result of the effects of a k4 term (28). Recalculating the P values for Tables 1, 3, and 4 did not change the significance for any of the comparisons for the 4-parameter model versus the 3-parameter model. In addition, glucose correction also did not change the significance for any of the comparisons in Tables 1, 3, and 4.
DISCUSSION
This study is a more in-depth analysis of dynamic image data previously reported for LABC patients studied with 18F-FDG and 15O-water PET both before and after chemotherapy using a more detailed analysis of 18F-FDG kinetics. In this more rigorous kinetic analysis, we found that glucose blood-to-tissue transport (K1) correlated with blood flow, but blood flow and glucose metabolism (Ki) in LABC were not necessarily matched before chemotherapy. This is in distinction to what has been reported for normal tissues such as the heart and brain, where tissue glucose metabolism and blood flow are tightly coupled (29,30). In our series, tumor glucose metabolism and blood flow changed differently after chemotherapy, and they became more tightly correlated. The ratio of glucose metabolism to blood flow decreased for all tumors. In more responsive tumors, the ratios decreased to values close to those of the normal breast.
Kinetic analysis suggests that the phosphorylation step (k3) is responsible for the changes before and after chemotherapy. Both k3 and the k3/flow ratio had significant declines after therapy. In contrast, K1 and K1/flow showed no significant changes. These findings are in agreement with Torizuka et al., who suggested that k3 is the rate-limiting factor in 18F-FDG accumulation in untreated breast cancers rather than K1, which reflects glucose delivery (31). In our series, we found that as chemotherapy slowed tumor growth and reduced the overall tumor burden, glucose metabolism declined, on the average, more than blood flow. The result was a closer match between metabolism and blood flow after therapy, nearer to the metabolism/blood flow ratio seen in normal breast. Thus, there was a shift in the 18F-FDG kinetic pattern after chemotherapy, driven by the rate of phosphorylation (k3) relative to glucose delivery (K1).
A possible explanation for these findings is tumor hypoxia in some tumors before therapy. Tumor hypoxia has been shown to induce cellular changes, including increased expression of glycolytic enzymes, increased angiogenesis signals, and altered cell cycling (32). Under these conditions, there is more anaerobic metabolism through glycolysis, which may lead to resistance to apoptosis (33), culminating in malignant progression (12). Another intriguing possibility suggested by recent in vitro studies (34) is that altered glucose metabolism is a downstream consequence of altered cell survival signals and is, therefore, intimately associated with resistance to apoptosis.
Resolution of hypoxia or oxidative stress with treatment might be expected to return glucose metabolism to a state closer to that of the normal tissue. In our analysis, even in cases of minimal apparent response, chemotherapy led to altered 18F-FDG kinetics with a shift closer to metabolic patterns seen in aerobic, nontumorous states. The best responding tumors had declines in the 18F-FDG flux-transport ratio (Ki/K1) to values close to those of the normal breast. This may help explain the decline in MRFDG with treatment, even in patients with minimal apparent tumor response (9).
In our study, we accounted for several factors that could lead to bias and could artificially increase the correlations between parameters—namely, PV effects, 18F-FDG-6-phosphate dephosphorylation, and varying glucose concentrations. Of these factors, PV effects were the most dramatic and PV corrections reduced the correlations between blood flow and Ki, K1, or k3. PV correction itself can lead to errors since the correlation with radiographic or clinical size measurements can be inexact; therefore, PV correction can introduce additional variability in the corrected parameters. The trends for the changes before and after chemotherapy in correlations between blood flow and Ki, K1, or k3 persisted after PV correction, suggesting that the change before and after therapy was not simply due to PV effects. Analysis of the ratios between 18F-FDG parameters and blood flow circumvented most of the potential confounding effects of partial volume and supported the results of the correlation analyses.
Limitations in our analyses include the potential influence of tumor heterogeneity in large tumors. Our analyses examined blood and glucose metabolism in the most metabolically active portion of the tumor as indicators of the “worst-case” tumor behavior. Methods for assessing tumor heterogeneity, such as parametric imaging using mixture analysis (35), may provide additional insights into tumor biology.
In our previous work, we have shown that various blood flow and glucose metabolism patterns are predictive of response to chemotherapy. Measuring both blood flow and glucose metabolism parameters at the same time provided more insight into tumor biology than either alone. We have now extended this work with a more detailed analysis of tumor 18F-FDG kinetics and found that the residual Ki/K1 after 2 mo of chemotherapy was predictive of pathologic response. One advantage of this ratio is that the data can be obtained from 1 single dynamic 18F-FDG study rather than 2 dynamic studies using 18F-FDG and 15O-water. This can circumvent the use of 15O-water, which is only available in centers with an on-site cyclotron. We also showed that K1 and blood flow are correlated both before and after therapy in accord with reports by Zasadny et al. (11). K1 may therefore be a suitable substitute for blood flow for some aspects of the analysis.
Future studies will further explore biologic mechanisms underlying our findings by examining other tumor biologic factors that may affect response and lead to alterations in blood flow and metabolism. This will involve other imaging measures of in vivo tumor biology as well as in vitro assay of gene products that affect tumor metabolism and blood flow, such as hypoxia-inducible factor 1 and vascular endothelial growth factor (32). As outcome data become available, additional analysis will be performed to assess the predictive capabilities of the kinetic parameters.
CONCLUSION
Chemotherapy alters the pattern of glucose metabolism in LABC as evidenced by a change in the relationship among 18F-FDG rate parameters with each other and with tumor blood flow. 18F-FDG metabolism and blood flow appear to be more closely matched after chemotherapy than in untreated tumors. This finding can be explained in part by a decrease in the ratio of tumor metabolism to blood flow to levels closer to those of the normal breast tissue, suggesting that tumors shift to more aerobic glycolysis after chemotherapy. Observing changes in the pattern of glucose metabolism relative to blood flow may be useful for assessing response to chemotherapy and may provide insight into the variability of tumor response.
Acknowledgments
The authors thank Drs. Julie Gralow, Georgiana Ellis, Hanna Linden, Robert Livingston, and the staff at the University of Washington Breast Cancer Specialty Clinic for collaboration and patient referrals; Dr. Thomas Lawton for assistance with pathology interpretations; Joanne Wells for modeling assistance; David Truong for providing Kinetic Imaging System software; and Dr. Kenneth Krohn for helpful comments. This work was supported by National Institutes of Health grants CA72064 and CA42045. Stipend support was provided by the Department of Radiology, University of Washington.
Footnotes
Received Feb. 8, 2004; revision accepted May 21, 2004.
For correspondence or reprints contact: David A. Mankoff, MD, PhD, Division of Nuclear Medicine, Box 356113, University of Washington Medical Center, 1959 N.E. Pacific St., Seattle, WA 98195-6113.
E-mail: dam{at}u.washington.edu
REFERENCES
In this issue


Jump to section
Related Articles
Cited By...
- Kinetic Analysis and Metabolism of Poly(Adenosine Diphosphate-Ribose) Polymerase-1-Targeted 18F-Fluorthanatrace PET in Breast Cancer
- Principles of Tracer Kinetic Analysis in Oncology, Part II: Examples and Future Directions
- Principles of Tracer Kinetic Analysis in Oncology, Part I: Principles and Overview of Methodology
- Kinetic Modeling of 18F-(2S,4R)4-Fluoroglutamine in Mouse Models of Breast Cancer to Estimate Glutamine Pool Size as an Indicator of Tumor Glutamine Metabolism
- Imaging Cancer Metabolism: Underlying Biology and Emerging Strategies
- Breast Cancer Blood Flow and Metabolism on Dual-Acquisition 18F-FDG PET: Correlation with Tumor Phenotype and Neoadjuvant Chemotherapy Response
- 18F-FDG PET-Derived Tumor Blood Flow Changes After 1 Cycle of Neoadjuvant Chemotherapy Predicts Outcome in Triple-Negative Breast Cancer
- A Continuously Infused Microfluidic Radioassay System for the Characterization of Cellular Pharmacokinetics
- Preclinical Kinetic Analysis of the Caspase-3/7 PET Tracer 18F-C-SNAT: Quantifying the Changes in Blood Flow and Tumor Retention After Chemotherapy
- Imaging of Apoptosis: The Need to Distinguish Tracer Uptake Rate from Regional Contribution of Blood Flow
- Role of Positron Emission Tomography for the Monitoring of Response to Therapy in Breast Cancer
- 18F-Alfatide II and 18F-FDG Dual-Tracer Dynamic PET for Parametric, Early Prediction of Tumor Response to Therapy
- Noninvasive Quantitative Assessment of Pulmonary Blood Flow with 18F-FDG PET
- Comparison Between 18F-FDG PET Image-Derived Indices for Early Prediction of Response to Neoadjuvant Chemotherapy in Breast Cancer
- The Flow-Metabolic Phenotype of Primary Colorectal Cancer: Assessment by Integrated 18F-FDG PET/Perfusion CT with Histopathologic Correlation
- Evaluation of Breast Tumor Blood Flow with Dynamic First-Pass 18F-FDG PET/CT: Comparison with Angiogenesis Markers and Prognostic Factors
- PET Tumor Metabolism in Locally Advanced Breast Cancer Patients Undergoing Neoadjuvant Chemotherapy: Value of Static versus Kinetic Measures of Fluorodeoxyglucose Uptake
- Monitoring Response to Antiangiogenic Therapy in Non-Small Cell Lung Cancer Using Imaging Markers Derived from PET and Dynamic Contrast-Enhanced MRI
- Tumor Metabolism and Blood Flow as Assessed by Positron Emission Tomography Varies by Tumor Subtype in Locally Advanced Breast Cancer
- Impact of Dynamic 18F-FDG PET on the Early Prediction of Therapy Outcome in Patients with High-Risk Soft-Tissue Sarcomas After Neoadjuvant Chemotherapy: A Feasibility Study
- Blood Flow-Metabolism Mismatch: Good for the Tumor, Bad for the Patient
- The Role of Radiotracer Imaging in the Diagnosis and Management of Patients with Breast Cancer: Part 2--Response to Therapy, Other Indications, and Future Directions
- Response to Therapy in Breast Cancer
- Monitoring Primary Systemic Therapy of Large and Locally Advanced Breast Cancer by Using Sequential Positron Emission Tomography Imaging With [18F]Fluorodeoxyglucose
- Reproducibility of Tumor Blood Flow Quantification with 15O-Water PET
- Tumor Metabolism and Blood Flow Changes by Positron Emission Tomography: Relation to Survival in Patients Treated With Neoadjuvant Chemotherapy for Locally Advanced Breast Cancer
- Tumor Blood Flow Measured by PET Dynamic Imaging of First-Pass 18F-FDG Uptake: A Comparison with 15O-Labeled Water-Measured Blood Flow
- Research Issues Affecting Preoperative Systemic Therapy for Operable Breast Cancer
- Tumor-Specific Positron Emission Tomography Imaging in Patients: [18F] Fluorodeoxyglucose and Beyond
- Dynamic and Static Approaches to Quantifying 18F-FDG Uptake for Measuring Cancer Response to Therapy, Including the Effect of Granulocyte CSF
- Partial-Volume Effect in PET Tumor Imaging
- Monitoring targeted therapy: is fluorodeoxylucose uptake a marker of early response?
- The potential of PET to increase understanding of the biological basis of tumour and normal tissue response to radiotherapy