


Abstract
Pulmonary blood flow (PBF) is a critical determinant of oxygenation during acute lung injury (ALI). PET/CT with 18F-FDG allows the assessment of both lung aeration and neutrophil inflammation as well as an estimation of the regional fraction of blood (FB) if compartmental modeling is used to quantify 18F-FDG pulmonary uptake. The aim of this study was to validate the use of FB to assess PBF, with PET and compartmental modeling of 15O-H2O kinetics as a reference method, in both control animals and animals with ALI. For the purpose of studying a wide range of PBF values, supine and prone positions and various positive end-expiratory pressures (PEEPs) and tidal volumes (VTs) were selected. Methods: Pigs were randomized into 3 groups in which ALI was induced by HCl inhalation: pigs studied in the supine position with a low PEEP (5 ± 3 [mean ± SD] cm of H2O; n = 9) or a high PEEP (12 ± 1 cm of H2O; n = 8) and pigs studied in the prone position with a low PEEP (6 ± 3 cm of H2O; n = 9). Also included were a control group that did not have ALI (n = 6) and 2 additional groups (n = 6 each) that had a high VT to maintain a transpulmonary pressure of greater than or equal to 35 cm of H2O and that either received HCl inhalation or did not receive HCl inhalation. PBF and FB were measured with PET and compartmental modeling of 15O-H2O and 18F-FDG kinetics in 10 lung regions along the anterior-to-posterior lung dimension, and both were expressed in each region as a fraction of their values in the whole lung. Results: PBF and FB were strongly correlated (R2 = 0.9), with a slope of the regression line close to unity and a negligible intercept. The mean difference between PBF and FB was 0, and the 95% limits of agreement were −0.035 to 0.035. This good agreement between methods was obtained in both normal and injured lungs and under a wide range of VT, PEEP, and regional PBF values (7–71 mL/kg, 0–15 cm of H2O, and 24–603 mL⋅ min−1⋅100 mL of lung−1, respectively). Conclusion: FB assessed with 18F-FDG is a good surrogate for PBF in both normal animals and animals with ALI. PET/CT has the potential to be used to study ventilation, perfusion, and lung inflammation with a single tracer.
Assessment of lung perfusion is critical for evaluating the pathophysiology of gas exchange abnormalities and can be performed noninvasively with several imaging tools: SPECT (1), PET (2–4), 4-dimensional CT (5,6), and MR imaging (7,8). PET is particularly attractive because of its high sensitivity and ability to track many other lung pathophysiologic processes (in addition to perfusion), such as ventilation (9,10), ventilation-to-perfusion ratio (11,12), and inflammation (13,14). Pulmonary blood flow (PBF) is usually assessed with PET and compartmental modeling of 15O-labeled water (15O-H2O) (2) or 13N-N2 (15) kinetics, with high reliability when compared with microspheres (2–4). However, these tracers have been used only for research purposes and are not readily available in every PET facility because their short half-life requires a cyclotron on site.
In contrast, 18F-FDG is used widely to quantify lung metabolic activity. Such activity has been taken as a surrogate for neutrophil activation during acute lung injury (ALI) (13,14). In addition to the net 18F-FDG uptake rate within the lung, some compartmental modeling techniques (16,17) estimate the regional fraction of blood (FB), accounting for the contribution of intravascular 18F-FDG to pulmonary radioactivity assessed by PET within each lung region. Because the spatial resolution of PET is relatively poor, vascular structures are included within lung regions of interest, and FB represents the volume of blood relative to the total volume of a lung region and is usually expressed in milliliters of blood per 100 milliliters of lung.
We hypothesized that FB should be the main determinant of PBF. The aim of this study was to evaluate the reliability of FB for evaluating PBF with PET; compartmental modeling of 15O-H2O kinetics assessed with PET was used as the reference method. A wide range of pulmonary perfusion values was investigated across measurements obtained in the supine and prone positions and at various levels of applied positive end-expiratory pressures (PEEPs) and tidal volumes (VTs).
MATERIALS AND METHODS
This study was approved by the Institutional Review Board of Université Lyon I for the care of animal subjects and was performed with 44 female pigs as part of an experimental investigation aimed at testing various ventilatory strategies and posture with regard to lung inflammation assessed by 18F-FDG (18).
Animal Preparation
The pigs were anesthetized with propofol and fentanyl, tracheotomized, and mechanically ventilated in the volume-controlled mode with a constant inspiratory flow (VT of 10 mL⋅kg−1) and an inspired fraction of oxygen of 21%. Muscle relaxation was obtained with pancuronium bromide. The right jugular vein was cannulated with a 3-lumen 8.5-French catheter for drug and tracer administration.
Protocol
The animals were randomized into 3 groups (n = 10 each) in which ALI was induced by HCl inhalation. Also included were a control group that did not have ALI (n = 6) and 2 additional groups (n = 9 each) that had ventilator-induced lung injury (VILI) caused by injurious ventilator settings and that either received HCl inhalation or did not receive HCl inhalation. In the ALI groups and the group that had VILI and received HCl inhalation, lung injury was induced by intratracheal instillation of 0.1 M HCl at 3 mL⋅kg−1 and was considered to have been achieved when the ratio of PaO2 to the inspired fraction of oxygen was less than 40 kPa (300 mm Hg). Additional aliquots of 1 mL⋅kg−1 might be administered until the oxygenation target was reached. The PEEP was then set at 3 cm of H2O, and 120 min were allowed for stabilization.
Pressure–volume curves were obtained for the ALI groups and fitted to a sigmoid equation (19) to determine the pressure of maximum decrease in compliance and the pressure at the inflection point. The animals were allocated to the following groups: 2 low-PEEP groups, in which the PEEP was set at 2 cm of H2O above the pressure at the inflection point in the supine and prone positions, and 1 high-PEEP group, in which the PEEP was set at 2 cm of H2O above the pressure of maximum decrease in compliance in the supine position. In each group, the plateau pressure of the respiratory system was maintained at less than or equal to 30 cm of H2O by changing the VT, and the pH was maintained at more than 7.20 by increasing the respiratory rate; the animals were monitored for 2 h.
In the control group, the PEEP was set at 3 cm of H2O, and PET was performed immediately after animals were prepared. In the group that had VILI and did not receive HCl inhalation and the group that had VILI and received HCl inhalation, the VT was increased from a PEEP of 0 cm of H2O to achieve a transpulmonary pressure of greater than 35 cm of H2O for 2 h immediately after animal preparation and 2 h after HCl instillation, respectively.
One pig in each of the low-PEEP groups, 2 pigs in the high-PEEP group, and 3 pigs in each of the VILI groups died during the study and were excluded from analysis, leaving 44 animals available for analysis.
PET Imaging Protocol
PET measurements were obtained with an ECAT EXACT HR+ scanner (Siemens). First, PET transmission scans were performed with a rotating 68Ge positron source for tissue attenuation map determination. 15O-H2O emission scans were performed after intravenous injection of the tracer at 362 ± 21 (mean ± SD) MBq over 1 min (2). Finally, 18F-FDG emission scans were performed after intravenous injection of the tracer at 178 ± 25 MBq over 30 s. From the start of 18F-FDG injection, twenty 5-s PET images, six 30-s images, six 60-s images, four 120-s images, and eight 300-s images were acquired serially. Two milliliters of blood were taken serially through a systemic arterial line during 18F-FDG image acquisition. The plasma radioactivity was measured in a well counter cross-calibrated with the PET camera, and the plasma activities of samples taken at 3 and 50 min after the start of 18F-FDG injection were used to calibrate the blood-pool region of interest (ROI) located in the left ventricle and to obtain an image-derived input function taking into account partial-volume and spillover effects (17).
PET Data Processing
ROIs were drawn around both lungs on transmission scans, superimposed onto 15O-H2O equilibrium images, and then refined to include poorly ventilated dependent lung areas. Refined ROIs were superimposed onto emission images to obtain a lung time–activity curve for each tracer. Ten lung regions with the same vertical height (bins) in the ventral-to-dorsal direction were defined for regional analyses.
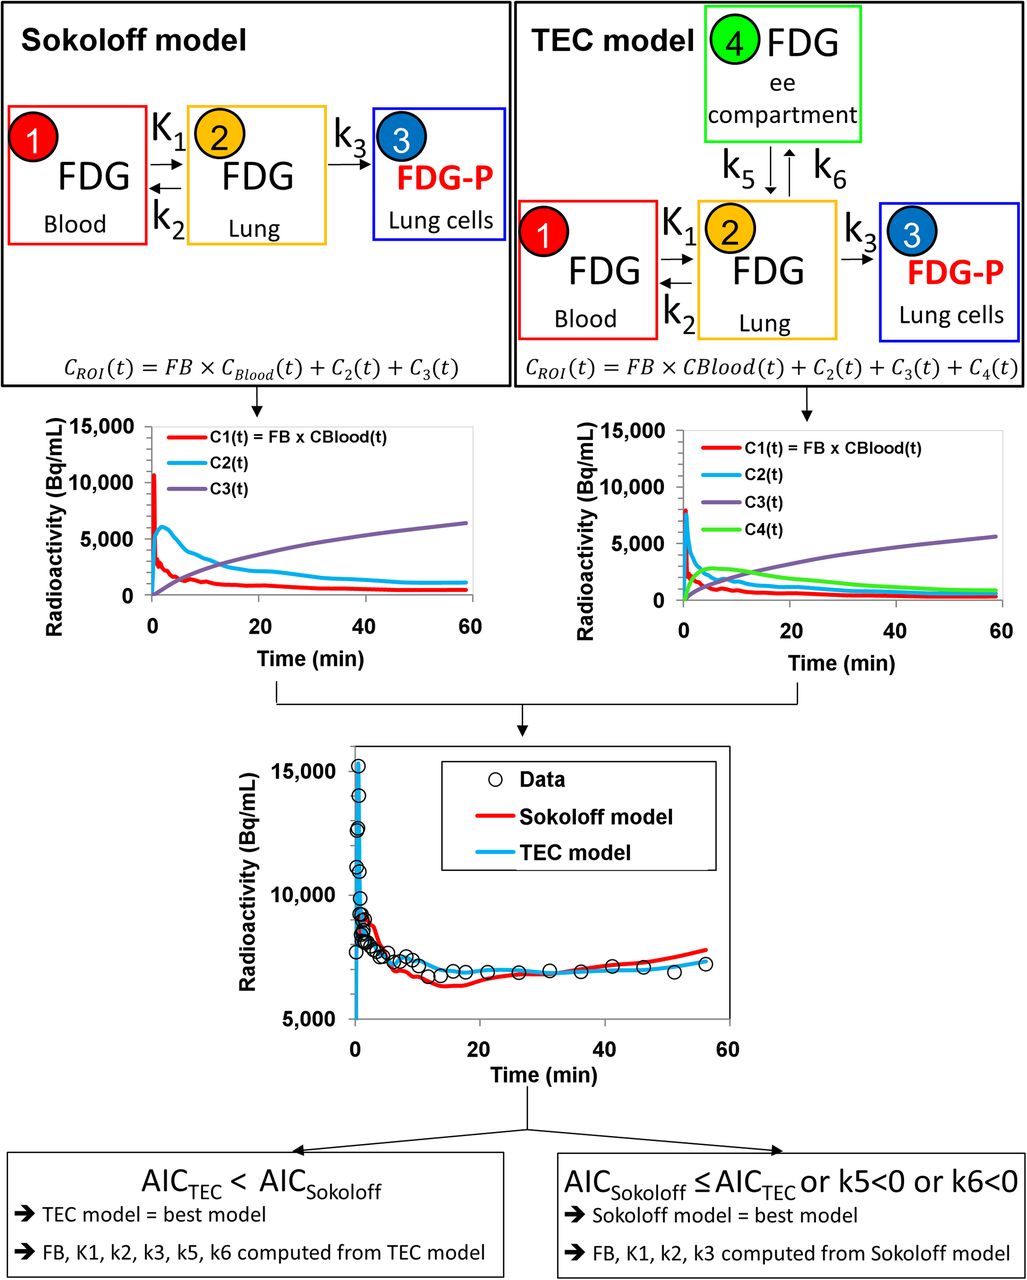
PBF was assessed in each lung region by fitting 15O-H2O time–activity curves to a single-compartment model (2,3). Lung regional 18F-FDG kinetics and the 18F-FDG image–derived input function were fitted to both the Sokoloff 3-compartment model (16) and a 4-compartment model incorporating an extravascular noncellular compartment (TEC model) (Fig. 1) (17). The TEC model may be more relevant than the Sokoloff model for edematous lung regions because the former accounts for an (additional) extravascular noncellular compartment spatially disconnected from cells trapping 18F-FDG. However, the Sokoloff model is more appropriate for lung regions lacking an extravascular noncellular 18F-FDG pool (presumably nonedematous lung regions).

Model selection. For each ROI, lung time–activity curves were fitted by use of blood time–activity curve as input function and 2 compartmental models: Sokoloff 3-compartment model with 4 parameters (K1, k2, k3, and FB) (compartment 1: 18F-FDG in blood; compartment 2: extravascular 18F-FDG in lung tissue; and compartment 3: phosphorylated 18F-FDG [FDG-P] entrapped in lung cells) and 4-compartment TEC model with 6 parameters (K1, k2, k3, k5, k6, and FB) (compartment 1: 18F-FDG in blood; compartment 2: extravascular 18F-FDG in lung tissue, constituting precursor pool for 18F-FDG phosphorylation [precursor compartment]; compartment 3: FDG-P entrapped in lung cells [metabolite compartment]; and compartment 4: extravascular extracellular [ee] 18F-FDG not directly available for phosphorylation [extravascular noncellular compartment]). Tracer concentration originating from each compartment—C1(t), C2(t), C3(t) and, eventually C4(t)—over time was computed by compartmental modeling; sum of tracer concentrations in compartments over time was equal to tracer concentration in lung ROI assessed with PET—CROI(t). Tracer concentration in blood compartment in lung ROI—C1(t)—was computed as FB in ROI times tracer concentration in blood (CBlood) in left ventricle, as measured with PET, corrected for spillover and partial-volume effects. TEC model was chosen over Sokoloff model (17) if values computed for both k5 and k6 were positive (because negative values are unrealistic) and if Akaike information criterion (AIC) of TEC model was lower than AIC of Sokoloff model (AIC being tradeoff between goodness of fit and number of parameters required by parsimony).
Model parameters were estimated with a generalized least squares algorithm and an autoregressive Laplacian filter (17,20). For each time–activity curve, model rate constants and FB were computed from the model with the best fit across the data (Appendix). The best model was selected as the model with the lowest Akaike information criterion (17).
Data and Statistical Analysis
Because regional PBF and FB values are expressed in different units (mL⋅min−1⋅100 mL of lung−1 and mL of blood⋅100 mL of lung−1, respectively), they were normalized on the basis of the sum of their 10 regional values in each experimental condition, so that normalized values represented the fraction of PBF or FB in a particular region relative to the whole lung.
Values are expressed as mean ± SD. Correlation between measurements was tested by linear regression. Agreement between PBF assessed on 15O-H2O scans and FB assessed on 18F-FDG scans as a surrogate for lung perfusion was tested with the Bland–Altman method for repeated measurements (21). The level of statistical significance was set at less than 0.05.
RESULTS
Absolute values of PBF and FB (i.e., before normalization) were correlated (R2 = 0.63; P < 0.001; data not shown). After normalization, the correlation increased (R2 = 0.90; P < 0.001); the slope of the regression line was close to unity, and the intercept was negligible (Fig. 2). Bias was 0, limits of agreement were −0.035 to 0.035 (i.e., ±3.5% of total lung PBF), and the pattern of residuals exhibited no evidence for heteroscedasticity (Fig. 3).

Relationship between regional PBF and FB. PBF and FB in each region were expressed as fractions of their values in whole lung. Each symbol represents lung region. Ten lung regions were studied in each of 44 pigs, for total of 440 lung regions. Solid line is regression line. Broken lines are 95% confidence intervals of predicted values.
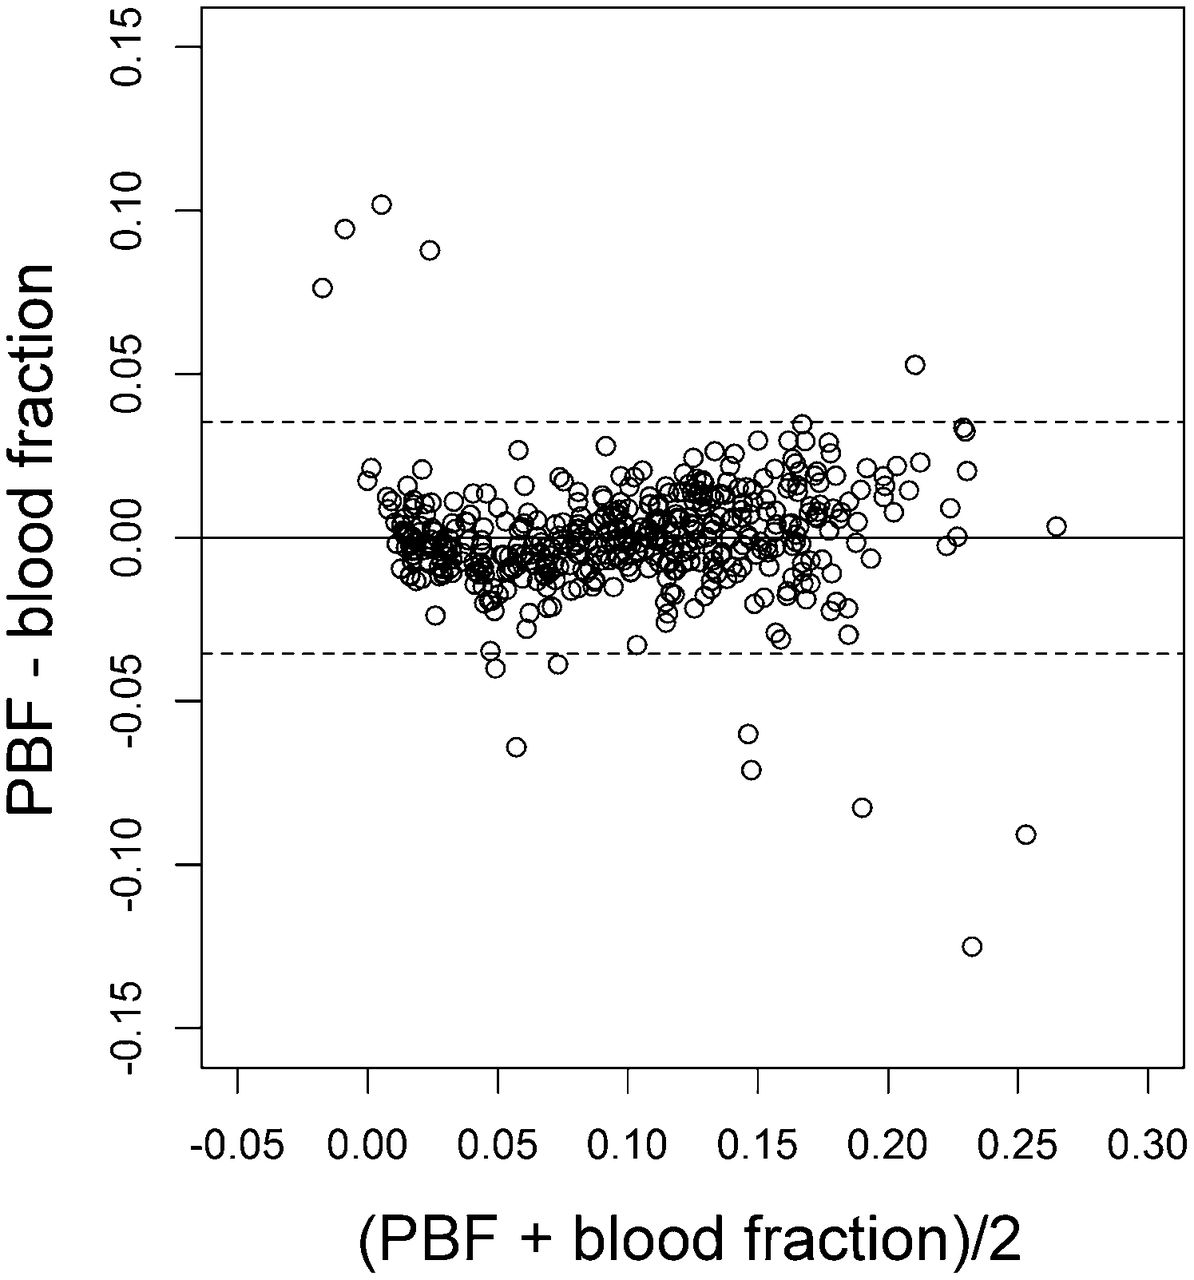
Assessment of bias between regional PBF and FB with Bland–Altman representation. PBF and FB in each region were expressed as fraction of their values in whole lung. Each symbol represents lung region. Solid line and broken lines are mean and 95% confidence interval limits of difference between PBF and FB, respectively.
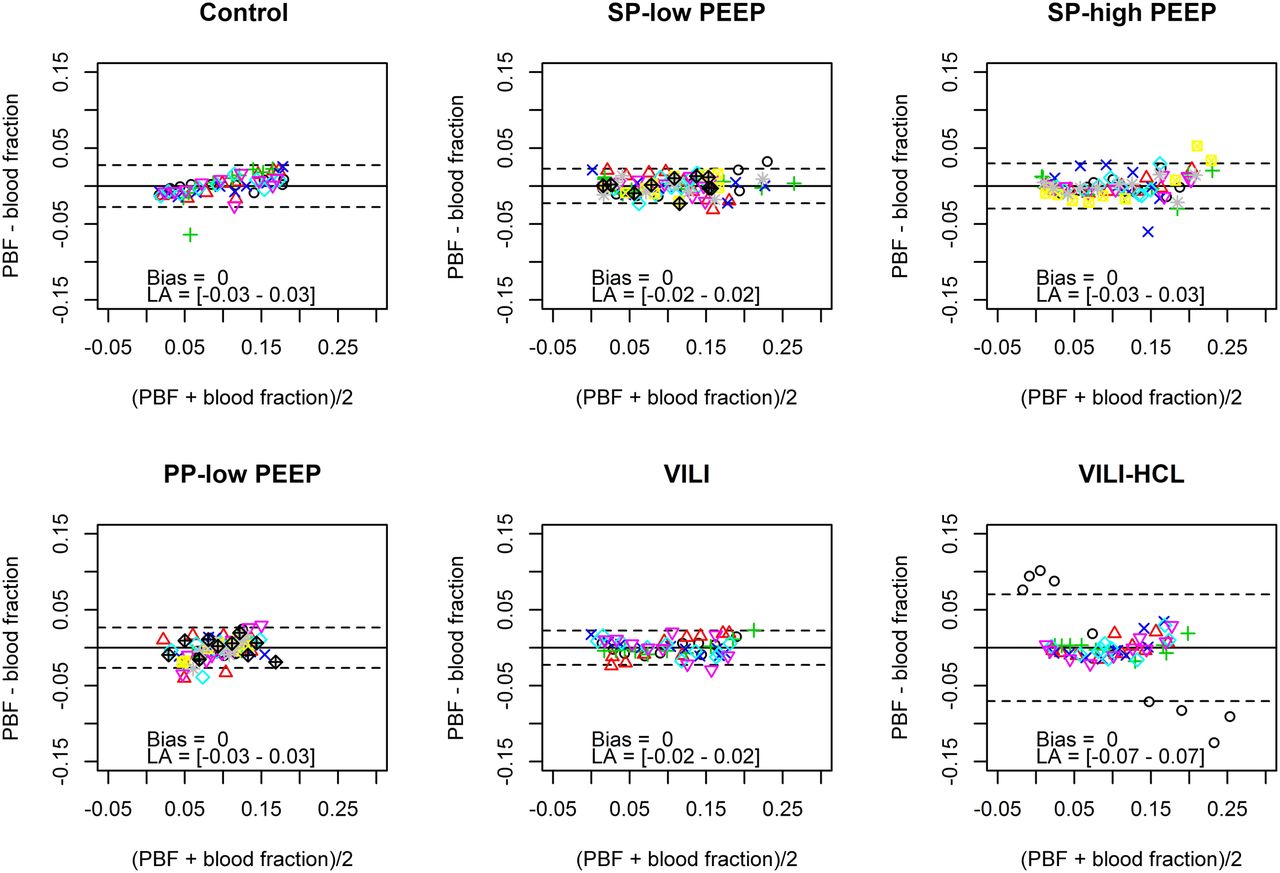
Regional PBF and FB values remained correlated in each experimental group (P < 0.001), with R2 of 0.76 in the group that had VILI and received HCl inhalation, 0.86 in the low-PEEP group in the prone position, 0.95 in the high-PEEP group in the supine position, and 0.96 in the other 3 groups (data not shown). In each experimental group, bias was 0, and the limits of agreement were −0.02 to 0.02, −0.03 to 0.03, or −0.07 to 0.07 (Fig. 4). This good agreement between methods was obtained in both normal and injured lungs and over wide ranges of VT (7–71 mL⋅kg−1), PEEP (0–15 cm of H2O), and regional absolute PBF (6–623 mL⋅min−1⋅100 mL−1) values (Table 1). Finally, the patterns of anterior-to-posterior distributions for both PBF and FB were similar in the 6 experimental groups (Fig. 5).

Assessment of bias between regional PBF and FB in each experimental group with Bland–Altman representation. PBF and FB in each region were expressed as fractions of their values in whole lung. Each symbol represents lung region, and lung regions in same animal are represented by same symbol in each experimental group. Solid line and broken lines are mean and 95% confidence interval limits of difference between PBF and FB, respectively. LA = limits of agreement; PP = prone position; SP = supine position, VILI = VILI group without HCl; VILI-HCl = VILI group with HCl.

Anterior-to-posterior distribution of PBF (blue circles) and FB (red circles) in each experimental group. PBF and FB in each region were expressed as fractions of their values in whole lung. Circles represent means, and bars represent standard deviations. Bins are lung regions with same vertical heights along ventral-to-dorsal direction. Lower bins are more ventrally located, and higher bins are more dorsally located. PP = prone position; SP = supine position; VILI = VILI group without HCl; VILI-HCl = VILI group with HCl.
Characteristics of Lung Injury, Ventilatory Settings, and PET Measurements in Experimental Groups
DISCUSSION
The main findings of the present study were that assessment of FB by compartmental modeling of 18F-FDG kinetics provides an unbiased and precise estimation of PBF and that this method is reliable in both normal animals and animals with lung injury and over wide ranges of VT and PEEP values. Taken together, these findings encourage the use of this technique to assess PBF when 18F-FDG PET is performed.
The present study has several strengths. First, the method that we used as the reference method (PET with 15O-H2O) can be considered to be the gold standard for quantifying PBF in living subjects. Indeed, to our knowledge, PET with 15O-H2O is the only imaging technique that has the potential to quantify PBF and that has been formally validated against radioactive microspheres (2,3). Furthermore, the present study is the first to attempt to quantify PBF with 18F-FDG. Mullani et al. (22) previously compared PBF assessed with 15O-H2O and 18F-FDG in solid tumors in various organs using a simple single-compartment model under the assumption of complete first-pass tracer extraction during the first 2 min after tracer injection. The authors found a good correlation (R2 = 0.74) between methods but excluded regions with blood flow greater than 70 mL⋅min−1⋅100 g−1 (whereas PBF may exceed 2,000 mL⋅min−1⋅100 g−1 (23,24)). For locally advanced breast cancer, Tseng et al. (25) found significant correlations (R2 values of 0.38 and 0.66 before and after chemotherapy, respectively) between PBF assessed with 15O-H2O and the 18F-FDG transport rate constant from blood to tissue (K1) when they used a 3-compartment model with a fixed FB (4 mL of blood⋅100 mL of lung−1). This approach is not suitable for the lung because blood volumes are highly variable across lung regions (ranging from 0–25 mL of blood⋅100 mL of lung−1) (Table 1) and are influenced by mechanical ventilation settings. Zasadny et al. (26) found a significant correlation (R2 = 0.71) between blood flow assessed with 15O-H2O and 18F-FDG K1 when they used a 3-compartment model for breast cancer; that result was not replicated in the present study (R2 = 0; data not shown).
Although the underlying cause of this discrepancy remains speculative, it could be explained by the fact that K1 may be used only as a surrogate measurement for blood flow if the tracer permeability–surface area product is large relative to blood flow (27). Although the distribution of water and, hence, 15O-H2O has repeatedly been shown to be flow limited rather than diffusion limited, even at high blood flow (28,29), the tracer permeability–surface area product for glucose and, hence, 18F-FDG is substantially lower than that of water (29,30). The latter data suggest that 18F-FDG is a diffusion-limited tracer, even at relatively low blood flow (20–40 mL⋅min−1⋅100 g−1) (29). Furthermore, because PBF may exceed 2,000 mL⋅min−1⋅100 g−1, it may largely overcome the blood flow of other organs (23,24), whereas myocardial blood flow at exercise in humans amounts to 200–250 mL⋅min−1⋅100 g−1 (31). Therefore, the 18F-FDG diffusion problem may be even more prominent in the lung when K1 is to be used to quantify PBF.
First-pass 18F-FDG uptake is another option for quantifying blood flow with PET and the simple blood-flow model (32) and has been shown to correlate well with blood flow assessed with 15O-H2O in tumors (22). However, low first-pass 18F-FDG extraction, significant venous egress, and trapping of phosphorylated 18F-FDG during image acquisition are well-known limitations of this model (22), among others, and may explain the mild correlation between first-pass 18F-FDG uptake and PBF assessed with 15O-H2O in the present study (R2 = 0.56; data not shown). Other strengths of the present study are the extremely wide range of regional PBF values achieved (2 orders of magnitude) (Table 1) and the high reliability of PBF assessment.
Nevertheless, the present study has limitations. First, FB is not a direct estimate of PBF but may be more related to regional blood volume. However, FB should be viewed as the main determinant of PBF, because 90% of PBF variance in the present study could be explained by variations in FB as a consequence of an R2 of 0.90. Should other parameters influence PBF, their contributions would be minor and should not alter significantly the relationship between PBF and FB. Because the central volume principle states that PBF equals blood volume divided by mean transit time, the good correlation between normalized FB and PBF in the present study suggested that mean pulmonary transit times were not significantly different among lung regions. Whether this phenomenon exists in patients with ALI remains speculative, but it was previously observed in healthy people during exercise (33). Interestingly, the same excellent correlation (R2 = 0.84) between blood flow and blood volume was recently found in anesthetized, mechanically ventilated pigs (34). A weaker, although significant, correlation between lung perfusion and pulmonary blood volume (R2 = 0.50) assessed with MR imaging was also found in 23 patients (35). These data might suggest that our findings can be extrapolated to patients.
Another limitation of the present study is that FB had to be normalized to improve the correlation with PBF, suggesting significant variability among the animals in the study. Nevertheless, absolute values for regional PBF can be easily obtained by combining relative PBF measurements with a noninvasive estimation of absolute cardiac output by use of echocardiography (36) or bioimpedance (37,38). Furthermore, PBF normalization is often required to control for changes in cardiac output between subjects or between time points when multiple measurements are successively obtained in the same subject. Finally, the ventilation-to-perfusion ratio cannot be assessed directly with 18F-FDG scans, but this technique would be feasible with PET/CT and quantitative evaluation of VT distribution by density analysis (39).
A final limitation is that multicompartmental modeling requires extensive computer resources, precluding a voxel-by-voxel analysis of FB and, hence, lung perfusion; however, this problem may be overcome in the near future.
The clinical implications of using FB to quantify PBF may be important. First, this new method could be used in all PET facilities, eliminating the need for a dedicated cyclotron on site. Second, this method makes it possible to study ventilation, perfusion, and lung inflammation with a single tracer (i.e., 18F-FDG) and with a single PET/CT acquisition. In the specific context of ALI, such studies would allow the regional quantification not only of alveolar recruitment but also of functional recruitment (alveolar recruitment of perfused lung regions) in combination with an evaluation of neutrophil-related lung inflammation.
CONCLUSION
Estimating PBF from FB measured with 18F-FDG PET has been demonstrated to provide results comparable to those obtained with the current, noninvasive gold standard (PET with 15O-H2O). This new method is reliable in both normal animals and animals with ALI. Hybrid devices combining PET and CT have the potential to allow the study of ventilation, perfusion, and lung inflammation with a single tracer.
APPENDIX
TEC Model (Fig. 1)
Changes in 18F-FDG concentrations over time in blood [CBlood(t)], precursor [Ce(t)], metabolite [Cm(t)], and extravascular noncellular [Cee(t)] compartments may be described with the following differential equations: Eq. 1
Eq. 1 Eq. 2
Eq. 2 Eq. 3
Eq. 3
Furthermore, the sum of tracer concentrations in the compartments is equal to the tracer concentration in a lung ROI assessed with PET [CROI(t)]: Eq. 4
Eq. 4
Substituting, applying Laplace transformation, and rearranging yields (with initial conditions assumed to be 0): Eq. 5
Eq. 5
with  ,
,  ,
,  ,
,  ,
,  , and
, and  .
.
Applying inverse Laplace transformation and integrating 3 times with initial conditions assumed to be 0 yields: Eq. 6
Eq. 6
Estimates of  and
and  (
( and
and  ) are obtained by solving Equation 6 with a linear least squares method (17,40). These estimates are biased because the errors in Equation 6 are correlated (40).
An autoregressive filter  is then defined by rearranging Equation 5:
 Eq. 7
Eq. 7
Rearranging and applying inverse Laplace transformation yields: Eq. 8
Eq. 8
with  ,
,  ,
,  , and
, and  .
.
Solving Equation 8 with the generalized linear least squares algorithm yields unbiased estimates of  ,
,  ,
,  ,
,  ,
,  , and
, and  .
.
Once the macroparameters are obtained, the rate constants may be obtained as follows:
Sokoloff Model (Fig. 1)
Changes in 18F-FDG concentrations over time in blood [CBlood(t)], precursor [Ce(t)], and metabolite [Cm(t)] compartments may be described with the following differential equations: Eq. 9
Eq. 9 Eq. 10
The sum of tracer concentrations in the compartments is equal to the tracer concentration in a lung ROI assessed with PET [CROI(t)]: Eq. 11
Substituting, applying Laplace transformation, and rearranging yields: Eq. 12
with  ,
,  ,
,  , and
, and  .
.
Applying inverse Laplace transformation and integrating 2 times with initial conditions assumed to be 0 yields: Eq. 13
An estimate of  (
( ) is obtained by solving Equation 13 with a linear least squares method (40).
An autoregressive filter  is then defined by rearranging Equation 12:
 Eq. 14
Rearranging and applying inverse Laplace transformation yields: Eq. 15
with  ,
,  .
.
Solving Equation 15 with the generalized linear least squares algorithm yields unbiased estimates of  ,
,  ,
,  , and
, and  .
.
Once the macroparameters are obtained, the rate constants may be obtained as follows:
DISCLOSURE
The costs of publication of this article were defrayed in part by the payment of page charges. Therefore, and solely to indicate this fact, this article is hereby marked “advertisement” in accordance with 18 USC section 1734. Financial support for this study was provided by Université de Lyon, Lyon, France, and Bourse de Recherche Expérimentale de la Société de Réanimation de Langue Française (SRLF). We thank IBA Co., which provided us with the 18F-FDG compound. No other potential conflict of interest relevant to this article was reported.
Acknowledgments
We thank Dr. Tobias Schroeder and Dr. Jose G. Venegas (Department of Anesthesia and Critical Care, Massachusetts General Hospital and Harvard Medical School, Boston, MA) for help in implementing compartmental modeling algorithms.
Footnotes
Published online Aug. 1, 2013.
- © 2013 by the Society of Nuclear Medicine and Molecular Imaging, Inc.
REFERENCES
- Received for publication November 3, 2012.
- Accepted for publication March 26, 2013.


