


Abstract
The goal of this study was to determine the best predictive factor among image-derived parameters extracted from sequential 18F-FDG PET scans for early tumor response prediction after 2 cycles of neoadjuvant chemotherapy in breast cancer. Methods: 51 breast cancer patients were included. Responder and nonresponder status was determined by histopathologic examination according to the tumor and node Sataloff scale. PET indices (maximum and mean standardized uptake value [SUV], metabolically active tumor volume, and total lesion glycolysis [TLG]), at baseline and their variation (Δ) after 2 cycles of neoadjuvant chemotherapy were extracted from the PET images. Their predictive value was investigated using Mann–Whitney U tests and receiver-operating-characteristic analysis. Subgroup analysis was also performed by considering estrogen receptor (ER)–positive/human epidermal growth factor receptor 2 (HER2)–negative, triple-negative, and HER2-positive tumors separately. The impact of partial-volume correction was also investigated using an iterative deconvolution algorithm. Results: There were 24 pathologic nonresponders and 27 responders. None of the baseline PET parameters was correlated with response. After 2 neoadjuvant chemotherapy cycles, the reduction of each parameter was significantly associated with response, the best prediction of response being obtained with ΔTLG (96% sensitivity, 92% specificity, and 94% accuracy), which had a significantly higher area under the curve (0.91 vs. 0.82, P = 0.01) than did ΔSUVmax (63% sensitivity, 92% specificity, and 77% accuracy). Subgroup analysis confirmed a significantly higher accuracy for ΔTLG than ΔSUV for ER-positive/HER-negative but not for triple-negative and HER2-positive tumors. Partial-volume correction had no impact on the predictive value of any of the PET image–derived parameters despite significant changes in their absolute values. Conclusion: Our results suggest that the reduction after 2 neoadjuvant chemotherapy cycles of the metabolically active volume of primary tumor measurements such as ΔTLG predicts histopathologic tumor response with higher accuracy than does ΔSUV measurements, especially for ER-positive/HER2-negative breast cancer. These results should be confirmed in a larger group of patients as they may potentially increase the clinical value and efficiency of 18F-FDG PET for early prediction of response to neoadjuvant chemotherapy.
Preoperative neoadjuvant chemotherapy has been used as standard treatment for inflammatory and nonoperable locally advanced breast carcinoma patients and is now increasingly being used for patients with operable but large breast tumors. This strategy allows patients to undergo breast-conserving surgery and provides information on the efficacy of chemotherapy (1). Early response prediction after 1 or 2 cycles of neoadjuvant chemotherapy might enable the selection of alternative treatment strategies (2). Breast carcinoma is a composite, and immunohistochemistry allows the definition of 3 main subgroups with different therapeutic responses and different outcomes (triple-negative, human epidermal growth factor receptor 2 (HER2)–positive, and luminal tumors). Pathologic complete response (pCR) is associated with a better outcome in the HER2-overexpressed and triple-negative breast cancer patients. On the other hand, recent studies showed than in luminal tumors, especially for luminal A, the impact of pCR on a patient’s survival remains less established (3,4). Thus, an intermediate response with tumor shrinkage allowing breast-conserving surgery might be considered a reasonable clinical objective for this group.
Within this context, 18F-FDG PET has been demonstrated to be a potent predictive tool (5–8). Indeed, correlations between the pathologic tumor response after completion of neoadjuvant chemotherapy and the decrease in tumor standardized uptake values (SUVs) after 1 or 2 courses of chemotherapy have been demonstrated in several studies. A recent metaanalysis (8) conducted on 19 studies including 920 patients for the early prediction of primary tumor response to neoadjuvant chemotherapy reported a pooled sensitivity of 84% and specificity of 66% in identifying responders. The authors emphasized that the low pooled specificity (66%) still calls for caution.
Most studies have considered SUV measurements only—mostly SUVmax, or SUVpeak averaging the SUVmax voxel with its neighboring voxels (9). On the other hand, it has been demonstrated in several recent studies and for various malignancies that other 18F-FDG PET image–derived parameters can have a statistically significant higher predictive value than SUV in determining tumor response (10,11). These parameters, which allow for a more comprehensive tumor functional level evaluation, include metabolically active tumor volume (MATV) (11) and total lesion glycolysis (TLG), defined as the product of MATV and its associated SUVmean (12). In a recent study that compared SUVmax and TLG derived using manual delineation and threshold, SUVmax had a better predictive value than TLG in identifying pCR (13).
To the best of our knowledge, no study has investigated the predictive value, regarding response to neoadjuvant chemotherapy for breast cancer, for all of the previously described 18F-FDG PET image–derived parameters (SUVmax, SUVmean, SUVpeak, TLG, MATV) within the same study, both at baseline and during treatment time points.
The current study was therefore conducted with the objective of determining the predictive value of several 18F-FDG PET–derived parameters both at baseline and after 2 neoadjuvant chemotherapy cycles.
MATERIALS AND METHODS
Patient Population
The current study consisted of a retrospective analysis of a prospective cohort of 55 consecutive patients diagnosed with breast cancer and included in a previous clinical trial (14) performed after approval by the institutional ethical committee and with the patients’ written informed consent. The PET/CT image datasets of 3 patients could not be retrieved from the database because of a corrupt archive file, and 1 was excluded from the analysis because of insufficient initial uptake (SUVmax, 1.5) in the primary tumor. Therefore, 51 patients were included in the retrospective analysis presented in this work (Table 1).
Patient Characteristics
All patients underwent neoadjuvant chemotherapy with 4 cycles of epirubicin plus cyclophosphamide, followed by 4 cycles of docetaxel (plus trastuzumab in cases of HER2 overexpression [HER2-positive]). Patients underwent 18F-FDG PET/CT scanning at baseline and after the second cycle of neoadjuvant chemotherapy (PET1 and PET2, respectively). At the completion of chemotherapy, all patients underwent surgery (mastectomy or lumpectomy).
18F-FDG PET/CT Acquisitions
All 18F-FDG PET/CT scans were obtained at Saint Louis Hospital in Paris between July 2007 and May 2009. A rigorous imaging protocol was designed to ensure robust SUV measurements across both time points. The blood glucose level had to be no more than 7 mmol/L. For both acquisitions, patients received an intravenous injection (in the arm opposite the breast tumor using a venous line) of 18F-FDG (5 MBq/kg) after a fasting period of 6 h. After an uptake period of 60 min, all acquisitions were performed from mid-thigh level to the base of the skull with the arms raised, on a Gemini XL PET/CT system (Philips) that combines a germanium oxyorthosilicate–based PET scanner and a 16-slice Brilliance CT scanner. CT data were acquired first (120 kV, 100 mAs, no contrast enhancement). PET emission list-mode data were acquired in 3-dimensional (3D) mode, with 2 min per bed position, and reconstructed using a 3D row-action maximum-likelihood algorithm with a voxel size of 4 × 4 × 4 mm. The attenuation-corrected images were normalized for injected dose and body weight and converted into standardized uptake values (SUVs), defined as tracer concentration (kBq/mL)/(injected activity [kBq]/patient body weight [g]).
Tumor Histology and Immunohistochemistry Analysis
Tumor type was determined on the core-needle biopsy sample obtained before neoadjuvant chemotherapy. Immunohistochemical tests were performed on formalin-fixed, paraffin-embedded tissues, using specific antibodies and an automated immunostainer (XT Immunostainer; Ventana). Tumors were considered to be HER2-positive if more than 30% of invasive tumor cells showed definite membrane staining resulting in a so-called fishnet appearance; control by fluorescence in situ hybridization or silver-enhanced in situ hybridization was done for ambiguous cases. Tumors were considered estrogen receptor (ER)–negative or progesterone receptor–negative if there was less than 10% staining.
Three specific tumor subgroups as described previously were considered, namely triple-negative, ER-positive/HER2-negative (luminal), and HER2-positive.
Pathologic Tumor Response
Histopathologic response was assessed on surgical specimens at the completion of neoadjuvant chemotherapy. Response was graded in primary tumor (T) and nodes (N) according to the scale of Sataloff et al. (15), which was used in the frequently cited study by Rousseau et al. (6): TA = total or nearly total therapeutic effect, TB = greater than 50% therapeutic effect but less than total or nearly total effect, TC = less than 50% therapeutic effect but visible effect, TD = no therapeutic effect, NA = evidence of therapeutic effect and no residual disease, NB = no node metastases or therapeutic effect, NC = evidence of a therapeutic effect but metastasis still present, ND = metastasis still present and viable (no therapeutic effect). Complete and partial responders (T[A-B] with N[A-B-C]) were considered histopathologic responders, whereas patients with no response or progression (T[C-D], N[D]) were considered nonresponders.
The pCR rate, defined as absence of invasive cancer cells in the primary tumor and in lymph nodes (16), was also evaluated, and the predictive power of PET parameters to predict pCR was measured.
Investigated Parameters and Analysis
All PET image–derived parameters were extracted from the PET1 and PET2 images. For each patient, the primary tumor was identified on the PET image by a nuclear medicine physician with more than 10 y of experience and subsequently semiautomatically isolated in a 3D region of interest (ROI) containing the tumor and its surrounding background. Tumors were subsequently automatically delineated using the fuzzy locally adaptive bayesian (FLAB) algorithm (17) applied to the previously defined ROI. The FLAB approach allows automatic tumor delineation by computing a probability of belonging to a given class (e.g., tumor or background) for each voxel within the 3D ROI. This probability is calculated by taking into account the voxel’s intensity with respect to the statistical distributions (characterized by their mean and variance) of the voxels in the various regions of the image, as well as its spatial correlation with neighboring voxels in 3 dimensions. This approach has been previously validated on simulated and clinical datasets for accuracy, robustness, and reproducibility, on both homogeneous and heterogeneous MATVs (17–19).
The potential impact of partial-volume effects was also investigated by correcting the image before analysis using a state-of-the-art iterative deconvolution previously validated for oncology PET applications (20). The analysis was subsequently performed on both the original and the partial-volume-effect–corrected images.
SUVmax, SUVpeak, and SUVmean, as well as the MATV and the TLG, were then automatically calculated from the tumor delineations. SUVpeak was defined as the mean of voxel intensities in a 1.7-cm3 spheric ROI (27 voxels) centered on SUVmax (9). MATV was defined as the sum of all voxels contained in the FLAB-delineated volumes multiplied by the volume of a voxel (64 mm3). SUVmean was defined as the mean of voxel intensities in the MATV delineated by FLAB. Subsequently, TLG was determined by multiplying the MATV and its associated SUVmean. The percentage evolution of each parameter between baseline and after the second neoadjuvant chemotherapy cycle was calculated as (PET2 parameter − PET1 parameter)/PET1 parameter × 100.
Statistical Analysis
Statistical analyses were performed using MedCalc (MedCalc Software). All parameters’ distributions were expressed as median (or mean, depending on normality) ± SD and range. Normality was tested using the D’Agostino–Pearson test (21). For each parameter, its correlation with patient response was tested by determining the statistical difference between responders’ and nonresponders’ distributions using a Mann–Whitney U test. The absolute value of each parameter at PET1 and PET2 was investigated, as well as its evolution from PET1 to PET2. The predictive performance regarding the identification of responders was evaluated using receiver-operating-characteristic (ROC) analysis. Area under the curve (AUC), sensitivity, specificity, and accuracy were reported. Absolute and associated predictive parameter values extracted from the corrected PET images were compared with original ones. Subgroup analysis was also performed by considering triple-negative, HER2-positive, and ER-positive/HER2-negative tumors separately. All tests were 2-sided, and P values of 0.05 or less were considered statistically significant.
RESULTS
ER, progesterone receptor, and HER2 receptor status are provided in Table 1. Thirteen patients had triple-negative tumors, 12 had HER2-positive tumors, and 26 had ER-positive/HER2-negative tumors, which is representative (22). Considering the pathologic tumor response established at surgery (after completion of chemotherapy), there were 27 pathologic responders (53%) and 24 nonresponders (47%). pCR was found in 7 patients (13.7%), among which 3 had triple-negative and 4 had HER2-overexpressing tumors and 0 were ER-positive/HER2-negative. Figure 1 illustrates for a pathologic nonresponder and a responder the 2 scans, including delineation of the primary tumor.
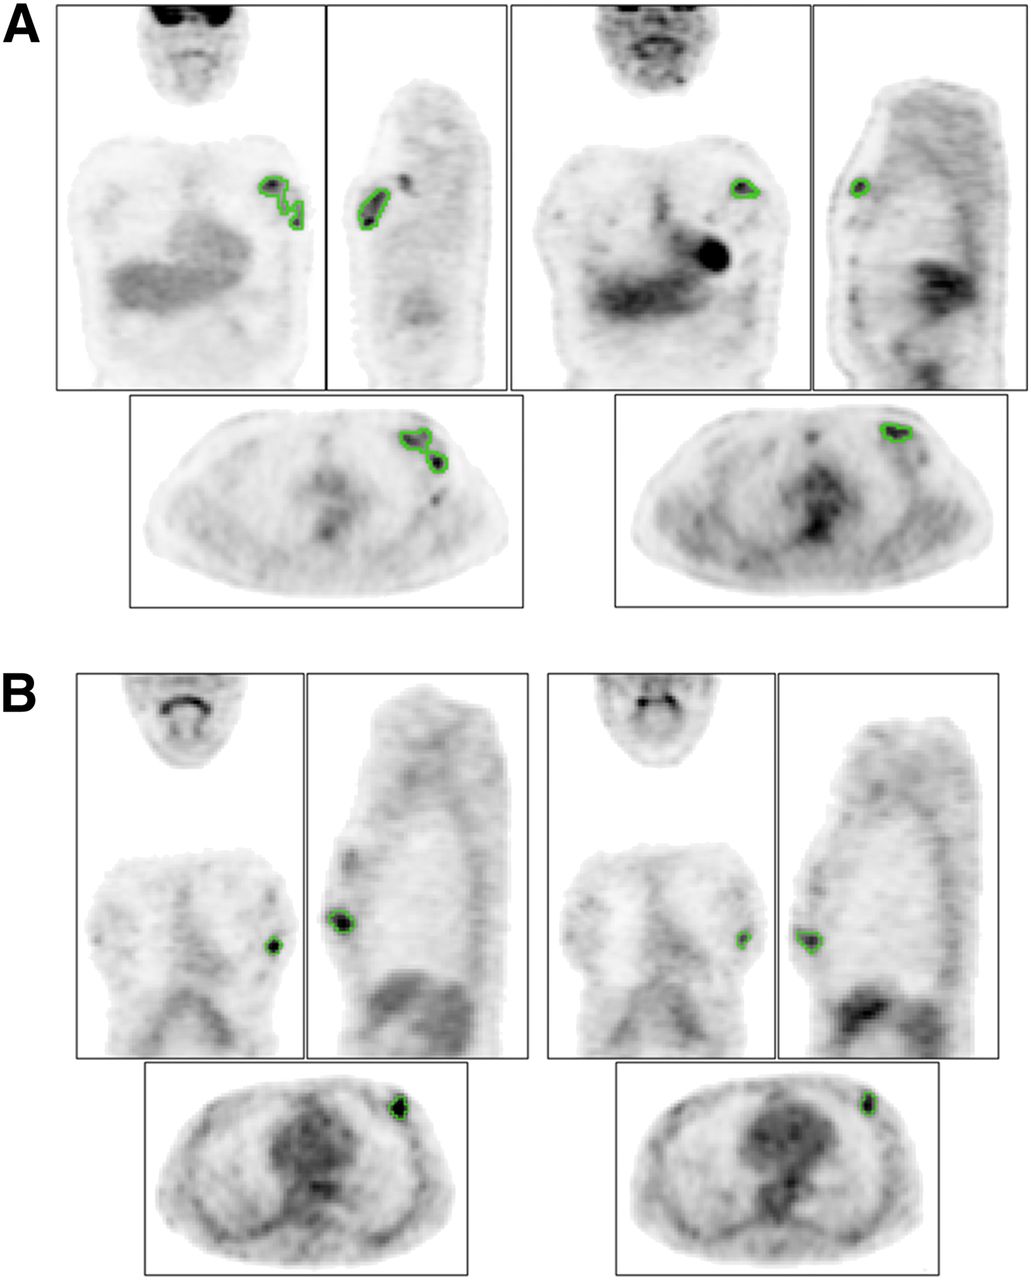
Illustration of PET1 (left) and PET2 (right) for pathologic responder (A) (ΔSUVmax, −46%, ΔTLG, −89%) and nonresponder (B) (both ΔSUVmax and ΔTLG, −43%). Green contours represent FLAB delineation.
Predictive Value of Parameters’ Absolute Values
According to the D’Agostino–Pearson test, considering the entire patient cohort (n = 51), none of the parameters’ absolute values at baseline and after the second cycle or associated variation (Δ) were normally distributed (Table 2). Similarly, the responder and nonresponder groups were not normally distributed (Fig. 2), except for the variation values (Fig. 3).
PET Parameter Values and Correlation with Response
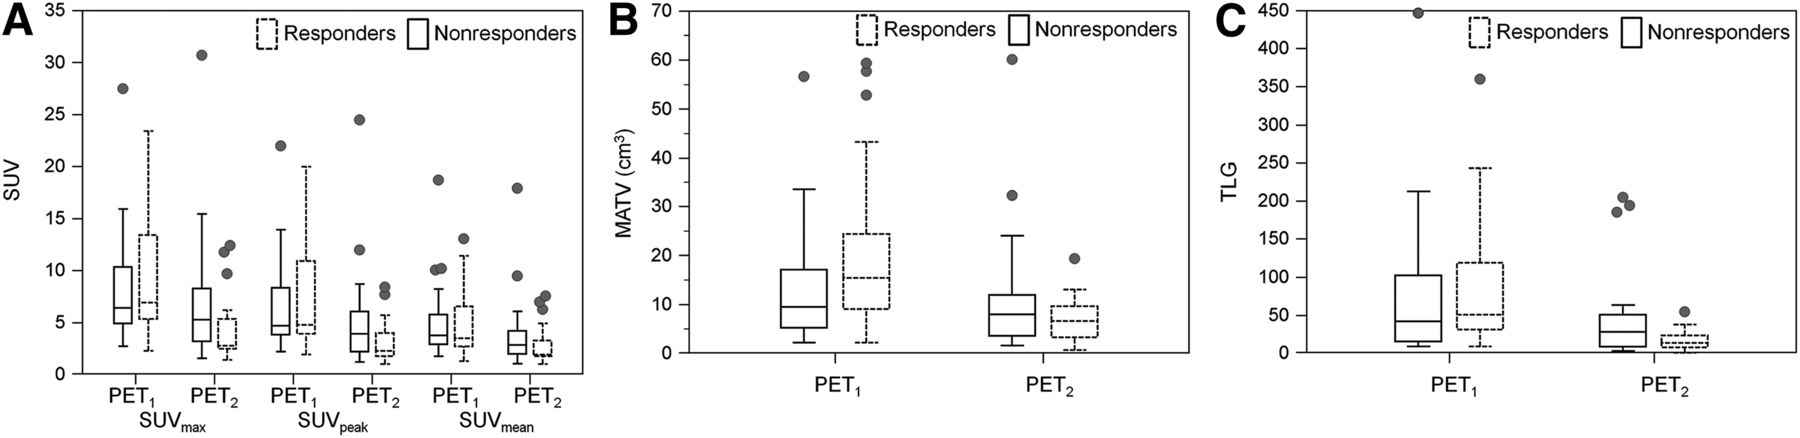
Box-and-whisker distribution plots of SUVmax, SUVpeak, and SUVmean (A); MATV (B); and TLG (C) absolute values at PET1 and PET2. One patient with extremely high MATV and TLG values does not appear for readability purposes. Central box represents values from 25th to 75th percentiles. Middle line represents median. A line extends from minimum to maximum, excluding outliers, which are displayed as separate points.

Box-and-whisker distribution plots of ΔSUVmax, ΔSUVpeak, ΔSUVmean, ΔMATV, and ΔTLG. Optimal cutoffs providing best accuracy in predicting response are displayed. Central box represents values from 25th to 75th percentiles. Middle line represents median. A line extends from minimum to maximum, excluding outliers, which are displayed as separate points.
According to Mann–Whitney U tests, no significant correlation (P > 0.1) was observed between the baseline values and histopathologic response (Table 2), distributions of the parameters among responders and nonresponders being largely overlapped (Fig. 2A), leading to a low AUC of 0.52–0.63 (Table 3).
Predictive Value According to ROC Analysis
The primary tumors of nonresponders were characterized by a higher PET2 SUVmax (5.3 ± 6.2 vs. 2.8 ± 2.9, P = 0.04) and TLG (30 ± 160 vs. 14 ± 13, P = 0.05). However, no correlation (P ≥ 0.07) was found for any of the other parameters considered (Table 2).
For all parameters, the distributions were largely overlapped (Figs. 2A–2C), as the results of ROC analysis demonstrate, with a low AUC of 0.62–0.67 (Table 3). For SUV, sensitivity (57%–69%) and specificity (71%–75%) were limited. On the other hand, for volume-based measurements, sensitivity was higher (89% and 78% for MATV and TLG, respectively) but specificity was lower (42% and 63% for MATV and TLG, respectively).
Evolution of Parameters and Associated Predictive Value
There was a global trend of decreasing MATV and associated tumors’ uptake after the first 2 neoadjuvant chemotherapy cycles, although for some patients PET image–derived parameters were also found to be increasing (Table 2). The lowest and largest decreases were observed for ΔSUVmax (−34% ± 32%) and ΔTLG (−59% ± 34%), respectively.
According to Mann–Whitney U tests, the variation of all parameters was statistically different between responders and nonresponders, especially for ΔMATV and ΔTLG (P < 0.0001), as well as ΔSUVmax (P = 0.0001) (Table 2).
According to ROC analysis, the best prediction was achieved using the ΔTLG, with a sensitivity of 96% and specificity of 92%, resulting in an accuracy of 94% (Table 3). The ΔMATV was also an accurate predictive factor (sensitivity, 93%; specificity, 88%; accuracy, 91%). On the other hand, ΔSUV measurements led to significantly lower AUCs (0.68 for ΔSUVmean to 0.82 for ΔSUVmax vs. 0.92 for ΔMATV and 0.91 for ΔTLG, P ≤ 0.01) (Fig. 4A), with significantly lower sensitivity (63%–74%), specificity (67%–92%), and resulting accuracy (71%–77%) (Table 3). The least overlapped distributions were those associated with ΔMATV and ΔTLG (Fig. 3). The optimal cutoff values maximizing sensitivity and specificity were −48%, −42%, −30%, −42%, and −56% for ΔSUVmax, ΔSUVpeak, ΔSUVmean, ΔMATV, and ΔTLG, respectively (Table 3, Fig. 3).

ROC curves related to prediction of responders for ΔSUVmax, ΔSUVpeak, ΔSUVmean, ΔMATV, and ΔTLG without (A) or with (B) partial-volume effect correction.
Tumor Subgroup Analysis
When considering ER-positive/HER2-negative patients (n = 26), all AUCs were slightly higher but with the same hierarchy as for the entire cohort: ΔTLG and ΔMATV resulted in AUCs of 0.96 and 0.98, respectively, whereas ΔSUV measurements led to AUCs of 0.69, 0.84, and 0.88 for ΔSUVmean, ΔSUVpeak, and ΔSUVmax, respectively.
The ROC analysis performed on the 12 HER2-positive and 13 triple-negative breast cancer patients resulted in nonstatistically significant different AUCs for volume-based measurements and SUVs (P > 0.05) in both cases.
Prediction of pCR
The pCR predictive value of all parameters was reduced with respect to the prediction of partial response. The hierarchy was, however, similar, with AUCs of 0.76, 0.79, 0.67, 0.63, and 0.59 for ΔTLG, ΔMATV, ΔSUVmax, ΔSUVpeak, and ΔSUVmean, respectively (Fig. 5A).
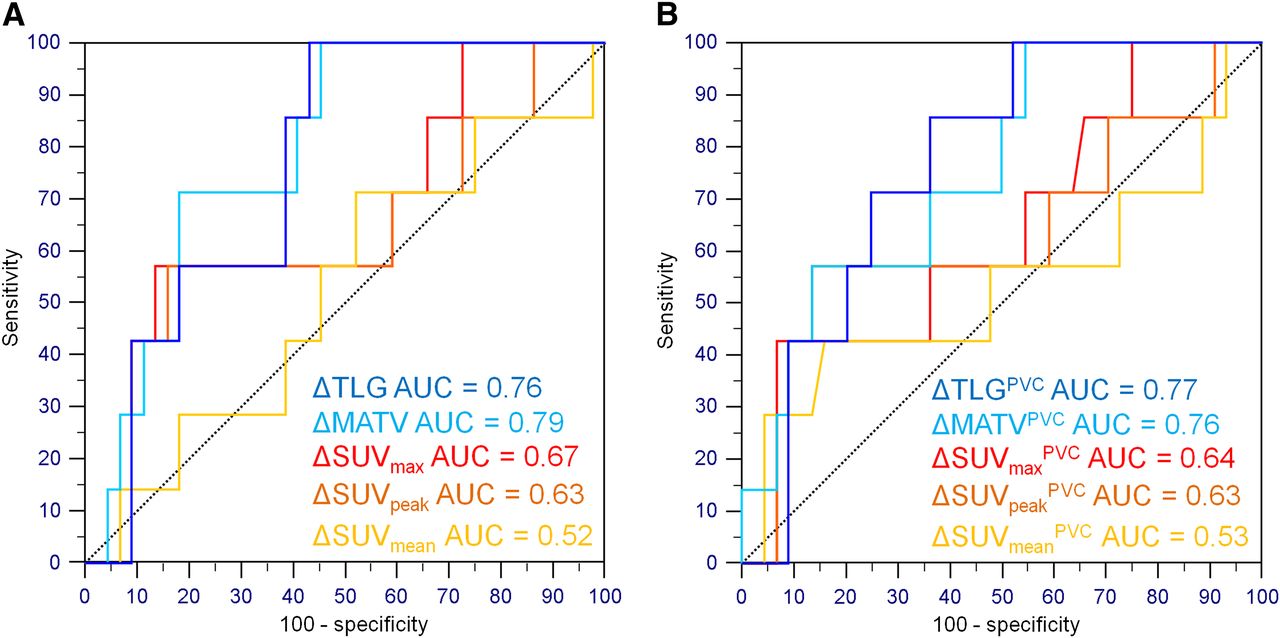
ROC curves related to prediction of pCR for ΔSUVmax, ΔSUVpeak, ΔSUVmean, ΔMATV, and ΔTLG without (A) or with (B) partial-volume effect correction.
Impact of Partial-Volume-Effect Correction
The correction of partial-volume effects had no significant impact on the resulting variation of either SUV or volume-based parameters, despite the significant impact on their PET1 and PET2 absolute values. There were therefore no statistically significant differences between the AUCs of ROC curves generated using Δ(%) calculated using the original and corrected PET image–derived parameters (Figs. 4B and 5B).
DISCUSSION
The current study was the first, to our knowledge, investigation into the predictive value of 18F-FDG PET–derived parameters on a breast cancer cohort, including MATV, TLG, and 3 different SUV measurements at baseline and their evolution. Our results contradict those of the only other study to date comparing the performance of ΔSUVmax and ΔTLG—a study that reported a higher predictive value for ΔSUVmax (13). In that previous study, ΔSUVmean, ΔSUVpeak, and ΔMATV predictive values were not considered. In addition, ΔTLG values were derived from tumor volumes delineated through manual contouring using a fixed threshold. Such a delineation approach has been previously shown to be inaccurate for PET (23,24). In our study, a previously validated robust and reproducible MATV segmentation algorithm was used. Another difference is that results in the previously reported study were reported for the prediction of pCR only, corresponding to 17% of the 142 patients, with a resulting cutoff ΔSUVmax of 83%–88%, which led to high specificity (96%) but low sensitivity (67%). In our study, we considered as pathologic responders patients with complete or partial response in the primary breast cancer and lymph nodes. According to this criterion we found that MATV and TLG were more predictive than SUV. We refined a subsequent analysis considering pCR only for responders, and we observed also that volume parameters were superior (AUC, 0.76–0.79) to SUV (0.59–0.67).
In contrast to results for several malignancies such as locally advanced esophageal cancer (11) or non-Hodgkin lymphoma (10), none of the absolute baseline values (with or without correction) was significantly associated with response. The absolute values of some parameters (SUVmax and TLG) after the second cycle (PET2) were significantly correlated with response but had limited predictive value. The most powerful predictive factors were the evolution between the baseline and the second scan.
Pathologic responders were associated with a significantly higher decrease in the 18F-FDG PET–derived indices considered. Among these, ΔTLG and ΔMATV were the best predictive factors compared with ΔSUV measurements, with significantly higher accuracy (91% and 94% for MATV and TLG vs. 71%, 76%, and 77% for ΔSUVmean, ΔSUVpeak and ΔSUVmax, respectively). With respect to the recent metaanalysis that reported an overall 84% sensitivity and 66% specificity based on ΔSUVmax (8), our ΔSUVmax results demonstrated lower sensitivity (63%) but higher specificity (92%), whereas ΔTLG resulted in both higher sensitivity (96%) and higher specificity (92%). The metaanalysis also demonstrated large differences in sensitivities and specificities among the various considered studies due to combinations of different patient populations, response criteria (pCR or partial response), and cutoff values. Our study is in line with previous findings that the reduction of PET indices after 2 cycles is a good predictor of response to neoadjuvant chemotherapy in breast cancer (8). We further demonstrated the added value of considering more complete tumor characterization in 18F-FDG PET images through the delineation of the MATV over SUV measurements only. On the one hand, these results were mostly unchanged when the analysis was performed on the subgroup of ER-positive/HER2-negative patients. On the other hand, the respective predictive values of ΔSUV, ΔMATV, and ΔTLG were similar for the triple-negative and HER2-positive breast cancer patients. However, since this subgroup analysis included a small number of patients (13 triple-negative and 12 HER2-positive), it needs to be further validated in a larger patient population. Future validation studies on larger groups of patients will be focused on ER-positive/HER2-negative patients since it is for this subgroup that the added value of ΔMATV and ΔTLG over ΔSUV seems to be the most significant. This observation can be explained by the fact that ER-positive/HER2-negative tumors are known to exhibit lower initial 18F-FDG uptake and therefore have lower decrease margins (7,25,26). These tumors are also known to only partially respond to neoadjuvant chemotherapy, requiring finer characterization of their response (27,28). Therefore, the addition of functional tumor volume–based metrics logically improves predictive accuracy for these tumors. For triple-negative and HER2-positive tumors that exhibit higher 18F-FDG uptake and associated decrease margins, as well as better pCR rates, the addition of volume-based metrics might not translate into a significantly improved predictive value over ΔSUV measurements.
Another interesting result of our study was that ΔSUVmean had significantly lower predictive value than ΔSUVpeak and ΔSUVmax (AUC of 0.68 vs. 0.79 and 0.82, respectively, P < 0.02). Considering the use of ΔSUVpeak relative to ΔSUVmax, as proposed by the PERCIST recommendations (9), in this study there were no statistically significant differences between the two (AUC, 0.79 vs. 0.82, P = 0.2), despite ΔSUVmax leading to slightly better results than ΔSUVpeak. Both these parameters describe the highest-activity region of the tumor, whereas the mean value is a better representative measurement of the entire tumor. A potential explanation for the lower predictive value of ΔSUVmean is its higher dependency on partial-volume effects compared with SUVmax and SUVpeak. It has, however, recently been shown in a group of 15 breast cancer patients that correction of partial-volume effect had limited impact on SUV reduction (29), without reporting, however, on the actual impact of this reduction on the overall response predictive value. Another study investigated the impact of correction on the prediction of response to neoadjuvant chemotherapy for breast cancer using dynamic 18F-FDG PET. The investigators found that correction eliminated significant differences in percentage 18F-FDG uptake measurement changes for nonresponders (NR) versus partial responders but not for pCR versus other response categories (30). In the aforementioned work, partial-volume effect was corrected using simplistic recovery coefficients, applied only to tumors smaller than 3 cm based on MR imaging. In our study, correction was systematically applied to all images using a voxelwise iterative image deconvolution algorithm previously validated for PET images (20). In this work, the use of correction did not change either the predictive value of the parameters or their evolution or the statistical differences between groups of response, despite a significant change in their absolute values. Finally, correction did not improve the predictive value of SUVmean or the hierarchy of performance between the 3 different SUV measurements, for either the partial or the pCR response criteria. This lack of correction impact is consistent with our previous findings (31,32).
The delineation of breast cancer MATVs is challenging because they often exhibit heterogeneous uptake distributions and complex shapes or low tumor-to-background ratios, particularly in the midtreatment scan. Therefore, the use of a robust algorithm is recommended. Within this context, the results presented here using FLAB may be replicated using alternative approaches, such as gradient-based (33) or improved fuzzy C-means (34) methods. Using less robust approaches might lead to significant differences in the results concerning the value of volume-derived parameters (11,13). In addition, this effect may be more important when the temporal evolution of such parameters is considered, as measurements have to be considered with respect to the known physiologic reproducibility ranges. Differences have to be larger than ±30% to characterize response, because of the upper and lower physiologic reproducibility limits associated with PET-derived measurements (19). Considering MATV and TLG values, these reproducibility limits were obtained using the FLAB method, whereas less robust approaches (fixed and adaptive threshold) lead to larger values (±50%–90%) (19). The FLAB method also allows for measurements that are more repeatable, with low inter- and intraobserver variability (18,19). Finally, the imaging protocol in this study was specifically designed to ensure robust and reproducible tumor characterization between both time points. For most patients, measured evolutions were outside the reproducibility limits. Optimal cutoffs were also larger: −48% for SUVmax, which is in accordance with previous findings (8), and −42% and −56% for MATV and TLG, respectively.
One potential limitation of this study was its retrospective nature and the resulting potential bias, and the lack of reliable outcome information due to the short delay between surgery and last follow-up. Another limitation was the relatively small number of patients due to the fact that the previous prospective study was limited to 55 patients (14), 4 of whom could not be included in the present study. This small sample is especially restrictive regarding the subgroup analyses of triple-negative and HER2-positive patients. The findings of this study therefore need to be validated in larger patient cohorts. Another limitation was that although nodal status was considered to define pathologic response, only primary tumors were characterized in the images to simplify the analysis. Finally, some of the patients were characterized by ΔTLG and ΔMATV decreases that were close to the optimal cutoffs but sufficient to avoid misclassification, whereas the opposite was true for SUVmax (Figs. 3). The statistical difference between AUCs of ΔSUVmax and ΔTLG might therefore be lower in larger prospective studies. However, values of ΔMATV and ΔTLG present a higher spread than ΔSUV measurements as demonstrated in Figure 3, showing their higher discriminative power as demonstrated by Mann–Whitney U tests (Table 2).
CONCLUSION
The reduction of metabolically active primary tumor volumes and associated activity measurements such as TLG after 2 neoadjuvant chemotherapy cycles predicts histopathologic tumor response with statistically significant higher accuracy (94%) than SUVmax (77%). The advantage of TLG over SUVmax was particularly evident for the 26 patients in the ER-positive/HER2-negative subgroup, and therefore we will focus on confirming these results in a larger group of ER-positive/HER2-negative patients. Such confirmation may potentially increase the clinical value and efficiency of 18F-FDG PET for early prediction of response to neoadjuvant chemotherapy.
DISCLOSURE
The costs of publication of this article were defrayed in part by the payment of page charges. Therefore, and solely to indicate this fact, this article is hereby marked “advertisement” in accordance with 18 USC section 1734. No potential conflict of interest relevant to this article was reported.
Footnotes
Published online Jan. 17, 2013.
- © 2013 by the Society of Nuclear Medicine and Molecular Imaging, Inc.
REFERENCES
- Received for publication June 12, 2012.
- Accepted for publication October 2, 2012.


Jump to section
Related Articles
Cited By...
- Repeatability of Quantitative Whole-Body 18F-FDG PET/CT Uptake Measures as Function of Uptake Interval and Lesion Selection in Non-Small Cell Lung Cancer Patients
- Imaging Diagnostic and Therapeutic Targets: Human Epidermal Growth Factor Receptor 2
- A Phase II Study of 3'-Deoxy-3'-18F-Fluorothymidine PET in the Assessment of Early Response of Breast Cancer to Neoadjuvant Chemotherapy: Results from ACRIN 6688
- Multimodal Partial-Volume Correction: Application to 18F-Fluoride PET/CT Bone Metastases Studies
- Baseline Tumor 18F-FDG Uptake and Modifications After 2 Cycles of Neoadjuvant Chemotherapy Are Prognostic of Outcome in ER+/HER2- Breast Cancer
- Role of Positron Emission Tomography for the Monitoring of Response to Therapy in Breast Cancer