


Abstract
Early changes in tumor glucose metabolism (SUVmax) and in tumor blood flow (BF) have been evaluated separately for monitoring breast cancer response to neoadjuvant chemotherapy (NAC). This study used a single 18F-FDG dual-acquisition PET examination to simultaneously assess these two imaging features and to determine whether they correlate with the same pretherapy tumor phenotypic features and whether they are comparable or complementary in predicting pathologic complete response (pCR). Methods: This prospective study included 150 women with breast cancer and an indication for NAC. A 2-min chest-centered dynamic PET acquisition was performed at the time of 18F-FDG injection, followed by a delayed static PET acquisition 90 min later. Tumor BF was calculated from the dynamic acquisition using a validated first-pass model, and tumor SUVmax was calculated from the delayed acquisition. This dual acquisition was repeated after the first cycle of NAC to measure early changes in tumor BF and SUVmax. Results: A weak correlation was found between SUVmax and BF at baseline (r = 0.22; P = 0.006). A high baseline SUVmax was associated with all biologic markers of tumor aggressiveness, including the triple-negative breast cancer subtype (P < 0.0001). In contrast, a high baseline BF was associated only with obesity (P = 0.002). The change in SUVmax (mean, −44.6% ± 27.4%) varied depending on the Scarff–Bloom–Richardson grade, overexpression of human epidermal growth factor receptor 2 (HER2-positive), and lack of hormone receptor expression (P = 0.04, P < 0.001, and P = 0.01, respectively). BF (mean change, −26.9% ± 54.3%) showed a drastic reduction only in HER2-positive subtypes (−58.7% ± 30.0%), supporting the antiangiogenic effect of trastuzumab. Changes in SUVmax outperformed changes in BF for predicting pCR in all tumor subtypes: the areas under the curve for change in SUVmax were 0.82, 0.65, and 0.90 in the triple-negative, HER2-positive, and luminal subtypes, respectively. Conclusion: Of the two biologic hallmarks of cancer evaluated in this study, a reduction in tumor glucose metabolism was more accurate than a reduction in tumor BF for predicting pCR in the different subtypes of breast cancer.
Neoadjuvant chemotherapy (NAC) is an approach used in breast cancer patients with a large primary tumor. The clinical benefit of NAC is that it increases the rate of breast-conserving surgery (1), but compared with conventional adjuvant chemotherapy, NAC does not improve patient outcomes (1). Nonetheless, studies have demonstrated that a pathologic complete response (pCR) at the end of NAC is an important surrogate marker of a favorable outcome (2,3). Thus, pCR has become a crucial endpoint in the neoadjuvant setting.
Angiogenesis and cell-energy deregulation are two hallmarks of oncogenesis (4). Both have been evaluated through different imaging modalities to assess tumor response to treatment in the neoadjuvant setting of breast cancer. Early changes in tumor glucose metabolism have been assessed mainly with 18F-FDG PET (5–7), whereas changes in tumor blood flow (BF) have been assessed using various modalities, including dynamic contrast-enhanced MRI and 15O-water PET.
In the neoadjuvant setting of breast cancer, treatment-related changes in tumor glucose metabolism (ΔSUVmax) have been reported to be a strong predictor of the pathologic response after the first or second cycle of NAC (5–9).
Different imaging modalities, such as dynamic contrast-enhanced MRI, 15O-water PET, and 1-h dynamic 18F-FDG PET, can yield kinetic parameters reflecting vascular permeability and perfusion. The quantification of tumor BF with these modalities has been reported to provide predictive and prognostic information while monitoring the effects of NAC (10–15). Because an on-site cyclotron in needed for 15O-water PET studies, and because a full, 1-h, dynamic 18F-FDG PET acquisition is hardly suitable in routine practice, there is a need to develop new analysis methods. To this end, Mullani et al. developed a 2-min dynamic first-pass PET acquisition based on a 1-compartment flow model to assess tumor BF (16,17).
The relationship and incremental value between the metabolic response and the response of tumor BF to NAC in breast cancer has not yet been fully elucidated. By using a single 18F-FDG dual-acquisition PET examination to assess both these image features, this study aimed to determine whether they correlate with the same pretherapy tumor phenotypes and whether they are comparable or complementary in predicting pCR.
MATERIALS AND METHODS
Patients and Study Design
From February 2009 to October 2014, women referred to the Centre G.F. Leclerc for clinical stage II or III biopsy-proven breast cancer with an indication for NAC were prospectively evaluated. This population overlaps those of previous articles published by our team (8,9,17–20). Patients with high glycemia (>9 mmol/L), those unwilling to undergo the complete PET examinations, and those with metastasis on the baseline 18F-FDG PET were excluded. The institutional review board approved this prospective study as a current-care study. The medical team documented the nonopposition of the patient in source documents and on the information notice provided to the patient, and the need for a signature indicating informed consent was waived.
Tumor size and lymph node involvement were evaluated on ultrasonography. The women underwent various NAC regimens. Briefly, women with human epidermal growth factor receptor 2 (HER2)–positive tumors received trastuzumab and docetaxel-based regimens, and women with triple-negative or luminal/HER2-negative tumors received 6 cycles of sequential chemotherapy with anthracyclines and taxanes, or 6 cycles of FEC100 (epirubicin, 100 mg/m2; 5-fluorouracil, 500 mg/m2; and cyclophosphamide, 500 mg/m2).
Within 1 mo after the last course of chemotherapy, the tumors were surgically removed. A pCR was defined as no residual invasive cancer in the breast or nodes, though in situ breast residuals were allowed (ypT0/is ypN0) (3).
18F-FDG PET Procedures
A first 18F-FDG PET scan was done at baseline (Gemini GXL and Gemini TF PET/CT scanners; Philips). The patients fasted for at least 6 h before intravenous injection of 18F-FDG (5 MBq/kg for the Gemini GXL studies and 3 MBq/kg for the Gemini TF studies) using an automatic PET infusion system (Intego; Medrad) at a rate of 1 mL/s. Simultaneously with the injection, the first chest-centered emission acquisition with the patient prone, using a breast imaging coil, was run in list mode for 2 min, followed by a low-dose CT scan. Reconstructions of 5- and 10-s frames were extracted. Sixty minutes after the 18F-FDG injection, a whole-body PET scan was done. Finally, 90 min after the injection, a PET scan restricted to the chest (2 bed positions) with the patient prone was performed.
A few days before the second course of chemotherapy, a second 18F-FDG PET scan was performed with the same chest-restricted early dynamic first-pass acquisition and late (90 min) static acquisition.
BF Measurements
The concept and method of measuring tumor BF from the first pass of 18F-FDG has been explained in a previous paper from our institution (17). It is based on the first-pass model of Mullani et al. described in previous reports (16,21). Volumes of interest encompassing the primary tumor and the ascending aorta were manually delineated using the 2-min dynamic summed functional and anatomic images. BF at baseline (BF1) and after the first cycle of chemotherapy (BF2) were then calculated in mL⋅min−1⋅g−1 of tumor using the following equation (16): Q(Tm) is the amount of tracer in tumor tissue at time Tm measured with the tumor volume of interest. E is the tumor first-pass extraction fraction of 18F-FDG, which is assumed to equal 1 (15). Ca(t) is the arterial concentration of the tracer at time t measured with the aorta volume of interest. Vt is the tumor volume (mL) delineated using the 2-min dynamic summed functional and anatomic images.
The BF response to chemotherapy (ΔBF) was calculated as
Tumor Glucose Metabolism Measurements
A spheroidal volume of interest encompassing the primary tumor was drawn on the 90-min chest-restricted acquisitions to measure the body-weight–corrected SUVmax at baseline (SUV1max) and after the first course of chemotherapy (SUV2max). The metabolic response (ΔSUVmax) in response to treatment was calculated as
and the ratio between SUV1max and BF1 was calculated.
Statistical Analysis
Continuous variables were expressed as median with range or as mean with SD and were compared using either the Student test or nonparametric tests, depending on the normality of the distribution. Correlations between PET variables were determined using the Pearson correlation coefficient (r). Qualitative variables were expressed as percentages and compared using the χ2 or Fisher test.
Receiver-operating-characteristic (ROC) curves were used to compare the predictive values of the different BF and SUVmax PET parameters for pCR. The areas under the curve (AUCs) were calculated with their 95% confidence intervals (95% CIs). A logistic regression model was also built to combine two different variables in ROC curve analyses. All analyses were performed using SAS software, version 9.4. The significance level was set at 0.05, except for multiple comparisons, which were handled using the Bonferroni adjustment (22).
RESULTS
Patient Characteristics
Table 1 details the characteristics of the 150 patients who were included. Median age was 49 y (range, 23–85 y). Median primary tumor size, assessed with breast ultrasonography or mammography, was 3.3 cm (range, 1.4–10 cm). The tumor subtype in most patients was luminal/HER2-negative (40.7%), followed by HER2-positive (31.3%) and triple-negative breast cancer (TNBC) (28%). pCR was achieved in 26% of the patients (39/150). The time from tracer injection to delayed breast acquisition was 84.8 ± 8.3 min (range, 68–112 min) on the baseline PET study and 85.6 ± 8.6 min (range, 66–110 min) on the interim PET study. The serum glucose level was 5.2 ± 0.7 mmol⋅L−1 (range, 2.9–7.6 mmol⋅L−1) on the baseline PET study and 5.4 ± 0.9 mmol⋅L−1 (range, 3.8–9.4 mmol⋅L−1) on the interim PET study.
Patient Characteristics
Correlation Between SUV1max, BF1, and Baseline Clinical/Histopathologic Parameters
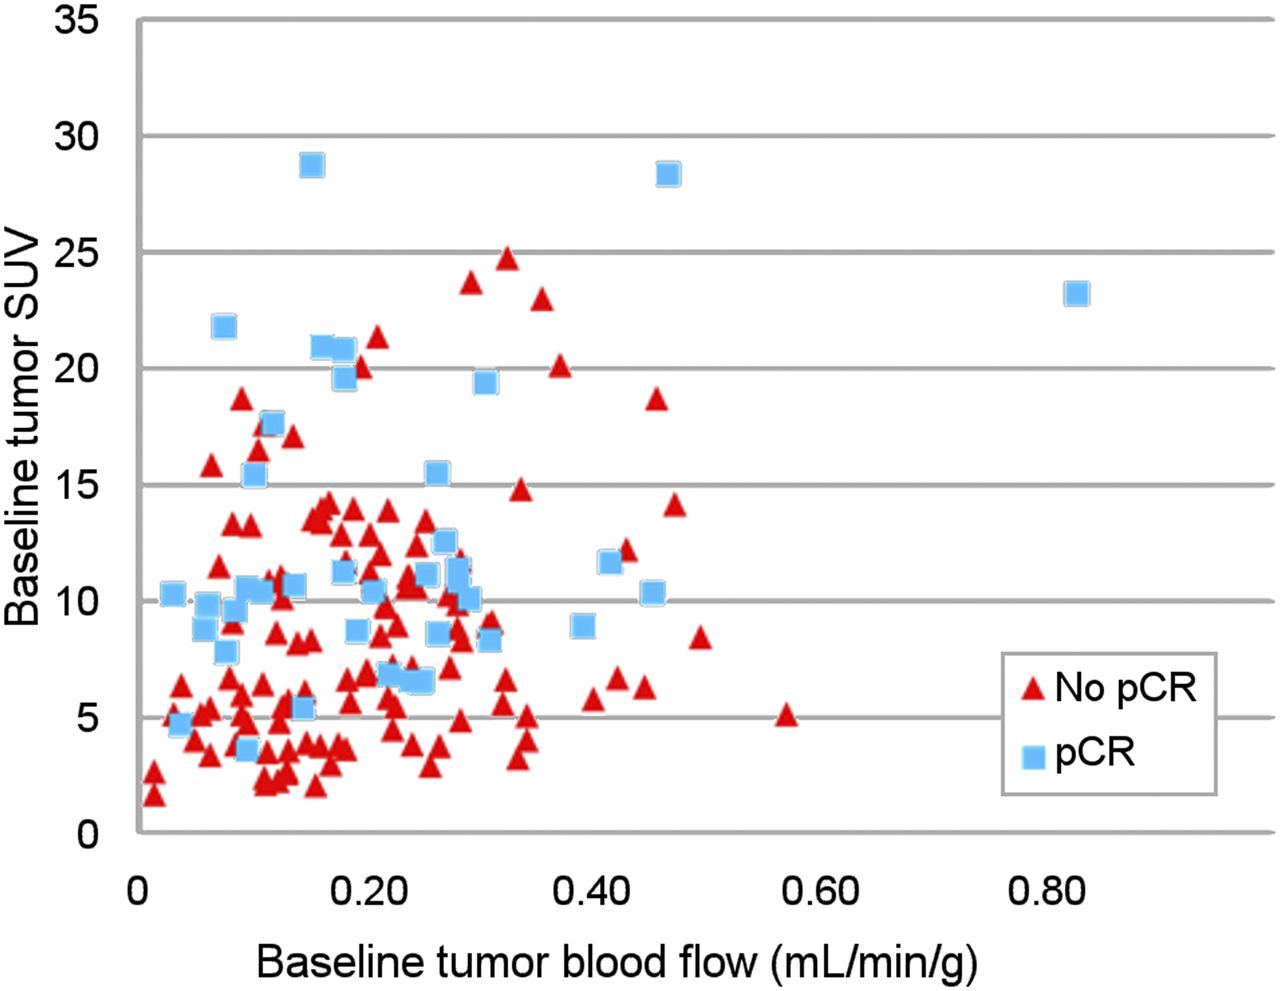
A weak correlation was found between SUV1max and BF1 (r = 0.22; P = 0.006) (Fig. 1). Mean SUV1max was 10.2 (SD, 5.9), but the significance of the difference depended on the tumor subtype, with the highest significance observed in the TNBC subtype (P < 1.10−4) (Table 2; Supplemental Fig. 1; supplemental materials are available at http://jnm.snmjournals.org). Mean BF1 was 0.21 mL⋅min−1⋅g1 (SD, 0.13 mL⋅min−1⋅g1) and did not differ among breast cancer subtypes (P = 0.61) (Table 2).

Correlation between BF1, SUV1, and pCR.
Tumor SUVmax and Tumor BF According to Breast Cancer Subtype
After multiple-comparisons correction (n = 10, P cutoff = 0.005), a high SUV1max was significantly associated with the biologic markers of tumor aggressiveness: a high tumor grade (Scarff–Bloom–Richardson 3, P < 0.001), a negative hormone receptor status (P < 0.001), and a high mitotic score (P < 0.001) (Table 3). In contrast, BF1 correlated with only body mass index (cutoff, 30): BF1 was 0.19 mL⋅min−1⋅g1 (SD, 0.12 mL⋅min−1⋅g1) in normal-weight women, versus 0.26 mL⋅min−1⋅g1 (SD = 0.12 mL⋅min−1⋅g1) in obese women (P = 0.002).
Correlation Between Tumor PET Imaging Parameters and Histologic–Biologic Characteristics of Breast Cancer
Response After First Cycle of NAC
Mean ΔSUVmax and ΔBF were −44.6% (SD, 27.4%) and −26.9% (SD, 54.3%), respectively. A moderate correlation was observed between ΔSUVmax and ΔBF (r = 0.52; P < 0.001) (Fig. 2). ΔSUVmax varied depending on Scarff–Bloom–Richardson grade, overexpression of human epidermal growth factor receptor 2 (HER2-positive), and lack of hormone receptor expression (P = 0.04, P < 0.001, and P = 0.01, respectively). But after multiple-comparisons correction, a higher ΔSUVmax and ΔBF were associated only with overexpression of HER2 (P < 0.001; Tables 2 and 3).

Correlation between early ΔBF, ΔSUVmax, and pCR.
Pooled-Subtype Analysis
In the pooled analysis (Supplemental Table 1; Fig. 3; Supplemental Fig. 2) concerning SUVmax, ΔSUVmax was the best parameter to predict pCR, showing good diagnostic accuracy on ROC curve analysis (AUC, 0.82; 95% CI, 0.74–0.89; P < 0.0001). The pCR rate of patients with ΔSUVmax under or over the median percentage was 45.3% (34/75) and 6.7% (5/75), respectively (P < 10−4). Concerning tumor BF, ΔBF was the best parameter to predict pCR but showed poor diagnostic accuracy on ROC curve analysis (AUC, 0.65; 95% CI, 0.55–0.74; P = 0.003). The pCR rate of patients with ΔBF under or over the median percentage was 32.0% (24/75) and 20.0% (15/75), respectively (P = 0.09). When ΔBF and ΔSUVmax were combined in ROC curve analysis, the predictive value was not improved over ΔSUVmax alone.

ROC curve analyses of best PET parameters for prediction of pCR, considering tumor subtype. CI95% = 95% confidence interval.
Per-Subtype Analysis
The per-subtype analysis (Supplemental Table 1; Fig. 3; Supplemental Fig. 2) showed that in triple-negative tumors, ΔSUVmax outperformed the other PET parameters in predicting pCR, with an AUC of 0.82 (95% CI, 0.68–0.95; P < 0.0001). SUV2max had a lower but still fair accuracy (AUC, 0.75; 95% CI, 0.59–0.91; P = 0.003). ΔBF and BF2 had worse accuracy (AUC, 0.66 and 0.68, respectively; P = 0.05 and 0.04, respectively). SUV1max, BF1, and the SUV1max/BF1 ratio failed to predict pCR (AUC < 0.60). The ROC curve analysis combining ΔBF and ΔSUVmax did not improve the AUC.
In patients with HER2-positive tumors, a high ΔSUVmax was predictive of pCR, with low accuracy (AUC, 0.66; P = 0.05). A low SUV2 had a low and insignificant accuracy (AUC, 0.65; P = 0.09). SUV1max, BF1, BF2, ΔBF, and the SUV1max/BF1 ratio failed to predict pCR (AUC < 0.60).
Among the 61 patients with luminal/HER2-negative cancer, only 3 achieved a pCR at the end of NAC. Despite this small number of pCRs, a high SUV1max and ΔSUVmax were both strong predictors of pCR, with excellent accuracies according to ROC curve analysis (AUC, 0.89 and 0.90, respectively; 95% CI = 0.73–1.00 and 0.69–1.00, respectively; P < 0.0001 for both). Only BF1 tended to predict pCR (AUC, 0.77; 95% CI, 0.49–1.00; P = 0.06); SUV2max, BF2, ΔBF, and the SUV1max/BF1 ratio did not. The ROC curve analysis combining ΔSUVmax and BF1 did not improve the AUC.
DISCUSSION
Functional imaging offers a unique opportunity to provide a noninvasive portrait of tumor biology. 18F-FDG PET identifies patterns of tumor glucose metabolism and tumor BF that depend on the biologic characteristics of the breast cancer and the response to treatment.
The team from Seattle has also simultaneously quantified BF and tumor glucose metabolism using both 15O-water PET and dynamic 18F-FDG PET (15,23–26). Our BF1 values (0.21 vs. 0.32 mL/min/g) and weak correlation between SUV1max and BF1 (r = 0.22 vs. 0.39) parallel their results (25).
As in previous reports, a high SUV1max correlated strongly with aggressive biologic characteristics, including the TNBC tumor subtype (20,27). In contrast, and in accord with the results of Dunnwald et al., we found no significant association between BF1 and the tumor phenotypic features and subtypes (23). BF1 was associated only with body mass index, with higher BF1 values being seen in obese women. Previous studies have underlined that obesity and adipose tissue dysfunction are linked to a proinflammatory and proangiogenic effect within the tumor microenvironment (28,29).
Specht et al. also demonstrated that an increased SUV1max/BF1 ratio is associated with the TNBC subtype (24). It was hypothesized that this ratio reflects hypoxia. Using dual 18F-FDG acquisitions, we also found that the SUV1max/BF1 ratio was higher in women with the TNBC subtype.
After the first cycle of treatment, most tumors quickly exhibited significant decreases in both SUVmax and BF. But the correlation between these changes was rather weak. These 2 functional pathways may thus provide different and complementary biologic information. Moreover, as in previous studies, huge differences in response were observed among breast cancer subtypes (7,20). HER2-positive tumors are highly chemosensitive to trastuzumab and show a drastic drop in both SUVmax and BF after the first cycle of treatment. Contrary to the well-known high metabolic response, which correlates with the final pCR (9), the drastic drop in BF after the first cycle of trastuzumab has never, to our knowledge, been reported. This is an interesting finding because trastuzumab has been demonstrated to have a strong antiangiogenic effect (30). TNBC has been reported to show a good metabolic response, whereas response in luminal/HER2-negative tumors is lower (20). The present study revealed that the mean decrease in BF is low in both subtypes (−22.5% ± 51.2% for TNBC and −2.7% ± 70.6% for luminal/HER2-negative) and varies considerably depending on the tumor, suggesting biologic heterogeneity. The increase in BF observed in some tumors after the start of chemotherapy is an important issue. It may provide a valuable indication of tumor aggressiveness and chemoresistance, because an adequate blood supply is crucial to sustain rapid growth and metastasis (31,32). In a recent alternative hypothesis, the increase in BF in response to antiangiogenic drugs or phosphatidylinositol-3 kinase inhibitors was suggested to be a marker of treatment efficacy due to transient normalization of the abnormal tumor vasculature (33).
The aim of monitoring tumor response early during NAC is to predict final pCR and outcomes. Supporting our results, numerous studies have demonstrated that 18F-FDG PET/CT accurately predicts the response to NAC in the HER2-positive and TNBC subtypes (7,8). Kinetic parameters linked to vascular permeability and perfusion have also been investigated in this setting, using different imaging modalities. For example, using sequential dynamic contrast-enhanced MRI, changes in pharmacodynamic parameters such as the AUC, the transfer constant, and the rate constant have been reported to be early predictors of a pCR to NAC (10–12,34). As another example, a 15O-water PET study found that the SUV1max/BF1 ratio correlated with the final pathologic response whereas BF1 did not (25). We found similar results using the dynamic 18F-FDG first-pass model (Supplemental Table 1). In other studies, women with persistent or elevated BF on interim PET experienced worse tumor responses and outcomes (15,26).
Nonetheless, few studies have directly compared the BF and metabolic responses in the neoadjuvant setting of breast cancer (35). Tateishi et al. performed 18F-FDG PET/CT and dynamic contrast-enhanced MRI at baseline and after 2 cycles of NAC, and PET/CT was more accurate in predicting a pCR (90.1% vs. 83.8% for ΔSUVmax and rate constant, respectively), but no per-subtype analyses were performed (35).
The main originality of the present study is that in a single 18F-FDG PET examination, we combined a short, dynamic first-pass PET acquisition with a standard delayed PET acquisition, thus allowing direct comparison of the ability of early metabolic changes and blood flow changes to predict histologic response. In the analysis pooling all tumor subtypes, ΔBF predicted pCR, but its diagnostic accuracy on ROC curve analysis was lower than that of ΔSUVmax (AUC, 0.65 vs. 0.82, respectively). In the per-subtype analysis, metabolic parameters systematically outperformed BF in predicting pCR.
One limit of the study is that we did not determine its test–retest performance.
A PET biomarker predictive of tumor response may allow for early tailoring of the NAC regimen to an individual patient. The AVATAXHER phase 2 randomized trial has assessed the benefit of adding bevacizumab in women with poorly-responding HER2-positive tumors after 2 cycles of trastuzumab/docetaxel (ΔSUVmax < 70%) (36). No PET-guided therapeutic strategy has been evaluated in the TNBC subtype. In women with TNBC, the addition of bevacizumab increases the pCR rate but is also associated with higher rates of toxicities (37). The role of antiangiogenic drugs in the neoadjuvant setting should be further evaluated but limited to patients most likely to benefit, such as women with no BF response to a conventional NAC regimen.
CONCLUSION
Baseline tumor glucose metabolism correlated with the biologic markers of tumor aggressiveness, whereas baseline tumor BF correlated only with patient weight. Of these two hallmarks of cancer, the reduction in glucose metabolism was much more accurate in predicting pCR in the different subtypes of breast cancer. Randomized studies are needed to evaluate the clinical benefits of PET-based assessments in the early stages of NAC for breast cancer.
DISCLOSURE
No potential conflict of interest relevant to this article was reported.
Acknowledgments
We thank Philip Bastable for proofreading the manuscript.
Footnotes
Published online Feb. 9, 2018.
- © 2018 by the Society of Nuclear Medicine and Molecular Imaging.
REFERENCES
- Received for publication September 29, 2017.
- Accepted for publication January 4, 2018.


Jump to section
Related Articles
Cited By...
- Semiquantification Limitations: FMTVDM(C)copysr Demonstrates Quantified Tumor Response to Treatment with Both Regional Blood Flow and Metabolic Changes
- Reply: Semiquantification Limitations: FMTVDM(C)copysr Demonstrates Quantified Tumor Response to Treatment with Both Regional Blood Flow and Metabolic Changes