


Abstract
Texture indices are of growing interest for tumor characterization in 18F-FDG PET. Yet, on the basis of results published in the literature so far, it is unclear which indices should be used, what they represent, and how they relate to conventional indices such as standardized uptake values (SUVs), metabolic volume (MV), and total lesion glycolysis (TLG). We investigated in detail 31 texture indices, 5 first-order statistics (histogram indices) derived from the gray-level histogram of the tumor region, and their relationship with SUV, MV, and TLG in 3 different tumor types. Methods: Three patient groups corresponding to 3 cancer types at baseline were studied independently: patients with metastatic colorectal cancer (72 lesions), non–small cell lung cancer (24 lesions), and breast cancer (54 lesions). Thirty-one texture indices were studied in addition to SUVs, MV, and TLG, and 5 indices extracted from histogram analysis were also investigated. The relationships between indices were studied as well as the robustness of the various texture indices with respect to the parameters involved in the calculation method (sampling schemes and tumor volume of interest). Results: Regardless of the patient group, many indices were highly correlated (Pearson correlation coefficient |r| ≥ 0.80), making it desirable to focus on only a few uncorrelated indices. Three histogram indices were highly correlated with SUVs (|r| ≥ 0.84). Four texture indices were highly correlated with MV, and none was highly correlated with SUVs (|r| ≤ 0.55). The resampling formula used to calculate texture indices had a substantial impact, and resampling using at least 32 discrete values should be used for texture indices calculation. The texture indices change as a function of the segmentation method was higher than that of peak and maximum SUVs but less than mean SUV for 5 texture indices and was larger than that of MV for 14 texture indices and for the 5 histogram indices. All these results were extremely consistent across the 3 tumor types and explained many of the observations reported in the literature so far. Conclusion: None of the histogram indices and only 17 of 31 texture indices were robust with respect to the tumor-segmentation method. An appropriate resampling formula with at least 32 gray levels should be used to avoid introducing a misleading relationship between texture indices and SUV. Some texture indices are highly correlated or strongly correlate with MV whatever the tumor type. Such correlation should be accounted for when interpreting the usefulness of texture indices for tumor characterization, which might call for systematic multivariate analyses.
PET using 18F-FDG currently plays a major role in cancer patient staging, management, and monitoring. Standardized uptake values (SUVs) are often reported to support diagnosis, assist prognosis, and serve as baseline values to later assess tumor response to therapy (1). The measurement of texture indices from tumor PET images has also been recently proposed as an adjunct to predict tumor response to therapy (2–6). Indeed, it is well known that tumors often present biologic heterogeneity corresponding to necrosis, fibrosis, regions with angiogenesis, high cellular proliferation, or the presence of specific receptors. Such biologic characteristics are of interest because they are often associated with lesion aggressiveness or lesion sensitivity to a specific therapy. Although PET images suffer from modest spatial resolution, it was hypothesized that the uptake distribution within the tumor could bring more insight into the tumor than the single SUV or tumor volume. On the basis of this assumption, several groups have studied 18F-FDG uptake heterogeneity in tumors by computing texture indices in baseline PET images for head and neck (2), cervical (2,7), esophageal (3,5,8), and lung cancers (4,6) as well as other cancer types (9). Yet, on the basis of the results published in the literature so far for 18F-FDG PET (Table 1), it is unclear which texture indices should be measured and how they actually related to the biologic tumor features (10). Indeed, Table 1 shows that many indices have been studied and that the methods used to calculate these texture indices were not always identical (resampling scheme in column 3 and tumor-segmentation method in column 4). In addition, the performance of different texture indices are difficult to compare between studies because the classification task was not always the same (Table 1) and some results do not appear consistent between studies. For instance, the tumor contrast was greater in nonresponding patients than in responding patients (5) whereas the opposite was observed in Cook et al. (6). Although different results could be due to different tumor types, there is still a need for eliminating other possible methodologic biases. Moreover, Galavis et al. (11) reported a lack of robustness for several texture indices as a function of the acquisition and reconstruction parameters. Some of the studies mentioned earlier (2–5,9) also investigated first-order statistics such as Kurtosis or SD calculated in the tumor region, with various results. For instance, in esophageal cancer Tixier et al. (3) showed that no index extracted from histogram analysis was a significant predictive factor of response to therapy whereas Tan et al. (5) found that skewness could differentiate responding from nonresponding tumors.
Published Results Regarding Performance of Textural Parameters to Characterize Tumors in 18F-FDG PET
In this context, the purpose of this study was to investigate a large number of texture indices on a variety of tumors to get a better insight into how they relate to one another and to conventional indices such as SUVs, metabolic volume (MV), and total lesion glycolysis (TLG) and to determine how robust they were with respect to the gray-level resampling scheme and formula and to the tumor delineation method. The objective was to identify the most relevant texture indices to be further studied; to describe their relationship with respect to SUV, MV, and TLG; and to determine whether results were consistent across tumor type. To that end, we independently analyzed 3 patient groups (colorectal, non–small cell lung, and breast cancers) for which we closely investigated 31 texture indices and 5 indices of first-order statistics in addition to SUVs, MV, and TLG.
MATERIALS AND METHODS
Patients
Three patient groups were studied, for a total of 188 lesions. The first cohort consisted of 28 patients with metastatic colorectal cancer (MCC) treated at the Jules Bordet Institute, Brussels, Belgium, and recruited as part of a prospective clinical trial to assess the clinical role of early 18F-FDG PET/CT scanning in chemotherapy-treated MCC. The study was approved by the ethics committee of the Institute Jules Bordet and registered at clinicaltrials.gov (number NCT00741481), and written informed consent was obtained from all patients. The other 2 cohorts consisted of 24 patients with non–small cell lung cancer (NSCLC) and 54 patients with breast cancer (BC) scanned at Avicenne Hospital, Bobigny, France. For these 2 patient cohorts, this study was approved by the local institutional review board (Ile-de-France X), and the requirement to obtain informed consent was waived. The characteristics of each cohort are summarized in Table 2.
Patient Characteristics
PET/CT Protocol
Each patient underwent an 18F-FDG PET/CT scan before the start of therapy.
The serum glucose level was less than 1.4 g/L at the time of injection for all patients.
For the patients with MCC, 18F-FDG PET/CT images were acquired using a Discovery LS System (GE Healthcare), 69 ± 7 min (range, 58–88) after injection of 18F-FDG (4 MBq/kg), with 4 min per bed position. PET images were reconstructed with the built-in GE Advance software using the ordered-subset expectation maximization algorithm, with 2 iterations and 28 subsets, and gaussian postfiltering (full width at half maximum [FWHM], 5.45 mm). The images were corrected for attenuation based on the CT and for scatter. The CT scan was obtained with a 4-slice multidetector helical scanner (Lightspeed; GE Healthcare). The tension was 120 kV, and the range of current was set from 30 to 200 mA (determined by the Auto-mA algorithm from GE Healthcare). The other parameters were 0.5 s per CT rotation, a pitch of 1.5, and a table speed of 15 mm/rotation. The reconstructed image voxel size was 0.98 × 0.98 × 5 mm for CT and 3.91 × 3.91 × 4.25 mm for PET.
For the patients with NSCLC or BC, all 18F-FDG PET/CT images were obtained using a Gemini TF PET/CT scanner (Philips), 76 ± 9 min (range, 56–94) after injection of 18F-FDG (3 MBq/kg), with 1.45 min per bed position. PET images were reconstructed using a BLOB-OS-TF (Blob–ordered-subsets–time-of-flight) list-mode iterative algorithm with 2 iterations and 33 subsets. Attenuation correction was performed using the CT. No postreconstruction smoothing was used. CT images were acquired using the following settings: 120 kV, 100 mA, pitch of 0.69, slice thickness of 3 mm, and increment of 1.5 mm. The reconstructed image voxel size was 1.17 × 1.17 × 1.5 mm for CT and 4 × 4 × 4 mm for PET.
For the 2 imaging systems, the spatial resolution of the images, derived from phantom acquisitions performed using the exact same acquisition and reconstruction protocols, was about 7 mm in FWHM.
All PET images were expressed in SUV units normalized by the patient body weight, using: Eq. 1where the tissue activity was decay-corrected to account for the time elapsed between injection and acquisition.
Tumor Segmentation
For each tumor, 2 MVs were estimated with 2 delineation methods often used in a clinical setting.
The first volume of interest (VOITAB) was estimated as described by Nestle et al. (12) where the threshold was defined by: Eq. 2with β = 0.3. The β parameter was optimized using 3 acquisitions of a Jaszczak phantom including spheres from 0.98 to 3.12 cm in diameter, with sphere to background activity ratios varying from 2.96 to 10 (13). I70 was the mean uptake in a contour containing all voxels with a value greater than 70% of the maximum uptake in the tumor. Ibgd was defined as the mean uptake in a shell of 2 voxels thickness located at 6 voxels from the region used to calculate I70, and only voxels with uptake less than 2.5 SUV units were included in the calculation of Ibgd.
The second delineation method was a fixed threshold set to 40% of the maximum SUV in the lesion and gave a tumor volume of interest (VOI) noted VOI40%.
A morphologic closing operation was implemented for each VOI (VOITAB and VOI40%) to include necrotic regions if there were any in the VOI. In 47 of 188 lesions, VOIs were manually adjusted to exclude neighboring nodes or metastases. Finally, only the 150 lesions of 188 that had a VOITAB greater than 5 mL (77 voxels for MCC or 78 voxels for NSCLC and BC) were included in the subsequent analysis, because textural measurements might not be relevant in small regions. This 5-mL value was chosen empirically (3) based on 2 observations: some texture parameters are based on series of neighboring voxel values in the x, y, or z directions, and series of less than 4 voxels would not make the calculations meaningful, calling for texture calculation in volumes of at least 4 × 4 × 4 = 64 voxels; and with the spatial resolution in our PET images being about 7 mm in FWHM, it was reasonable to calculate texture in volumes with dimensions of at least equal to 3 times the FWHM not to include texture due to partial-volume effect. Assuming spheric volumes, this yields to volumes of about 5 mL.
Tumor Characterization
In each VOITAB and VOI40%, 41 indices were measured, namely SUVmax, SUVmean, and SUVpeak (defined below); MV; TLG; 5 first-order statistics based on histogram analysis; and 31 texture indices.
SUVmax was defined as the maximum uptake in the segmented tumor. SUVmean was measured as the average uptake in the tumor VOI. SUVpeak was computed as the maximum average SUV in a cube of 3 × 3 × 3 voxels included in the tumor for each possible location of this cube in the VOI. MV was the volume of the VOI. TLG was calculated as the product of SUVmean by MV.
On the basis of first-order statistics, 5 histogram indices were computed: SD (SDHist), skewness, kurtosis, EntropyHist, and EnergyHist.
To calculate texture indices, the VOI content was first resampled in D discrete values using: Eq. 3where I(x) is the SUV of voxel x in the original image; SUVmin and SUVmax are the minimum and maximum SUV in the VOI, respectively; R(x) is the resampled value of voxel x; and D is the number of resampled values. After resampling with 64 discrete values (D = 64 in Eq. 3), 4 matrices were computed from each VOI: the cooccurrence matrix (CM) (14), the gray-level run length matrix (GLRLM) (15), the neighborhood gray-level different matrix (NGLDM) (16), and the gray-level zone length matrix (GLZLM) (17). The GLRLM was calculated from 13 different directions in space. The CM was calculated from the same 13 different directions with a 1-voxel distance relationship between consecutive voxels. The index value was the average of the index over the 13 directions in space. For the NGLDM, only the 26 nearest neighbors in 3 dimensions were considered. Thirty-one texture indices were calculated from these matrices (Table 3).
List of Indices Calculated from Texture Matrices
The definitions of all indices are given in Supplemental Table 1 (supplemental materials are available at http://jnm.snmjournals.org).
Correlation Analysis
To characterize the relationships between the different indices, we analyzed the linear correlation between each pair of indices, computed with 64 discrete values (Eq. 3) from VOITAB and characterized it by the Pearson correlation coefficient (denoted r thereafter), considering each patient group separately. On the basis of these correlation analyses, we grouped indices so that all pairs of indices in a group had an |r| greater than 0.80 in at least 2 patient sets (to reduce false-positive findings). The mean |r| over index pairs and associated SD were calculated for each group of highly correlated indices. Despite the large number of correlation values that were calculated, no compensation for multiple comparison was performed as we did not perform any statistical test on the r values (18).
Impact of Gray-Level Resampling Scheme to Calculate Texture Indices
To determine whether texture indices depended on the resampling step, we calculated each texture index using 4 additional sampling schemes (D = 8, 16, 32, and 128 in Eq. 3) of the VOITAB voxels. We analyzed the Pearson correlation coefficient r with results obtained with D = 64 for each patient set independently.
We also studied the impact of the formula used for resampling using Equation 4 previously reported (3,7) instead of Equation 3: Eq. 4Texture indices were calculated with Equations 3 and 4 for D = 64 discrete values in VOITAB. For each texture index, we calculated the Pearson correlation coefficient for the index obtained with these 2 resampling equations. We also calculated r between the index computed with Equation 4 and SUVmax.
Change of Textural Index as Function of Segmentation Method
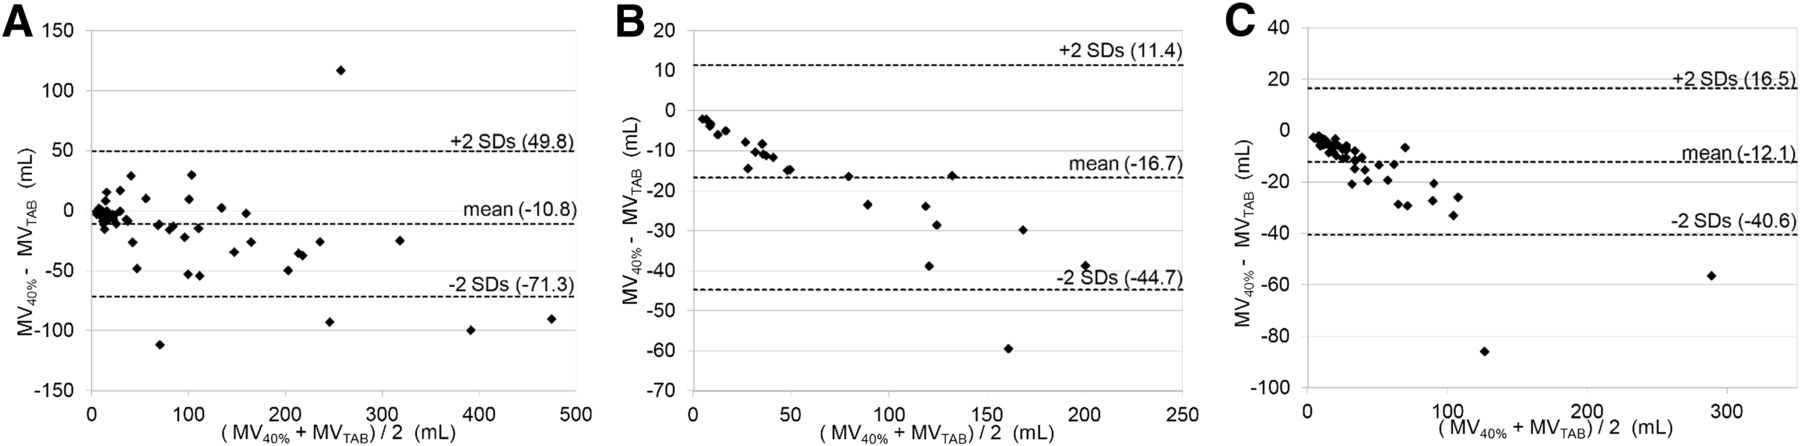
To study the impact of the segmentation method on the tumor volume estimate, we first plotted the Bland–Altman graph to compare MVTAB (metabolic volume in VOITAB) and MV40% (metabolic volume in VOI40%) for the 3 sets of tumors separately (MCC, NSCLC, BC). For each tumor set, the variation of each index as a function of the tumor-segmentation method was assessed by calculating the relative difference δ between the index measured from VOITAB and the index measured from VOI40% for each lesion using: Eq. 5D = 64 (Eq. 3) was used for all texture indices calculations. The SD of δ (sdδ) of these differences over all lesions from each tumor set was calculated to characterize the sensitivity of the value to the segmented volume.
RESULTS
Correlation Between Different Indices
Because we started from 41 indices, (41 × 40)/2 = 820 Pearson correlation coefficients were calculated for each of the 3 patient cohorts. One hundred sixty-six were greater than 0.80 for at least 2 patient sets, and 110 were greater than 0.80 for all 3 patient sets, demonstrating a strong correlation between indices. When the indices presenting a correlation greater than 0.80 in at least 2 patient sets were grouped together, 9 groups were identified (Table 4). Table 4 also shows the mean absolute correlation between the indices for each patient set separately. Busyness and long-zone low gray-level emphasis (LZLGE) did not belong to any group of highly correlated indices and constituted 2 additional groups, yielding a total of 11 groups.
Groups of Correlated Indices with Mean Absolute Correlation per Group and Associated SD for 3 Tumor Types
Table 5 summarizes the correlation between all texture indices, histogram indices, and MV. No histogram index was correlated with MV, whereas the r correlation coefficient between SUVmax and SDHist, EnergyHist, and EntropyHist was higher than 0.84. The correlation of texture indices with SUVmax was always less than 0.46, except for long-zone high gray-level emphasis (LZHGE), where it was 0.55 for the NSCLC patient set. The r correlation coefficient of MV with SUVmax was 0.31, 0.41, and 0.02 for the MCC, NSCLC, and BC patient sets, respectively.
Correlation Between Indices and MVTAB for 3 Patient Groups
Impact of Resampling Step
For each index and each patient set, the calculation of the r Pearson correlation between texture indices calculated with D ≠64 and D = 64 (8 vs. 64, 16 vs. 64, 32 vs. 64, 128 vs. 64), denoted rD-D hereafter, shows the following. First, 9 of 31 texture indices (homogeneity, correlation, the 2 contrasts, dissimilarity, coarseness, high gray-level run emphasis [HGRE], gray-level nonuniformity for run [GLNUr], and run length nonuniformity [RLNU]) yielded an rD-D higher than 0.95 for all patient sets and all comparisons, suggesting that these indices are robust with respect to the number of gray levels used for resampling. Second, 2 indices (busyness and LZLGE) strongly depended on that number, with rD-D between −0.05 and 1. Third, when using at least 32 discrete values for resampling, rD-D was always higher than 0.80 for all indices except busyness (rD-D between −0.05 and 0.13), LZLGE (rD-D between 0.37 and 1), and LZHGE (rD-D between 0.73 and 0.95).
Nineteen of 31 indices were little influenced by the formula used to resample the VOI content (req4_eq3 ≥ 0.95). Ten of 31 texture indices were moderately affected (0.80 ≤ req4_eq3 < 0.95), but busyness and short-zone high gray-level emphasis (SZHGE) were strongly modified (req4_eq3 < 0.80). When Equation 4 was used, the Pearson correlation coefficients ranged from 0.35 to 0.67 between texture indices from group 6 and SUVmax, whereas they ranged between 0.02 and 0.32 for texture indices computed with Equation 3. This suggests that using Equation 4 instead of Equation 3 introduces a spurious correlation between the texture indices of group 6 and SUVmax.
Change in Index Values as Function of Segmentation Method
The Bland–Altman plots comparing MVTAB and MV40% for the 3 tumor sets (Fig.1) demonstrate that there were substantial differences between the 2 volumes and that the larger the volume the higher the difference in MV as a function of the segmentation method.

Bland–Altman plots comparing MVs obtained with 2 segmentation methods (MVTAB and MV40%) for MCC (A), NSCLC (B), and BC (C).
The sdδ calculated for each index and each tumor set is listed in Table 6. No texture or histogram indices had an sdδ less than those of SUVmax or SUVpeak, suggesting that all texture and histogram indices depend more on the tumor-segmentation method than SUVmax and SUVpeak. Only 5 texture indices sdδ (entropy, short-run emphasis [SRE], long-run emphasis [LRE], run percentage, short-zone emphasis) were lower than that of SUVmean in the 3 tumor sets. Twelve indices had an sdδ between the sdδ of SUVmean and sdδ of MV, whereas the remaining 14 texture indices and 5 histogram indices had an sdδ higher than that of MV, showing that these 19 indices were highly dependent on the segmented volume.
sdδ (by Cohort) and Change of Each Index as Function of Segmentation Method
DISCUSSION
Our primary objective was to clarify the relationship between texture indices with conventional indices such as SUVs and MV. Indeed, as shown in Table 1, although textural indices are being reported as potentially useful in recent publications, the consistency of published results is currently difficult to assess for several reasons.
First, the same name given to a texture index does not always correspond to the same definition (10). For instance, homogeneity is not defined identically in Tixier et al. ((3); Eq. 3) and in other articles ((2); Eq. 4 (4,19)). We found in our patients that the 2 indices were highly correlated (r > 0.99 regardless of the patient set). Similarly, zone length nonuniformity (ZLNU) and gray-level nonuniformity for zone do not obey the same definition in Tixier et al. (3,20). In our work, we chose the definitions of Xu et al. (15). In addition, indices corresponding to the same definition are not always given the same acronym. For instance, the SZHGE index we studied (15) is sometimes called Szonehigl (19), high-intensity short-zone emphasis (3), or high-intensity small-area emphasis (20). Last, in certain publications, indices are not defined.
Second, the performances of texture indices are not always compared with the performances of MV, SUVs, and TLG, making it difficult to determine the added value of texture indices, compared with conventional indices. For instance, in Tixier et al. (3), it is concluded that texture indices measured in the pretreatment scan are highly predictive of the therapeutic response in esophageal cancer, but results of MV are not provided, whereas in Hatt et al. (21), in a similar cohort of patients, MV was reported to be highly predictive of the therapeutic response. It is thus unclear which of MVs or texture indices are most useful in these patients. Similarly, in Dong et al. (8), the correlation of SUVmax, energy, and entropy with the TNM classification was reported, but MV was not investigated. Because TNM classification is often highly predictive of outcome, the performance of texture indices, compared with TNM classification, should also be reported and analyzed using multivariate approaches.
Another confounding factor relates to the volume in which texture indices are calculated given that there is currently no ideal method to delineate the tumor. Different groups use different approaches, and differences in texture indices results might come from a different delineation method. Also, the relevance of texture indices has been investigated with respect to several tasks (Table 1, last column), making it complicated to draw generic conclusions regarding how texture indices should be measured and when. This is all the more true that there are disagreements between results by different groups. For instance, in posttreatment scans, the tumor contrast was greater in nonresponding patients than in responding patients in esophageal cancer treated by neoadjuvant chemoradiation (5), whereas it was smaller in NSCLC treated by chemotherapy (6) in pretreatment scans (Table 1). If these differences might be due to the different tumor types investigated in these studies or different scanning protocols, it is still useful to determine whether these are the only possible explanations.
Moreover, there is often confusion between texture indices and indices extracted from the histogram of voxel values in the tumor region of interest. The latter indices are based on first-order statistics and do not reflect the spatial arrangement of voxels. Therefore, they do not describe the texture, as already underlined in Asselin et al. (22).
We therefore performed a comprehensive analysis of textural and classic indices of different tumor types, to better understand how they relate to indices that are currently used, in terms of information that they convey and robustness. We deliberately investigated independently 3 tumor sets, corresponding to different tumors and acquisition/reconstruction protocols, to analyze the consistency of our results across a variety of tumor images and only draw conclusions when our results were almost identical for all images.
Correlation Between Indices
Many texture indices have been described in the literature (14–17), without clear indication on which should be used (Table 1). We studied the correlation between the different texture indices themselves and between texture indices and conventional indices, aiming at identifying the indices that actually capture different pieces of information. As a first approximation, we considered linear correlation only and sorted indices so as to group together all indices being highly correlated (Table 4). Table 4 suggests that there is no added value in calculating several indices belonging to the same group, because they describe highly correlated information. Indices from different groups can still be significantly correlated because the cutoff value of 0.80 that we used is arbitrary.
Our results suggest that the correlation is not dependent on the tumor types we studied (Table 4, last 3 columns have similar r for all groups except for groups 4 and 5). In groups 4 and 5, index values highly depended on the segmentation method (Table 6), which might explain the reduced correlation. In addition, we did not observe any systematic difference in trends for the NSCLC and BC tumors against the MCC tumors, although the MCCs were acquired on a different scanner using acquisition and reconstruction protocols unlike the ones used for the NSCLC and BC tumors. This suggests that the correlation between indices does not depend much on the tumor type we studied or on the acquisition/reconstruction protocols: the correlation is rather inherent to the definition of the indices.
SDHist, EntropyHist, and EnergyHist were highly correlated with SUV measurements on all patient sets, consistent with previous results (5,3). This correlation explains the results previously published (2) in which SUVs and SDHist led to similar performance in predicting outcomes in cervical cancers (area under the receiver operating characteristics curves [AUC] of 0.46 and 0.53, respectively) and head and neck cancers (AUC between 0.60 and 0.70 for SUVs and 0.68 for SDHist). In contrast, none of the texture indices was strongly correlated with SUVmax, which is consistent with previous findings (8,23). Yet, Table 5 demonstrates that most texture indices (except those of group 6) are significantly correlated with MV: big lesions exhibit more texture than small lesions. It is thus challenging to untangle the added value of texture parameters, compared with MV, for tumor characterization. This problem is exemplified by the results previously reported (3,21) for patients with esophageal cancer. Gray-level nonuniformity for zone (called intensity-variability) and ZLNU (size-zone variability), which we found highly correlated with MV whatever the patient set (Table 5, |r| > 0.92), were shown to predict tumor response (3), but MV results were not given. In Hatt et al. (21), however, MV was demonstrated as predictive of tumor response in a similar group of patients by the same authors without referring to texture indices analysis. A systematic joint evaluation of textural parameters and MV is thus compulsory to clarify the role of each in characterizing tumors.
Run indices calculated from the GLRLM matrix are highly correlated with zone indices calculated from GLZLM (groups 3, 4, 5, 6, and 7 in Table 4), as suggested in Tixier et al. (3).
Contrast defined as CM and contrast defined as NGLDM, dissimilarity, and homogeneity were highly correlated (|r| > 0.7, all in our group 1), similar to what was already observed for 18F-fluorothymidine PET in breast cancer patients (19). In 18F-FDG PET, dissimilarity and homogeneity have also been reported to be highly anticorrelated in esophageal tumors (r = −0.93) (23).
In El Naqa et al. (2), energy and entropy yielded similar performance to classify therapeutic response in patients (AUC of 0.50 and 0.53 in head and neck cancer patients, 0.72 and 0.65 in cervical cancer patients), which we can explain by the high anticorrelation between these 2 texture indices (r = −0.92, both in group 2). In addition, in El Naqa et al. (2), contrast and homogeneity also led to similar classification performance (AUC of 0.80 and 0.82, respectively, in head and neck cancer patients, 0.60 and 0.62 in cervical cancer patients), which we can explain by the high correlation between these 2 indices (both in group 1).
In Vaidya et al. (4), the Spearman rank correlation coefficients (rs) between energy and tumor locoregional failure (|rs| = 0.06) was close to that between entropy and tumor locoregional failure (|rs| = 0.02). On the basis of our results, the reason is that energy and entropy are highly correlated (both belong to group 2). In that same work, rs between contrast and tumor locoregional failure (|rs | = 0.10) was almost identical to rs between homogeneity and tumor locoregional failure (|rs| = 0.11), again in line with Table 4, where contrast and homogeneity both belong to group 1.
The similar performance of contrast and correlation for predicting the pathologic response to neoadjuvant chemoradiation therapy (AUC of 0.85 and 0.80, respectively) reported before (5) can also be explained by the fact that these 2 indices belong to group 1. Likewise, in Dong et al. (8), entropy and energy were highly predictive of the TN staging, because these 2 indices are highly correlated (both belong to group 2, Table 4).
Resampling Step
The gray-level sampling is essential to make texture indices independent of the signal intensity. Yet, many authors do not precisely describe this step (Table 1, column 3). We showed that the number of gray levels substantially affects the texture indices values, especially when less than 32 discrete values are used (e.g., entropy, SZHGE or ZLNU). In addition, using Equation 4 as in Tixier et al. and Yang et al. (3,7) makes the texture indices of group 6 dependent on the SUVmax, because of the +1 in the denominator of Equation 4. This explains the results presented previously (7) in which Equation 4 was used, and where 6 texture indices (HGRE, short-run high gray-level emphasis, long-run high gray-level emphasis, high gray-level zone emphasis, SZHGE, and LZHGE), SUVmax, and SUVmean were all correlated with tumor changes in the complete metabolic response group. The resampling approach (formula and number of gray level) should thus always be specified, and Equation 3 should be used instead of Equation 4, to reduce the correlation between texture indices and SUV. It should be underlined that the strong correlation between values of the same index for different levels of discretization never implied interchangeability, as demonstrated by Bland–Altman analysis (results not shown). The absolute values of the texture indices significantly change with the resampling scheme and can therefore only be interpreted if the resampling step is precisely described.
Index Robustness
There is currently no single widely accepted tumor-segmentation method (24). For the same tumor, it is therefore essential to study the sensitivity of any texture indices to the VOI in which it is calculated. To that end, we considered 2 segmentation methods frequently used in the clinics, which yielded consistent tumor volumes (i.e., no aberrant segmentation, Fig. 1) with substantial differences. The results suggest that all histogram indices depended more on the segmentation method than MV. For SDHist and skewness, poor reproducibility was already reported with test–retest analysis (20). The change in texture indices for these 2 segmentation methods showed that some were highly sensitive to the segmentation method, especially low gray-level run emphasis, short-run low gray-level emphasis, long-run low gray-level emphasis, low gray-level zone emphasis, and short-zone low gray-level emphasis in group 5, whereas others, such as homogeneity and entropy, were robust. Our results are consistent with those published previously (20,23) but provide, with indications regarding texture indices robustness, for a much larger number of texture indices. Contrast and busyness were highly sensitive to the segmentation method (Table 6) and were also reported as being highly dependent on the acquisition mode and reconstruction parameters (11). In Tixier et al. (3), these 2 parameters failed to predict tumor response in esophageal cancer whereas they predicted the tumor response in NSCLC lesions (6) when lesions were delineated manually. The different performances in 2 different settings are in line with the poor robustness of these indices. Similar to the correlation results, the robustness of texture indices with respect to the delineation method did not depend much on the tumor type we studied or on the acquisition and reconstruction protocols (Table 6).
Variability should not be the only criterion for selecting indices (25). Combining correlation and robustness results (Tables 4 and 6) show that all texture indices from group 5, gray-level nonuniformity for run, busyness, LZLGE, and histogram indices are not robust with respect to the segmentation method. Texture indices such as homogeneity, entropy, SRE, or ZLNU could certainly be more carefully studied to clarify the role they might play for tumor or tumor response characterization. These texture indices are not highly correlated, hence they describe different tumor features, and they appeared to be robust enough with respect to the tumor delineation method. Yet, to determine the added value of these indices with respect to conventional indices, their performance (including repeatability) should be systematically compared with those of MV, SUVmax, SUVpeak, or SUVmean in different types of lesion. In addition, a careful investigation of the relationship between these texture indices values and actual tumor features as measured ex vivo is essential to understand the bearing of these texture indices.
CONCLUSION
We analyzed a large range of texture and histogram indices in several tumor types. We demonstrated the need for a proper resampling strategy for calculating texture indices, and we also showed that several texture indices brought similar information. Some texture indices were highly correlated with MV. All histogram indices strongly depended on the tumor delineation method, whereas some of the texture indices were robust with respect to tumor segmentation. Our findings were consistent across 3 tumor types and 2 acquisition/reconstruction protocols. We demonstrated that our results explained many of the results published on texture indices for tumor characterization so far. Further investigations, including systematic comparison with conventional indices and multivariate analyses, are absolutely needed to clarify the value of texture indices, compared with SUVs, MV, and TLG, for tumor characterization and tumor response prediction.
DISCLOSURE
The costs of publication of this article were defrayed in part by the payment of page charges. Therefore, and solely to indicate this fact, this article is hereby marked “advertisement” in accordance with 18 USC section 1734. No potential conflict of interest relevant to this article was reported.
Footnotes
Published online Feb. 17, 2014.
- © 2014 by the Society of Nuclear Medicine and Molecular Imaging, Inc.
REFERENCES
- Received for publication July 25, 2013.
- Accepted for publication October 3, 2013.


Jump to section
Related Articles
Cited By...
- ROBI: a Robust and Optimized Biomarker Identifier to increase the likelihood of discovering relevant radiomic features
- Promising Candidate Prognostic Biomarkers in [18F]FDG PET Images: Evaluation in Independent Cohorts of Non-Small Cell Lung Cancer Patients
- An 18F-FDG PET/CT and Mean Lung Dose Model to Predict Early Radiation Pneumonitis in Stage III Non-Small Cell Lung Cancer Patients Treated with Chemoradiation and Immunotherapy
- Effects of Tracer Uptake Time in Non-Small Cell Lung Cancer 18F-FDG PET Radiomics
- Quantitative Radiomics Features in Diffuse Large B-Cell Lymphoma: Does Segmentation Method Matter?
- Additional value of volumetric and texture analysis on FDG PET assessment in paediatric Hodgkin lymphoma: an Italian multicentric study protocol
- Texture Feature Comparison Between Step-and-Shoot and Continuous-Bed-Motion 18F-FDG PET
- Radiomics Analysis of Clinical Myocardial Perfusion Stress SPECT Images to Identify Coronary Artery Calcification
- Radiomics Features of 18F-fluorodeoxyglucose Positron-Emission Tomography as a Novel Prognostic Signature in Colorectal Cancer
- The Dark Side of Radiomics: On the Paramount Importance of Publishing Negative Results
- Metabolic Biomarker-Based BRAFV600 Mutation Association and Prediction in Melanoma
- Pretreatment 18F-FDG Uptake Heterogeneity Predicts Treatment Outcome of First-Line Chemotherapy in Patients with Metastatic Triple-Negative Breast Cancer
- A Postreconstruction Harmonization Method for Multicenter Radiomic Studies in PET
- Computational Radiomics System to Decode the Radiographic Phenotype
- Understanding Changes in Tumor Texture Indices in PET: A Comparison Between Visual Assessment and Index Values in Simulated and Patient Data
- Multiscale Texture Analysis: From 18F-FDG PET Images to Histologic Images
- Pretreatment 18F-FDG PET Textural Features in Locally Advanced Non-Small Cell Lung Cancer: Secondary Analysis of ACRIN 6668/RTOG 0235
- 18F-FDG PET/CT of Non-Small Cell Lung Carcinoma Under Neoadjuvant Chemotherapy: Background-Based Adaptive-Volume Metrics Outperform TLG and MTV in Predicting Histopathologic Response
- Primary tumour standardised uptake value is prognostic in nonsmall cell lung cancer: a multivariate pooled analysis of individual data
- Tumor Texture Analysis in PET: Where Do We Stand?
- Impact of Image Reconstruction Settings on Texture Features in 18F-FDG PET
- 18F-FDG PET Uptake Characterization Through Texture Analysis: Investigating the Complementary Nature of Heterogeneity and Functional Tumor Volume in a Multi-Cancer Site Patient Cohort