


Abstract
Characterizing tumor heterogeneity using texture indices derived from PET images has shown promise in predicting treatment response and patient survival in some types of cancer. Yet, the relationship between PET-derived texture indices, precise tracer distribution, and biologic heterogeneity needs to be clarified. We investigated this relationship using PET images, autoradiographic images, and histologic images. Methods: Three mice bearing orthotopically implanted mammary tumors derived from transgenic MMTV-PyMT mice were scanned with 18F-FDG PET/CT. The tumors were then sliced, and the slices were imaged with autoradiography and stained with hematoxylin and eosin. Six texture indices derived from the PET images, autoradiographic images, and histologic images were compared for their ability to capture heterogeneity on different scales. Results: The PET-derived indices correlated significantly with the autoradiography-derived ones (R = 0.57–0.85), but the values differed in magnitude. The histology-derived indices correlated poorly with the autoradiography- and PET-derived ones (R = 0.06–0.54). All indices were slightly to moderately influenced by the difference in voxel size and spatial resolution in the autoradiographic images. The autoradiography-derived indices differed significantly (P < 0.05) between regions with a high density of cells and regions with a low density and between regions with different spatial arrangements of cells. Conclusion: Heterogeneity derived in vivo from PET images accurately reflects the heterogeneity of tracer uptake derived ex vivo from autoradiographic images. Various tumor-cell densities and spatial cell distributions seen on histologic images can be distinguished using texture indices derived from autoradiographic images despite the difference in voxel size and spatial resolution. Yet, tumor texture derived from PET images only coarsely reflects the spatial distribution and density of tumor cells.
A current challenge in oncology is to offer each patient a personalized treatment that accounts, at best, for the characteristics of the tumor or tumors. To achieve this goal, the specific histologic or genetic features of the tumor, including intratumoral heterogeneity, have to be determined before therapy is prescribed (1). This determination is usually based only on biopsy analysis, yet one study (2) reported that 63%–69% of all mutations were not detectable within a single tumor sample. Indeed, intratumoral heterogeneity reflects different mutations in cell subpopulations distributed in different regions of the tumor, some of which may be far from the biopsy site. PET provides molecular information about the whole tumor and may therefore be a relevant option to complete the characterization of the tumor. Indeed, PET imaging is noninvasive, can be repeated during the course of therapy, and allows for a comprehensive assessment of each tumor site. Using different tracers, PET can even yield information on the glucose metabolism of cells (18F-FDG), tumor hypoxia (18F-fluoroazomycin arabinoside, 18F-fluoromisonidazole), and tumor cell proliferation (3′-deoxy-3′-18F-fluorothymidine) (3). Recently, several studies have used tumor texture analysis of PET images to characterize intratumoral heterogeneity. Most of the studies assessed the ability of texture indices to predict outcome in patients with cancer, and some found a relationship between these indices and such characteristics as tumor stage in esophageal cancer (4) and tumor grade in glioma (5). Gao et al. (6) showed that a combination of texture indices derived from PET and CT images before treatment could contribute to the assessment of node stage. In the context of developing a computer-aided diagnosis system, Lartizien et al. (7) demonstrated that use of the 12 most discriminating PET and CT features made it possible to distinguish between hypermetabolic cancer lesions and hypermetabolic inflammatory or physiologic regions in lymphoma patients, with an area under the receiver operating characteristic curve of 0.91. To separate malignant from benign bone and soft-tissue lesions, Xu et al. (8) used a combination of 4 texture indices derived from PET images (entropy and coarseness) and CT images (entropy and correlation) to improve lesion classification over that from SUV only. In breast cancer, the combination of a high gray-level-run emphasis and SUVmax identified triple-negative lesions (9) with a sensitivity of 77% and a specificity of 71%. Despite these encouraging results, the biologic interpretation of PET-derived texture indices and whether they reflect microscopic intratumoral heterogeneity have not, to our knowledge, been investigated.
The purpose of this study was to investigate the relationship between texture indices derived from 18F-FDG PET images, autoradiographic images, and histologic images in order to determine whether indices measured on a PET scale (mm) are representative of features seen on a microscopic scale (autoradiographic images) and on a cellular level (histologic images).
MATERIALS AND METHODS
Animal Models
All animal procedures were approved by the ethics committee in charge of animal experimentation (CETEA DSV no. 44, reference no. 12-036) and were performed in accordance with European guidelines on handling laboratory animals.
Three mice bearing orthotopically implanted mammary tumors derived from transgenic MMTV-PyMT mice were used. The tumor donors were FVB/N-Tg (MMTV-PyMT) 634Mul/J (PyMT) 12-wk-old mice. Aseptically collected mammary tumors from PyMT mice were minced and immersed in cold Dulbecco modified Eagle medium (Sigma). The cells were mechanically dissociated using Medicon disposable chambers (BD Biosciences). The cell suspension was then progressively passed through Filcon filters with pore sizes of 500, 200, and 70 μm (BD Biosciences). Finally, the cells were aliquoted in freezing medium (Life Technologies) and stored in liquid nitrogen. After removal of the freezing medium and enumeration, the tumor cells were directly inoculated, without any in vitro culturing step, in the mammary fat pad of the posterior nipple in FVB mice.
PET/CT Imaging Protocol
At 30–36 d after implantation of the tumors, the animals were kept fasting for 12 h before undergoing PET/CT, for which they were anesthetized using 2% isoflurane. Imaging was performed using a dedicated small-animal Inveon PET/CT scanner (Siemens). Each mouse was injected with 7.9 ± 0.3 MBq of 18F-FDG, and the acquisition started 65 ± 5 min after this injection and lasted for 30 min (two 15-min acquisitions). The energy window was set from 350 to 650 keV. PET images were reconstructed using 2-dimensional ordered-subset expectation maximization with 4 iterations and 16 subsets. Scatter was corrected using the direct calculation from analytic formulas (10), and attenuation correction was based on the CT images. No postfiltering was applied. The matrix size was 256 × 256 × 159 voxels, corresponding to a PET voxel size of 388 × 388 × 796 μm. The PET volume of interest (VOI-PET) was converted to SUV units normalized by mouse body weight (Fig. 1).
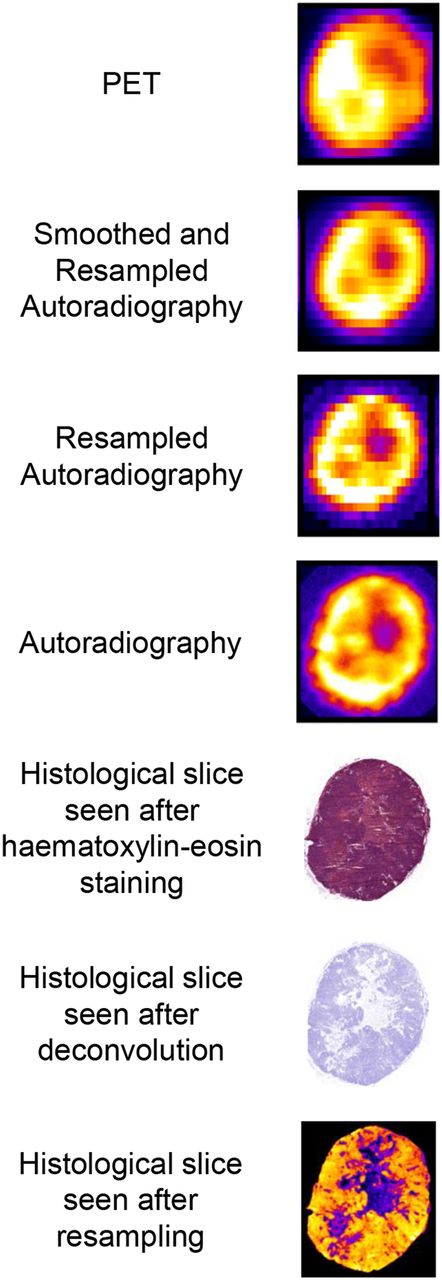
Example of tumor slice as seen with different modalities.
Tumor Tissue Sectioning
After the PET/CT acquisitions, the animals were sacrificed and the tumors removed using landmarks for tumor orientation to facilitate registration of autoradiographic images and histologic images with PET images. A cryostat (Leica) was used to slice 20-μm-thick transaxial sections from the frozen tumor. Sections were obtained at 100-μm intervals. Each section was placed on a glass slide. The first tumor yielded 116 slices, whereas the other two yielded 102 slices each.
Autoradiography Imaging Protocol
The tumor sections were exposed to imaging plates for 15 h, which were then scanned using a Storm scanner (GE Healthcare). The voxel size of the autoradiographic images was 50 × 50 × 20 μm (Fig. 1).
Histochemistry
To investigate the biologic meaning of texture indices, we assumed that 18F-FDG uptake would correlate with cellular density in tumors. The slices were thus analyzed using hematoxylin and eosin staining. Hematoxylin stains nuclei blue-purple and cytoplasm and extracellular matrix pink (Fig. 1). To separate the hematoxylin component, we used the color deconvolution function (11) of ImageJ software. The resulting images were resampled to match the autoradiography voxel size (50 × 50 × 20 μm) using the TransformJScale function (12) of ImageJ, yielding resampled “hematoxylin” images called histologic images thereafter (Fig. 1). From these images, a histologic volume of interest (VOI-H) was segmented manually to separate the tumor from the background.
Creation and Registration of 3-Dimensional Volumes
For each tumor, a 3-dimensional autoradiography volume was created from the autoradiography slices using the StrackReg function (13) of ImageJ. The 80-μm interval between slices was filled using a cubic-β spline interpolation (TransformJScale) hypothesizing that morphologic changes over this short distance were negligible. Three 3-dimensional autoradiography volumes were created (Fig. 1): the original autoradiography volume (50 × 50 × 20 μm voxels), called VOI-AR; VOI-AR resampled to the PET voxel size using TransformJScale (388 × 388 × 796 μm voxels), called VOI-RAR; and VOI-RAR smoothed with a gaussian filter (SD = 677 μm) to match the PET image spatial resolution, called VOI-SRAR. The PET tumor volume was also registered to VOI-SRAR using the Optimized Automatic Image Registration function of the Medical Image Processing Analysis and Visualization software (14). This registration approach determines the transformation (12 degrees of freedom) that minimizes the correlation ratio function and involves a trilinear interpolation.
VOI-PET, VOI-AR, VOI-RAR, and VOI-SRAR were segmented using a threshold equal to 40% of the maximum voxel intensity in the volume.
VOI-AR, VOI-RAR, and VOI-SRAR were normalized using Eq. 1
Eq. 1 Eq. 2where I(au) and I(SUV) correspond to the voxel value before and after normalization, respectively. Dose is the injected dose corrected for radioactivity decay at the time of autoradiography. CPET is the mean intensity in VOI-PET, and VPET is the volume of VOI-PET. Similarly, Cauto is the mean intensity in VOI-AR, VOI-RAR, or VOI-SRAR and Vauto is the volume of VOI-AR, VOI-RAR, or VOI-SRAR. K* therefore represents the scaling factor that converts autoradiographic images expressed in arbitrary units into SUV units so that they can be compared with the PET images.
Similarly, the histologic images were normalized using a calibration factor K**: Eq. 3
Eq. 3 Eq. 4where CH represents the mean intensity in VOI-H and VH is the volume of VOI-H.
Texture Analysis
For each selected 2-dimensional image and each modality, we computed the maximum intensity in the tumor region of interest. Before computing the texture matrices, we resampled the voxel intensities using an absolute resampling method with fixed bounds and 64 discrete values (15): Eq. 5where R(x) is the voxel intensity after discretization and I(x) is the voxel intensity before discretization. The lower bound was set to 0. The upper bound corresponds to the maximum intensity over all images for each image type across the 3 tumors. The upper bound was 6 for VOI-PET, 0.1 for VOI-AR, 12 for VOI-RAR, 9 for VOI-SRAR, and 175 for VOI-H.
After this resampling step, we computed 3 texture matrices in 2 dimensions for each slice and each modality and we extracted 6 texture indices with LIFEx software (http://www.lifexsoft.org/): homogeneity and entropy computed from the cooccurrence matrix, short-run emphasis (SRE) and long-run emphasis (LRE) from the gray-level-run length matrix, and low gray-level-zone emphasis (LGZE) and high gray-level-zone emphasis (HGZE) from the gray-level-zone length matrix. These indices were selected given their previously demonstrated robustness with respect to the segmentation method (16).
Relationship Between Texture Indices and Actual Biologic Tissue Composition
Using one tumor slice from one mouse that included a great variety of cell densities, we investigated the sensitivity of texture indices to various patterns of cell arrangements. We defined 80 subregions of 30 × 30 voxels in the histologic images and copied them to the autoradiographic images. The histologic images were transformed into binary images using a threshold to identify the presence of cells. Three types of subregions exhibiting different cell arrangements were identified: subregions A (n = 10), consisting of a large continuous area of cells with no more than 3 small islands of extracellular matrix (<15% of the surface), or the opposite (mostly extracellular matrix with ≤ 3 small islands of cells); subregions B (n = 10), consisting of 2 distinct tissue types (cells and extracellular matrix) clearly separated in terms of location and in comparable proportions (35%–65% of cells); and subregions C (n = 10), consisting of 2 nested mixed tissue types in comparable proportions (35%–65% of cells). The 15%, 35%, and 65% values were arbitrarily chosen to obtain well-distinguished cell arrangements. In each subregion, we computed the value of texture indices in autoradiographic images.
Statistical Analysis
To investigate the relationship between texture indices derived from the various image types, we plotted PET-derived indices as a function of autoradiography-derived indices, autoradiography-derived indices as a function of histology-derived indices, and PET-derived indices as a function of histology-derived indices. All these plots were characterized by the Spearman correlation coefficient. Moreover, we compared the index values derived from PET and autoradiography using Bland–Altman plots.
We studied the impact of voxel size and spatial resolution by plotting texture indices from VOI-AR against texture indices from VOI-RAR and texture indices from VOI-RAR against texture indices from VOI-SRAR. We also characterized the observed relationships using Spearman correlation coefficients.
We used box-plot analyses and Wilcoxon tests to study the ability of texture indices to distinguish between the 3 types of subregions on histologic images. We also studied the impact of cell density by comparing texture indices between subregions A with more than 85% cells (A+) and subregions A with less than 15% cells (A−). Again, the 15% and 85% thresholds were arbitrarily chosen.
RESULTS
We selected 28 slices from all 3 tumors together, with a minimum of 388 μm between slices in the PET, autoradiography, RAR, SRAR, and histologic volumes.
Correlation Between Texture Analysis on Different Scales
The autoradiography-derived values are plotted against the PET-derived values in Figure 2 and Supplemental Figure 1 (supplemental materials are available at http://jnm.snmjournals.org). All texture indices and maximum intensities correlated significantly between PET and autoradiography (R = 0.57–0.85) (Table 1), but the Bland–Altman plots showed differences in the absolute values of the texture indices and maximum intensities between the 2 modalities (Fig. 2 and Supplemental Fig. 1). For example, entropy, SRE, HGZE, and maximum intensity were lower when derived from autoradiography than when derived from PET. Inversely, homogeneity, LRE, and LGZE were higher for autoradiography than for PET.
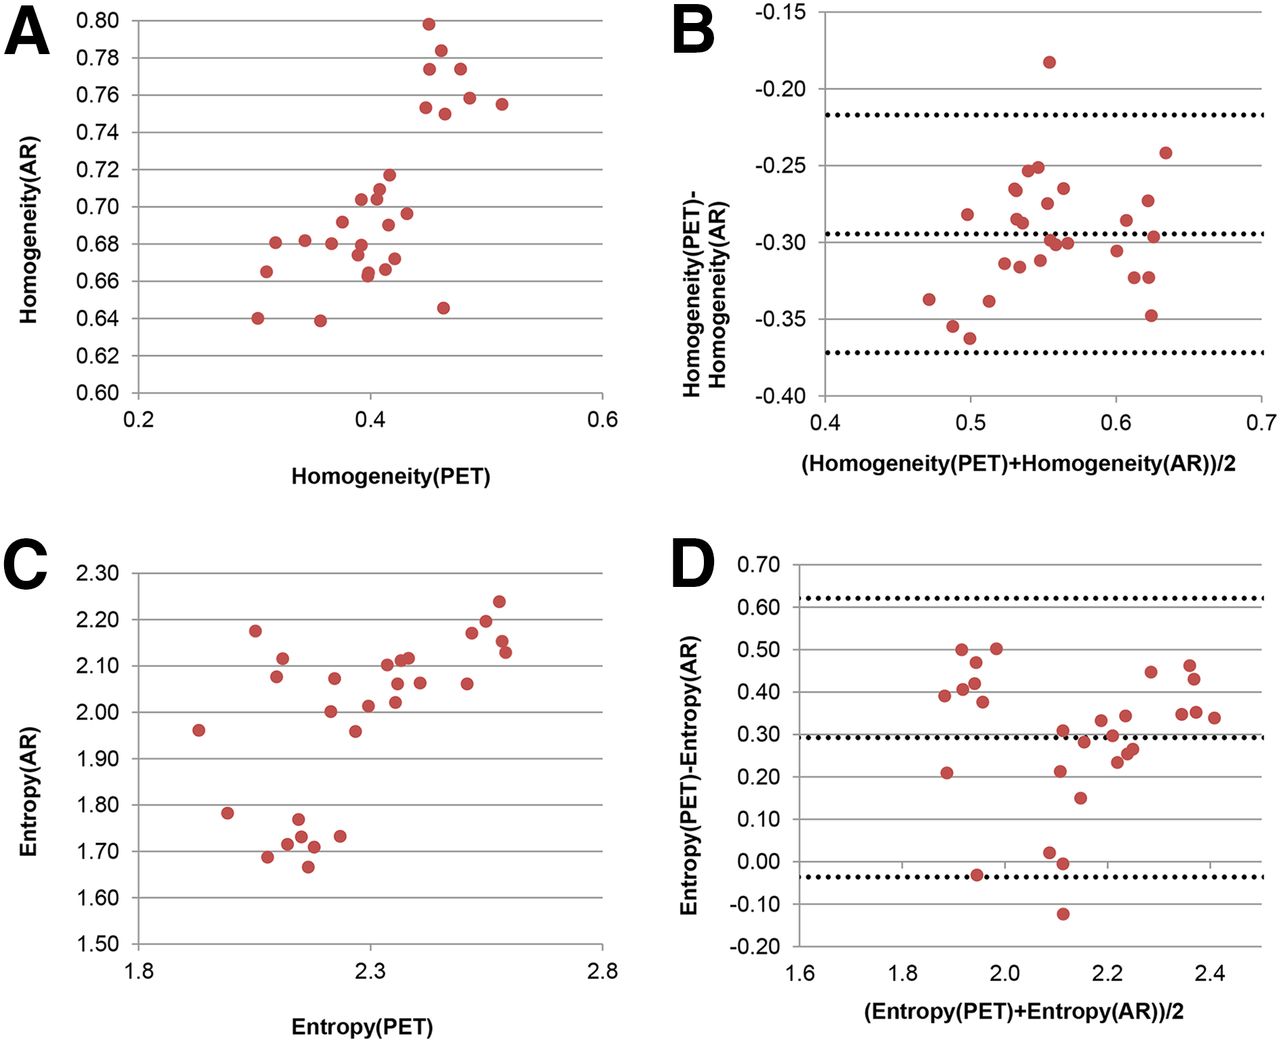
Plots of index derived from autoradiographic (AR) images as function of index derived from PET images and corresponding Bland–Altman plots.
Comparison of Spearman Correlation Coefficients Among Different Modalities for 6 Texture Indices and for Maximum Intensity
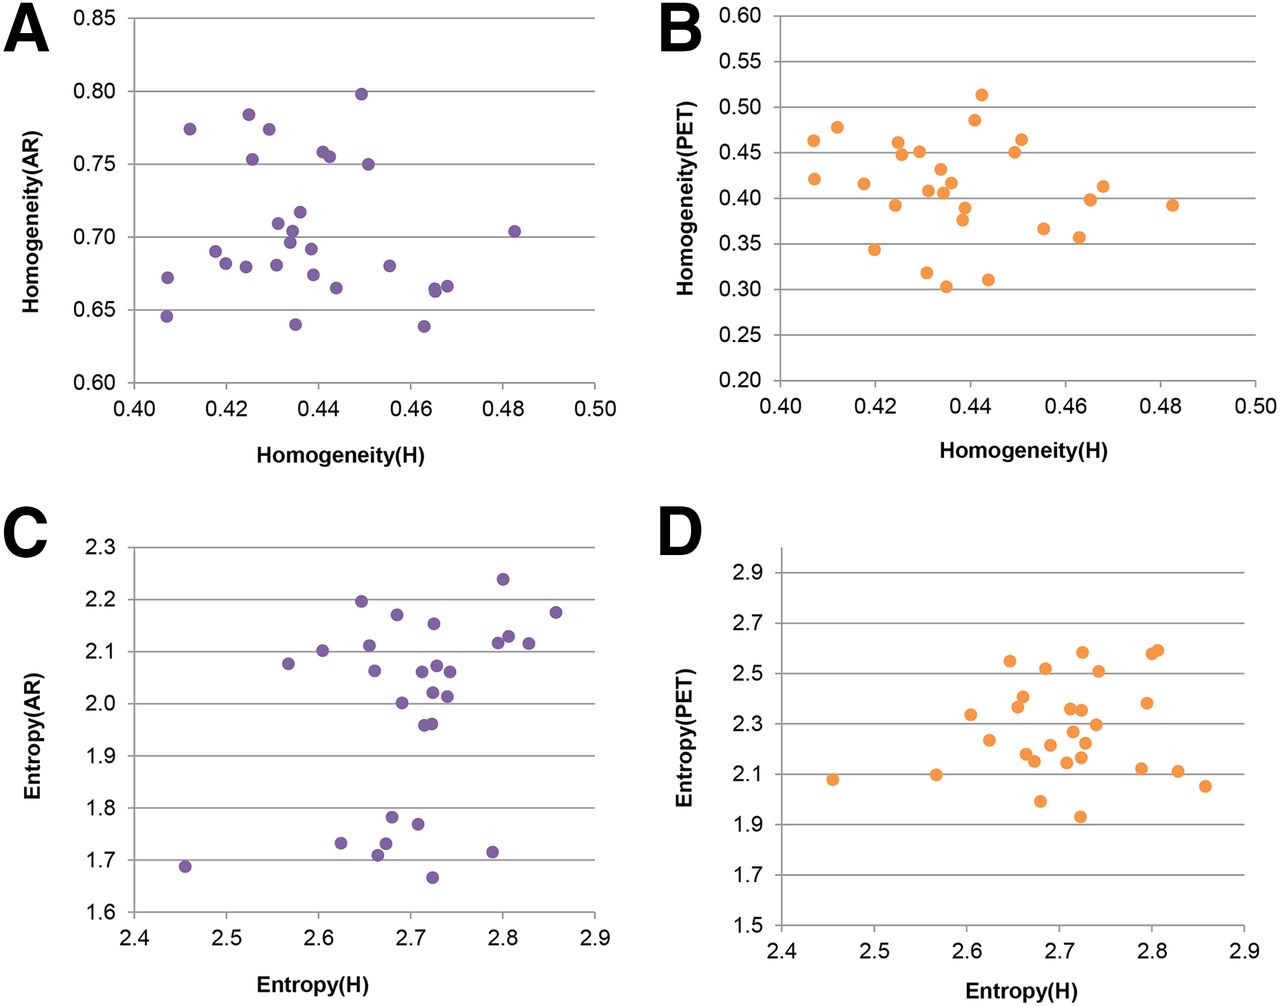
The histology-derived values are plotted against the autoradiography- and PET-derived values in Figure 3 and Supplemental Figure 2. Neither the texture indices nor the maximum intensities showed a significant positive correlation (Table 1).

Plots of index derived from autoradiographic (AR) images or PET images as function of index derived from histologic (H) images.
Effect of Voxel Size and Spatial Resolution in Autoradiographic Images
The plots of the texture index values measured from VOI-RAR against those measured from VOI-AR are shown in Supplemental Figure 3, together with the values measured from VOI-SRAR against those measured from VOI-RAR; their Spearman correlation coefficients are in Table 1. All texture indices and maximum intensity correlated moderately or strongly between VOI-AR and VOI-RAR (R ≥ 0.62), but the absolute values of the texture indices differed. Indeed, texture measured from VOI-AR was more homogeneous than that from VOI-RAR. For instance, homogeneity, LRE, and LGZE were greater in VOI-AR than in VOI-RAR, and the opposite was true for the other indices (Supplemental Fig. 3), demonstrating that voxel size influences the absolute value of texture indices.
Regarding the influence of spatial resolution, the plots of texture indices measured from VOI-SRAR as a function of texture indices measured from VOI-RAR (Supplemental Fig. 3) showed there to be a high correlation for entropy (R = 0.96) but only a moderate correlation for the other texture indices and for maximum intensity (R = 0.59–0.69). For homogeneity, entropy, SRE, and LRE, there was no significant difference between the values calculated from VOI-RAR and those calculated from VOI-SRAR (P > 5%, Wilcoxon test), suggesting that changing the spatial resolution did not significantly change the texture index values when the voxel size was identical.
Texture Index Values on Autoradiographic Images as Function of Tumor Cell Density and Arrangement
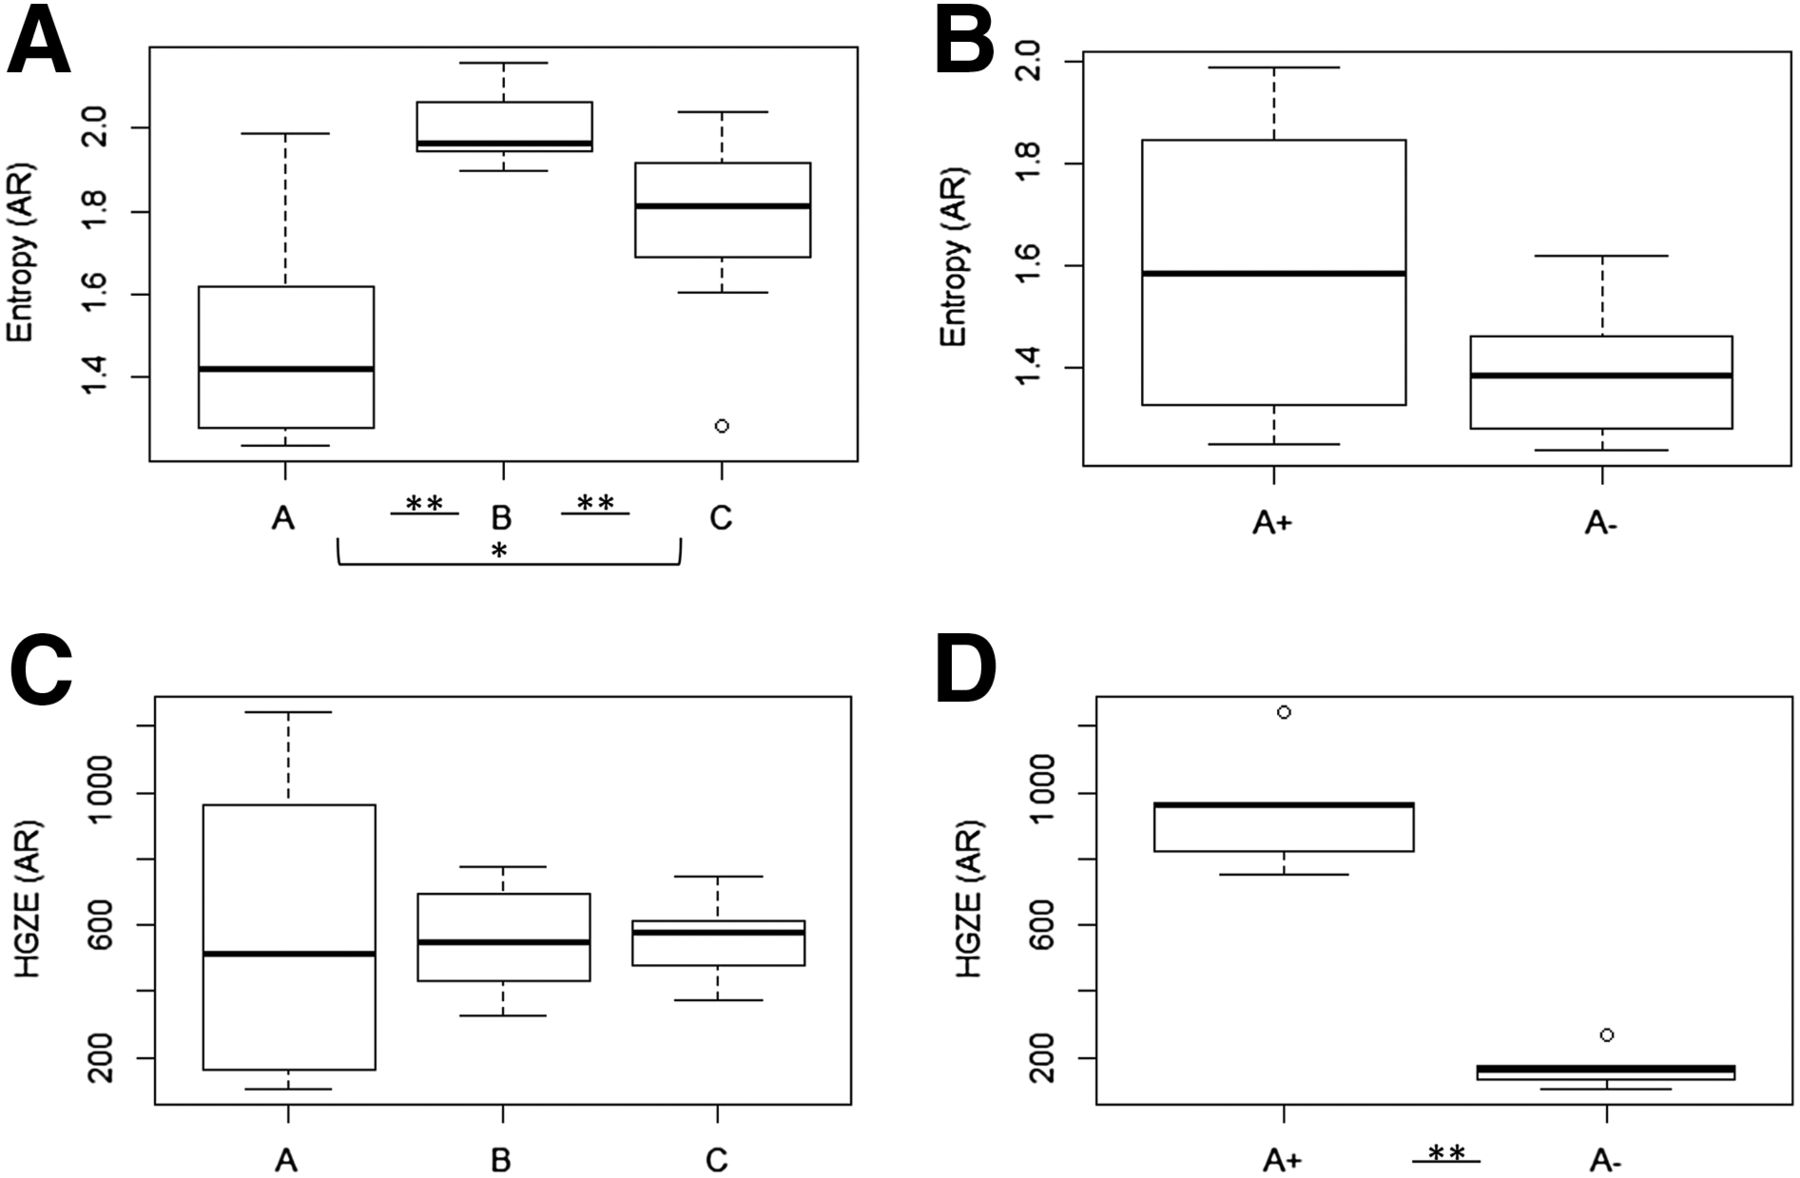
Only homogeneity, entropy, SRE, and LRE significantly differed between subregions A, B, and C (Figs. 4 and 5 and Supplemental Fig. 4): subregions A were more homogeneous than subregions C, and subregions C were more homogeneous than subregions B. For instance, homogeneity and entropy had respective median values of 0.68 and 1.42 in subregions A, 0.61 and 1.96 in subregions B, and 0.64 and 1.81 in subregions C. Conversely, HGZE, LGZE, and maximum intensity did not significantly differ between the 3 subgroups of cell arrangement.

Image of selected tumor slice as seen on autoradiographic and histologic images.

Boxplots of texture indices derived from autoradiographic (AR) images as function of cell pattern (subregions A, B, and C) or as function of number of cells in subregions A (A+, A−). *P < 5% on Wilcoxon test. **P < 1% on Wilcoxon test.
In subregions A, HGZE, LGZE, and maximum intensity were sensitive to cell density and could distinguish A+ from A−, whereas the other indices could not. For example, HGZE and maximum intensity were higher for A+ than for A− (Fig. 5 and Supplemental Fig. 4), and the opposite was true for LGZE (Supplemental Fig. 4). The median values for HGZE, maximum intensity, and LGZE were 965, 0.06, and 0.001, respectively, for A+ and 163, 0.03, and 0.007, respectively, for A−.
DISCUSSION
In this study, we showed that texture derived from in vivo PET images reflects texture derived from ex vivo autoradiographic images and that some texture indices are more sensitive to the spatial distribution of cells whereas others are more sensitive to the density of tumor cells in the region of interest. This study also demonstrated the potential and limitations of PET-derived indices to quantify microscopic heterogeneity.
Multiscale Comparison of Texture Index Values
All texture indices correlated significantly between PET and autoradiographic images, even if the absolute values differed between modalities because of differences in voxel size and spatial resolution. This finding demonstrates the ability of texture indices to quantify heterogeneity seen on different scales. However, we observed that indices derived from PET or autoradiographic images did not correlate significantly with those from histologic images, suggesting that the precise spatial distribution of cells was captured neither by PET nor by autoradiography. These results may partly be explained by the nonspecific uptake of 18F-FDG. Indeed, cells seen on the histologic images were not necessarily 18F-FDG–avid, and a better correlation might be expected using glucose transporter 1 immunohistochemistry (17). Nevertheless, using subregions in the autoradiographic images, we demonstrated that some indices were sensitive to the spatial organization of tumor cells whereas others were sensitive to cell density as seen on the histologic images. Texture indices may therefore provide some useful information on the spatial organization of tumor cells even if the index value derived from a PET or autoradiographic image cannot be directly translated into a textural pattern seen on the histologic images. This observation could explain some results previously reported in the literature. For instance, one study found that texture analysis of SPECT images (18) could differentiate between 2 types of hepatic metastatic colorectal cancer by showing greater homogeneity for well-differentiated than poorly differentiated tumors. Those investigators also found that in poorly differentiated liver metastases, texture indices were sensitive to the action of an antivascular treatment that produced an increase in homogeneity. Inversely, texture indices could not distinguish between treated and untreated well-differentiated metastases. Because histologic analysis did exhibit the treatment-induced modifications, this example illustrates the limited ability of SPECT-derived texture indices to characterize tumor cell heterogeneity.
Robustness of Texture Indices with Respect to Voxel Size and Image Spatial Resolution
All texture indices correlated significantly between VOI-AR and VOI-RAR or between VOI-RAR and VOI-SRAR, with a correlation coefficient higher than 0.59, suggesting that PET-derived texture indices reflect measurements on a microscopic scale. Yet, the absolute values of all texture indices were affected by substantial differences in voxel size and, in some cases, spatial resolution. As a result, it appears that the index values cannot be readily compared between images with a large difference in voxel size (voxels were 2,000 times larger on PET images than on autoradiographic images). We found that autoradiographic images are seen by texture indices as being more homogeneous than PET images, as is consistent with a more homogeneous texture in autoradiographic images than in RAR images. Although this trend might appear counterintuitive, it is due to the calculation procedure. When texture indices are calculated, the actual voxel size is not considered. Yet for the same lesion, the VOI-AR contain more voxels than the VOI-PET or VOI-RAR. As a result, a small, homogeneous zone that might be represented by only a very few voxels in a VOI-PET will involve many voxels in a VOI-AR and hence “weighs” more, causing the texture indices to reflect a more homogeneous texture. Entropy was the most robust index with respect to differences in spatial resolution (R = 0.96 between VOI-RAR and VOI-SRAR that had similar values [1.8–2.8]). These results were consistent within the correlation groups previously identified (16), as reported in Supplemental Table 1. In one study (19), it was shown that the 6 texture indices were moderately influenced by the postreconstruction smoothing of PET images, excepting LGZE. These results were obtained not with our absolute resampling method but with relative resampling of discrete intensities between the minimum and maximum for each lesion. The smoothing was also weaker in that study, which used a full width at half maximum of 0.9 times the voxel size (19), compared with 1.7 times the voxel size between RAR and SRAR images in our study. Consistent with our results, another study (20) demonstrated that the 6 texture indices were not more affected by smoothing than was SUVmax, also with the relative resampling. This result is due to the resampling step before texture index calculation. Indeed, by assigning the same value to voxels with similar intensities, resampling actually acts as a smoothing operation and reduces the impact of the noise that affects indices such as SUVmax.
Study Limitations
A limitation of our study was the small number of animals and the use of only one tumor model. Moreover, uptake of 18F-FDG is not specific to tumor cells and can also reflect inflammation. Still, these limitations do not invalidate our results regarding the change in texture indices as a function of voxel size, spatial resolution, and observation scale (autoradiography or PET images). In addition, because we performed texture analysis on 28 distant slices that could be seen as independent, the correlations between texture indices calculated from PET images and autoradiographic images were based on 28 points. The use of more specific PET tracers, other immunohistochemical analyses, more animals, and more tumor cell lines would be necessary to better understand the relationship between heterogeneity seen on PET images and microscopic heterogeneity. In addition, the preclinical PET scanner had a spatial resolution of 1.6 mm, and the tumors were approximatively 10 mm in diameter. In a clinical setting, this would translate to analyzing tumors that are about 4 cm in diameter with a PET image spatial resolution of 6 mm. Further studies are needed to better understand the relationship between texture indices derived from clinical images and tissue heterogeneity seen on histologic images.
CONCLUSION
Autoradiography-derived texture indices are sensitive to the spatial distribution or density of tumor cells, and PET-derived texture indices correlate well with those derived from autoradiography, although there are differences in magnitude between the two because of differences in voxel size and spatial resolution. PET-derived texture indices cannot easily be correlated with texture seen on histologic images and cannot precisely capture the heterogeneity of tumor cells, yet additional information may still be gleaned about the tumors and, potentially, about their aggressiveness and resistance to therapy. Although the biologic meaning of texture indices still needs to be clarified, their use may help characterize a whole tumor more extensively than is possible through biopsy alone. Further investigations are needed to better elucidate the relationship between the biologic features of tumors and the heterogeneity of tracer uptake as reflected by texture indices.
DISCLOSURE
The costs of publication of this article were defrayed in part by the payment of page charges. Therefore, and solely to indicate this fact, this article is hereby marked “advertisement” in accordance with 18 USC section 1734. This work is supported by the “Lidex-PIM” project funded by the IDEX Paris-Saclay (ANR-11-IDEX-0003-02). No other potential conflict of interest relevant to this article was reported.
Footnotes
Published online Jun. 3, 2016.
- © 2016 by the Society of Nuclear Medicine and Molecular Imaging, Inc.
REFERENCES
- Received for publication February 8, 2016.
- Accepted for publication April 28, 2016.


Jump to section
Related Articles
Cited By...
- Histology-Based Radiomics for [18F]FDG PET Identifies Tissue Heterogeneity in Pancreatic Cancer
- Experimental Multicenter and Multivendor Evaluation of the Performance of PET Radiomic Features Using 3-Dimensionally Printed Phantom Inserts
- Optimized Feature Extraction for Radiomics Analysis of 18F-FDG PET Imaging
- LIFEx: A Freeware for Radiomic Feature Calculation in Multimodality Imaging to Accelerate Advances in the Characterization of Tumor Heterogeneity
- A Postreconstruction Harmonization Method for Multicenter Radiomic Studies in PET
- Understanding Changes in Tumor Texture Indices in PET: A Comparison Between Visual Assessment and Index Values in Simulated and Patient Data