


Visual Abstract

Abstract
Radiomics features can reveal hidden patterns in a tumor but usually lack an underlying biologic rationale. In this work, we aimed to investigate whether there is a correlation between radiomics features extracted from [18F]FDG PET images and histologic expression patterns of a glycolytic marker, monocarboxylate transporter-4 (MCT4), in pancreatic cancer. Methods: A cohort of pancreatic ductal adenocarcinoma patients (n = 29) for whom both tumor cross sections and [18F]FDG PET/CT scans were available was used to develop an [18F]FDG PET radiomics signature. By using immunohistochemistry for MCT4, we computed density maps of MCT4 expression and extracted pathomics features. Cluster analysis identified 2 subgroups with distinct MCT4 expression patterns. From corresponding [18F]FDG PET scans, radiomics features that associate with the predefined MCT4 subgroups were identified. Results: Complex heat map visualization showed that the MCT4-high/heterogeneous subgroup was correlating with a higher MCT4 expression level and local variation. This pattern linked to a specific [18F]FDG PET signature, characterized by a higher SUVmean and SUVmax and second-order radiomics features, correlating with local variation. This MCT4-based [18F]FDG PET signature of 7 radiomics features demonstrated prognostic value in an independent cohort of pancreatic cancer patients (n = 71) and identified patients with worse survival. Conclusion: Our cross-modal pipeline allows the development of PET scan signatures based on immunohistochemical analysis of markers of a particular biologic feature, here demonstrated on pancreatic cancer using intratumoral MCT4 expression levels to select [18F]FDG PET radiomics features. This study demonstrated the potential of radiomics scores to noninvasively capture intratumoral marker heterogeneity and identify a subset of pancreatic ductal adenocarcinoma patients with a poor prognosis.
Pronounced tumor heterogeneity is one of the hallmarks of pancreatic ductal adenocarcinoma (PDAC) (1–4). Different molecular subtypes of PDAC coexist in the same patient (5,6), exploiting distinct metabolic pathways (7) and thus providing a survival advantage under metabolic challenges such as low oxygen and nutrient supply. Moreover, the high adaptive fitness and metabolic plasticity of PDAC allow and support treatment resistance (8–14).
Pronounced activation of glycolysis, the Warburg effect, is one of the oldest cancer features described (15). In PDAC, high expression of glycolytic genes indeed predicts worse survival, both in a resectable setting and in a metastatic setting (7). Monocarboxylate transporter 4 (MCT4) is a lactate exporter and the last player in the glycolytic set of reactions. Histopathologic analysis of MCT4 in PDAC showed that high MCT4 expression, both in cancer and in stromal cells, predicts substantially worse survival (16).
Clinically, glucose uptake into tumors is detected via PET imaging with the radiotracer [18F]FDG (17). Metabolic activity readouts measured by [18F]FDG PET, such as SUVmax, were reported to correlate with PDAC tumor grading (18) and to have prognostic value (19,20), generally showing that a higher [18F]FDG uptake is associated with a poor outcome (21). However, these single readouts extracted from the [18F]FDG PET images are assumed to represent the whole lesion, although it is well observed that PDAC tumors often present heterogeneous [18F]FDG uptake patterns (22,23). The general failure of PDAC clinical trials is attributed mostly to tissue heterogeneity and the resulting difficulty in selecting patients who would benefit from a particular therapy. Thus, there is an urgent need for noninvasive methods that could be used for patient selection. Radiomics technology, by allowing extraction and quantification of medical image characteristics and investigation of their correlation with underlying biologic features, shows a predictive value that can guide optimal therapy planning.
In this work, we aimed to use a radiomics approach to identify and extract features from [18F]FDG PET images that allow capture of glycolytic heterogeneity and, subsequently, patient stratification based on that heterogeneity. Current approaches to PDAC subtyping demand invasive (biopsy/resection) and labor-intensive (RNA/histopathologic analysis) procedures and suffer from sampling error since only a part of the tumor is analyzed. Differently, whole-tumor PET images acknowledge the intratumoral heterogeneity, and radiomics allows extraction and quantification of multiple features from [18F]FDG PET images, describing patterns of tracer distribution in the whole PDAC lesion (24). Although some studies show a radiomics score to have prognostic value (25), most studies lack a plausible link between tracer uptake and its biologic underpinnings. So far, some general histopathologic features such as tissue cellularity have been correlated with radiomics texture features derived from [18F]FDG PET images in different tumors (26,27). However, to the best of our knowledge, correlating radiomics features with the expression of a defined histopathologic marker that underlies a specific biologic process, such as MCT4 here as a glycolysis marker, has not been explored yet. This caveat in the biologic rationale for a given radiomics score hampers further fine-tuning in the development of [18F]FDG PET as a noninvasive biomarker for PDAC characterization (28).
To this end, we introduce 3 methodologies to the field of PDAC research. First, we extract so-called pathomics features via texture analysis of density maps based on the immunohistochemical expression patterns of different markers, also revealing expression heterogeneity for each marker independently. Second, we link 3-dimensional data from PET analyses one-to-one with 2-dimensional data from digital pathology by investigating the distribution of immunohistochemistry staining at a comparable resolution of PET images in an automated way.
Last, we apply the MCT4-based pathomics features to develop [18F]FDG PET–based radiomics scores. Here, we offer a radiomics-based, automated approach to correlate histopathologic MCT4 expression analysis with [18F]FDG PET image features, allowing development of radiomics scores that capture intratumoral glycolytic marker heterogeneity as a noninvasive means to identify a subset of PDAC patients with a poor prognosis.
MATERIALS AND METHODS
This study was performed in line with the principles of the Declaration of Helsinki. Approval was granted by the Medical Ethical Review Committee of region Arnhem-Nijmegen on June 18, 2018, under study number CMO2018-4420.
Patient Characteristics
A development cohort of 29 patients who underwent resection of PDAC, and from whom paired whole-tumor cross sections and PET scans were available, was used to develop an [18F]FDG PET/CT signature that captures intratumoral marker (MCT4, MCT1, pan-cytokeratin, and collagen) expression patterns. The availability of whole-tumor tissue minimized sampling error and enabled acknowledgment of tumor heterogeneity. Details on the proposed pipeline can be found in the supplemental methods (supplemental materials are available at http://jnm.snmjournals.org) and in Figure 1, Supplemental Figures 1–6, and Supplemental Tables 1–3 (29–39). The prognostic value of this [18F]FDG PET/CT signature was investigated in an independent validation cohort of 71 pancreatic cancer patients who underwent palliative treatment.

Overview of imaging analysis pipeline. In development cohort (29 patients), whole-tumor cross sections capturing intratumoral heterogeneity were stained for markers for glycolysis (MCT4, MCT1) and markers for cancer and stromal cells (pan-cytokeratin, sirius red) and processed into density maps. From these density maps, pathomics features were computed, which allowed identification of clusters of patients with similar spatial distributions of investigated markers. In parallel, [18F]FDG PET images from same patients were analyzed to extract radiomics features, which were then selected to reflect pathomics scores. MCT4-based radiomics score of 7 selected features for [18F]FDG PET was subsequently applied in validation cohort (71 patients) and identified subgroup of PDAC patients with poor prognosis. IHC = immunohistochemistry.
Algorithm Optimization for Immunohistochemistry Analyses
Resected PDAC tumors from the development cohort were processed in one block, and consecutive tissue sections were stained for monocarboxylate transporter 4 (MCT4), monocarboxylate transporter 1 (MCT1), pan-cytokeratin, and collagen marker (sirius red) (the supplemental materials provide details on the immunohistochemistry protocols). Pathomics features and texture features were extracted via texture analysis of density maps of the expression of each individual marker. Pathomics features (n = 74) were computed using an immunohistochemistry algorithm based on the output of an optimized color-unmixing method (Fig. 1; Supplemental Fig. 3). Color thresholds from the staining of interest and background staining were used to create density maps from which all pathomics features were then extracted. Of a total 74 pathomics features, 37 were robust to variations in density map parameters (kernel size, image discretization, and in silico cutting) and were selected for further comparison (Supplemental Table 2). The k-means clustering of the 37 pathomics features revealed 2 distinct clusters of patients.
Algorithm Optimization for PET Analyses
From the [18F]FDG PET scans, 3-dimensional segmentation of the tumor was performed by SUVmax 40% isocontour and manual correction (supplemental materials), and 73 radiomics features were extracted. Features were tested for stability with respect to several imaging parameters (image discretization and optimal respiratory gating), and 16 robust features were selected (Supplemental Table 3). Next, the radiomics features (n = 7) from the PET scans that were most discriminative in identifying the patient clusters as defined by MCT4 pathomics features were selected. The predictability and clinical significance of the identified 7 radiomics features were assessed in an independent validation cohort.
Subgroup Identification
On the Uniform Manifold Approximation and Projection (UMAP) using all the robust MCT4 pathomics features, we observed different subgroups of patients. To identify these subgroups with different MCT4 expression patterns, the k-means unsupervised clustering algorithm (k = 2) was applied to all the robust MCT4 pathomics features. On the basis of these k-means labels, we selected the MCT4 pathomics features that were most discriminative for these subgroups (as described in the “Feature Selection” section). Hierarchic heat map clustering, also called Complex Heatmap Visualization (CHV) (40), of these selected features was used to investigate differences in the pathomics feature values of the different subgroups. This information was used to investigate and interpret biologic differences between subgroups. This process was repeated for MCT1, pan-cytokeratin, and stroma marker.
Next, we investigated the radiomics features extracted from the [18F]FDG PET scan. On the basis of UMAPs, we identified different subgroups of patients using the k-means (k = 2). We observed a high overlap between one of the MCT4 subgroups and a subgroup based on the PET features. On the basis of the MCT4 k-means labels and the radiomics features, we selected radiomics features that were most discriminative for the MCT4 subgroups (as described in the “Feature Selection” section). On the basis of CHV with these MCT4-based selected radiomics features, we investigated differences in the radiomics feature values of the different subgroups and used this information for biologic interpretation.
Feature Selection
At different points in this study, we selected features (pathomics or radiomics features) that were most discriminative for a label that is generated by k-means (MCT4, MCT1, pan-cytokeratin, stroma). Every time, we used the same approach with a different set of features and a different set of labels. We used minimum redundancy maximum relevance (mRMR) (41) with a bootstrap approach to select features. For each bootstrap, 15 features were selected using the mRMR. Using majority voting, features were selected that occur in at least 75% of the bootstraps. Next, it was checked whether the selected features also occur in alternative feature selection methods using Kbest (χ2, k = 15), linear support vector classification (k = 15, scoring f1, cv 2), and random forest (15 features, 10 times). Only features that were identified via the mRMR approach and by at least one of the other feature selection methods were finally taken into the final list of selected features.
RESULTS
Pathomics Features Identify Distinct MCT4 Expression Patterns
Visual immunohistochemistry analysis revealed that MCT4 is expressed both on tumor cells and on stromal cells, with prominent expression on tumor cells. Visualization of the robust pathomics features (n = 37, Supplemental Table 2) in the feature space via UMAP revealed 2 clearly distinct clusters of MCT4 expression patterns (Fig. 2A). Therefore, we performed clustering analysis using the k-means algorithm (with k = 2 on a 37-dimensional pathomics feature space) to label the patients as MCT4-high/heterogeneous (n = 19) or MCT4-low/homogeneous (n = 10) (Fig. 2B).

MCT4 expression patterns identify distinct MCT4 expression subtypes in PDAC patients using UMAP visualization. (A) Visualization of patient clusters with UMAP using all robust MCT4 pathomics features (n = 37) shows 2 clusters. (B) Use of k-means (k = 2) identifies 2 patient clusters: MCT4-high/heterogeneous and MCT4-low/homogeneous.
We further selected the pathomics features most discriminative for the 2 identified k-means patient clusters, MCT4-high/heterogeneous and MCT4-low/homogeneous. For this purpose, we used feature selection techniques using MCT4-high/heterogeneous and MCT4-low/homogeneous as targets. A combination of 4 different feature selection methods (mRMR, Kbest, linear support vector classification, and random forest; supplemental methods) was used. Five pathomics features were identified as most discriminative for MCT4-high/heterogeneous versus MCT4-low/homogeneous: ratio (percentage of pixels stained for MCT4 compared with the total tumor region); 90 percentile, a first-order feature; inverse difference normalized from the gray level cooccurrence matrix; zone percentage from the gray level size zone matrix; and gray level nonuniformity normalized from the gray level run length matrix (Supplemental Table 4).
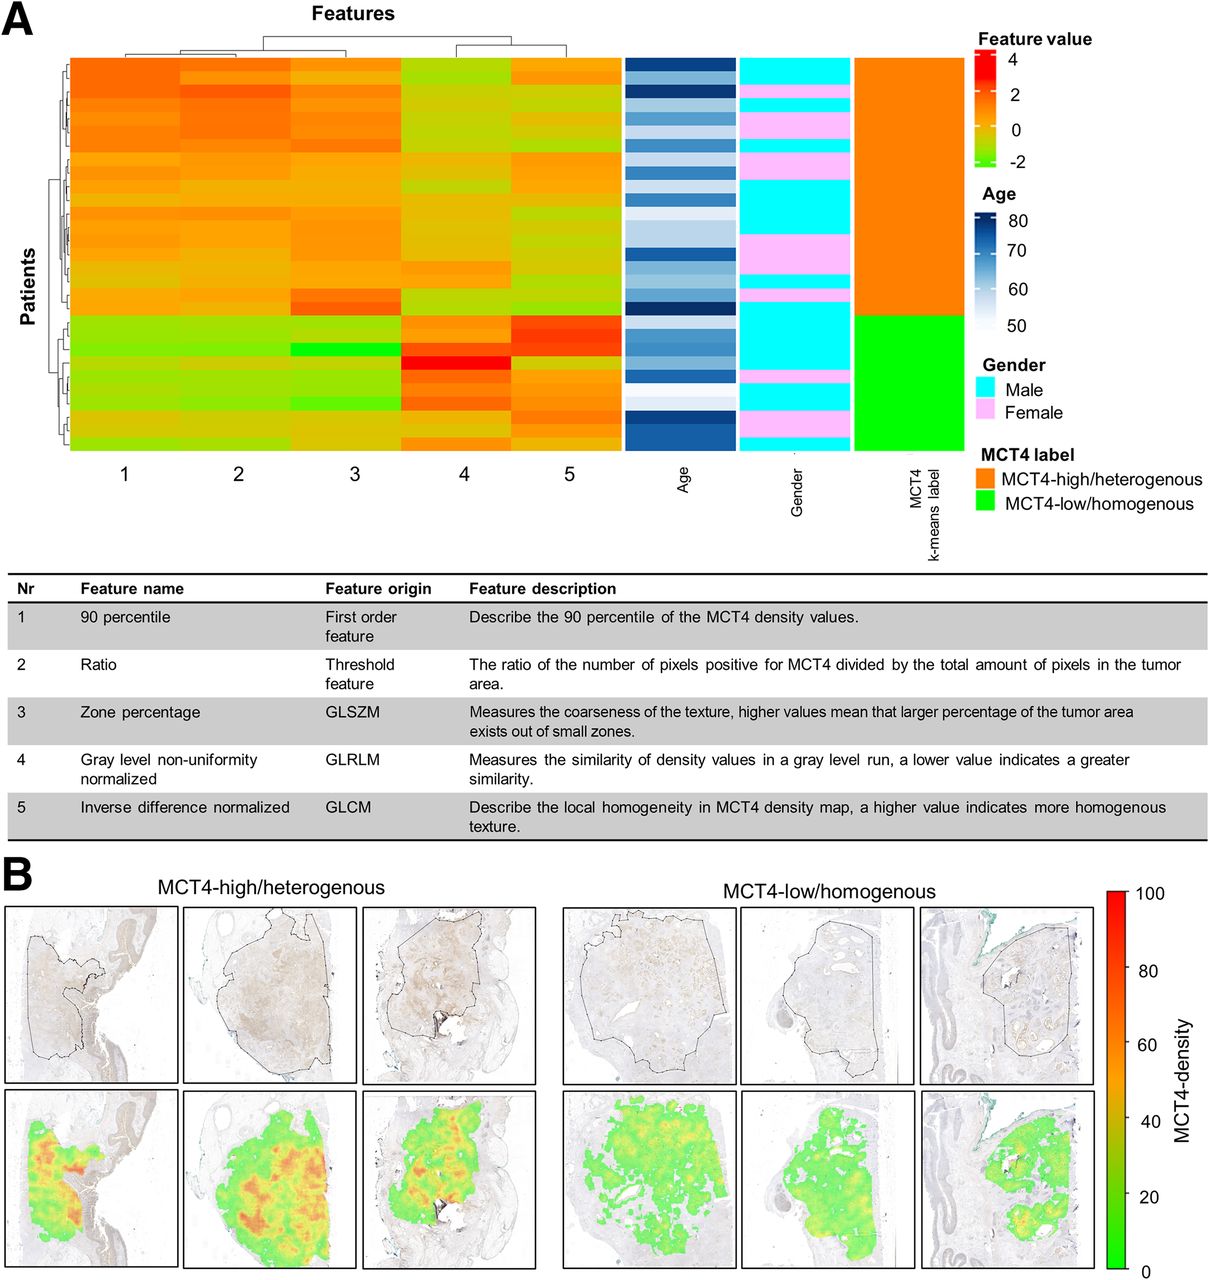
After visual inspection of the CHV graph, where the 5 selected pathomics features were plotted, we observed a clear difference between MCT4-high/heterogeneous and MCT4-low/homogeneous clusters (Fig. 3A). The MCT4-high/heterogeneous patient cluster contained tumors with a high amount and density of MCT4 expression and a more heterogeneous and fine-grained texture, as opposed to the MCT4-low/homogeneous patient cluster, which contained a lower intensity and lower density of MCT4 expression with a more homogeneous and compact texture (Figs. 3A and 3B).

MCT4 expression patterns identify distinct MCT4 expression subtypes in PDAC. (A) CHV visualization of 2 patient clusters using MCT4 robust pathomics features. (B) Examples of representative density maps for MCT4-high/heterogeneous and MCT4-low/homogeneous patients. GLCM = gray level cooccurrence matrix; GLRLM = gray level run length matrix; GLSZM = gray level size zone matrix.
MCT4 Expression Patterns Link to [18F]FDG Uptake Patterns
We further explored whether the clusters observed in MCT4 histologic images can be correlated with the glycolytic activity of the tumor captured via [18F]FDG PET images. For this purpose, we used the data of the development cohort for whom both histology and PET scans were available (Fig. 1). On the basis of the segmented 3-dimensional volumes, a set of 73 radiomics texture features were computed (the supplemental materials provide details) (31), and 16 radiomics features, defined as robust, were selected (Supplemental Table 3). Using UMAP based on the 16 robust radiomics features, we observed 2 patient clusters (Fig. 4A).

[18F]FDG expression patterns identify distinct subtypes in PDAC patients that link to MCT4 expression. Two distinct patient clusters using [18F]FDG PET radiomics features are visualized. (A) UMAP with 16 robust radiomics features showing 2 clusters. (B) UMAP with 16 robust radiomics features and based on MCT4-high/heterogeneous and MCT4-low/homogeneous. (C) UMAP with 7 selected radiomics features and based on MCT4-high/heterogeneous (n = 19) and MCT4-low/homogeneous (n = 10).
As done for MCT4 pathomics features, we also analyzed the importance of PET radiomics features by clustering PET data into 2 subgroups defined by MCT4 k-means labels (i.e., MCT4-high/heterogeneous and MCT4-low/homogeneous) on a 16-dimensional radiomics feature space. We used the same feature selection techniques as were used for immunohistochemistry data (mRMR, Kbest, linear support vector classification, and random forest), which determined that 7 radiomics features were most discriminative: the 5 first-order features SUVmean, SUVmax, uniformity, total lesion glycolysis (TLG), and interquartile range, as well as inverse difference and informational measure of correlation 1 from the gray level cooccurrence matrix (Supplemental Table 5 (31)). Using these 7 selected features, we obtained patient clustering similar to that when all radiomics features were used (Figs. 4B and 4C).
Visual inspection of the CHV confirmed that the cluster containing mostly MCT4-high/heterogeneous cases was associated with higher and heterogeneous [18F]FDG uptake (Fig. 5A). This subgroup was also associated with more local variation in intratumoral [18F]FDG uptake and with lower local homogeneity than was the other PET cluster, containing a mixture of MCT4-high/heterogeneous and MCT4-low/homogeneous (Figs. 5A and 5B). These results suggest that tumors with high [18F]FDG uptake present higher and more heterogeneous expression patterns of the MCT4 lactate exporter and that biologically interpretable patterns may underlie the features of PET images.

MCT4 expression profiles link to [18F]FDG PET uptake patterns. (A) Visualization of PET feature values of selected radiomics features using CHV. (B) Visualization of [18F]FDG uptake patterns (arrowheads) on representative examples of PET scans of MCT4-high/heterogeneous and MCT4-low/homogeneous. GLCM = gray level cooccurrence matrix; het = heterogeneous; hom = homogeneous.
Next, we challenged the ability of single features of the radiomics score, such as the commonly used SUVmean, SUVmax, and TLG, to stratify patients according to MCT4 expression patterns. Single features in combinations of two also demonstrated good ability in discovering MCT4 expression patterns in the tissue, which could be further fine-tuned using the 7 selected features (Supplemental Figs. 7–9). To maximize the potential of this MCT4-based radiomics score for other PDAC cohorts with different frequencies of distinct MCT4 expression patterns and to minimize dependency on arbitrary choices, we opted to proceed with a signature of 7 PET features, allowing an unsupervised clustering approach.
[18F]FDG Uptake Patterns Are Not Associated with MCT1 Expression Patterns
In addition to MCT4, we also stained consecutive tumor slides for lactate transporter MCT1. MCT1 was also found to be expressed on tumor and stromal cells, with prominent expression in stroma as well. Using the same setup as for the MCT4 analysis, MCT1 pathomics features were extracted. Since the results of the stability test on MCT4 features are based solely on technical aspects of whole-slide image processing, we also considered the same set of features as robust for density map parameters in MCT1.
These stable pathomics features identified 2 distinct patient clusters in our immunohistochemistry development cohort (Supplemental Fig. 10A). The k-means clustering (k = 2) on MCT1 robust pathomics features identified 2 patterns (MCT1-high/heterogeneous and MCT1-low/homogeneous) of MCT1 expression (Supplemental Fig. 10B). After feature selection based on the MCT1 k-means label, we observed that MCT1-high/heterogeneous was associated with features that showed higher MCT1 expression in smaller zones (Supplemental Figs. 10C and 10D; Supplemental Table 6) than was MCT1-low/homogeneous. However, MCT1 expression patterns had a mixed presence in the 2 clusters of PET-derived features, and we were not able to correlate MCT1 expression pattern to a particular [18F]FDG uptake pattern on PET (Fig. 5A; Supplemental Fig. 11).
[18F]FDG Uptake Patterns Are Associated with Pan-Cytokeratin Expression Patterns
To investigate whether [18F]FDG PET signals can be attributed to PDAC tumor cells and not to other cells in the tumor microenvironment, pathomics scores of pan-cytokeratin (a cancer cell marker) staining performed on consecutive whole-tumor sections were calculated. Stable pathomics features identified 2 distinct clusters of patients based on pan-cytokeratin immunohistochemistry (Supplemental Fig. 12A). The k-means clustering (k = 2) on pan-cytokeratin robust pathomics features defined 2 patterns (pan-cytokeratin-high/heterogeneous and pan-cytokeratin-low/homogeneous) of pan-cytokeratin expression (Supplemental Fig. 12B). After feature selection based on the pan-cytokeratin k-means label, we observed that pan-cytokeratin–high/heterogeneous was associated with features that showed more variation in pan-cytokeratin expression (Supplemental Figs. 12C and 12D; Supplemental Table 7) than was pan-cytokeratin–low/homogeneous. Similar to what was observed for MCT4, pan-cytokeratin–high/heterogeneous expression showed a high overlap with the PET-high/heterogeneous expression pattern (Fig. 5A; Supplemental Figs. 13A and 13B). This suggests that [18F]FDG PET radiomics could be correlated with MCT4-high/heterogeneous and pan-cytokeratin–high/heterogeneous expression patterns (Fig. 5A; Supplemental Figs. 13C and 13D), supporting the presence of MCT4-expressing PDAC cancer cells in PET-high/heterogeneous tumor regions.
[18F]FDG Uptake Patterns Are Associated with Collagen Expression Patterns
The presence of stroma and collagen fibers in the stroma in PDAC is a known determinant of low oxygen and nutrient supply and thus one of the tissue characteristics underpinning metabolic heterogeneity. Therefore, we also investigated collagen expression patterns. Stable collagen pathomics features identified 2 distinct clusters of patients based on sirius red histologic staining (Supplemental Fig. 14A). The k-means clustering (k = 2) defined 2 patterns: collagen-high/heterogeneous and collagen-low/homogeneous expression (Supplemental Fig. 14B). After feature selection based on the collagen k-means label, it was observed that the collagen-high/heterogeneous cluster comprised features describing an increased variation in collagen expression (Supplemental Figs. 14C and 14D; Supplemental Table 8). Collagen-low/homogeneous expression showed a partial overlap with [18F]FDG PET-high/heterogeneous expression (Fig. 5A; Supplemental Figs. 15A and 15B). This suggests that [18F]FDG PET uptake patterns are, at least in part, correlated with collagen expression patterns (Fig. 5A; Supplemental Figs. 15C and 15D).
[18F]FDG PET Patterns Associate with Overall Survival
High MCT4 expression was previously shown to predict worse survival in PDAC (16). Thus, the clinical impact of the MCT4-based [18F]FDG PET radiomics score of the 7 selected radiomics features was investigated in an independent multicenter cohort of 71 PDAC patients (validation cohort) who received not surgical resection but systemic treatment in a palliative setting or best supportive care (Supplemental Table 1). [18F]FDG PET was performed for all patients before the start of systemic treatment. Using this validation cohort, we generated a CHV of the 7 selected radiomics features (radiomics score). The analysis revealed 2 subgroups of patients (PET-high/heterogeneous and PET-low/homogeneous; Fig. 6), which were then used for survival analysis. The PET-high/heterogeneous subgroup presented a worse prognosis than the PET-low/homogeneous subgroup (median overall survival of 34.1 and 45.5 wk, respectively; P = 0.01; Fig. 7). In addition, we trained a logistic regression model to predict MCT4-based patterns with the radiomics score of the 7 selected features. For training, we used the 29 cases from the development cohort using the MCT4-label and the 7 radiomics features. We applied the trained model to the validation cohort, and for each patient we obtained the likelihood of belonging to the MCT4-high/heterogeneous or the MCT4-low/homogeneous subgroup based on radiomics features. Using these predictions, we observed a high concordance in the PET-high/heterogeneous subgroup; 49 of 53 (92.45%) patients were also labeled as MCT4-high/heterogeneous (Fig. 6; Supplemental Table 9). For the PET-low/homogeneous subgroup, the concordance with MCT4-low/homogeneous patterns was somewhat lower, at 11 of 18 (61.11%) (Fig. 6). Therefore, MCT4-based [18F]FDG PET radiomics features allow noninvasive detection of a subset of patients with a poor prognosis.

MCT4-based [18F]FDG PET radiomics features identify subgroups with different [18F]FDG expression patterns. Shown is visualization of PET feature values with CHV using selected radiomics features in validation cohort (n = 71). GLCM = gray level cooccurrence matrix.

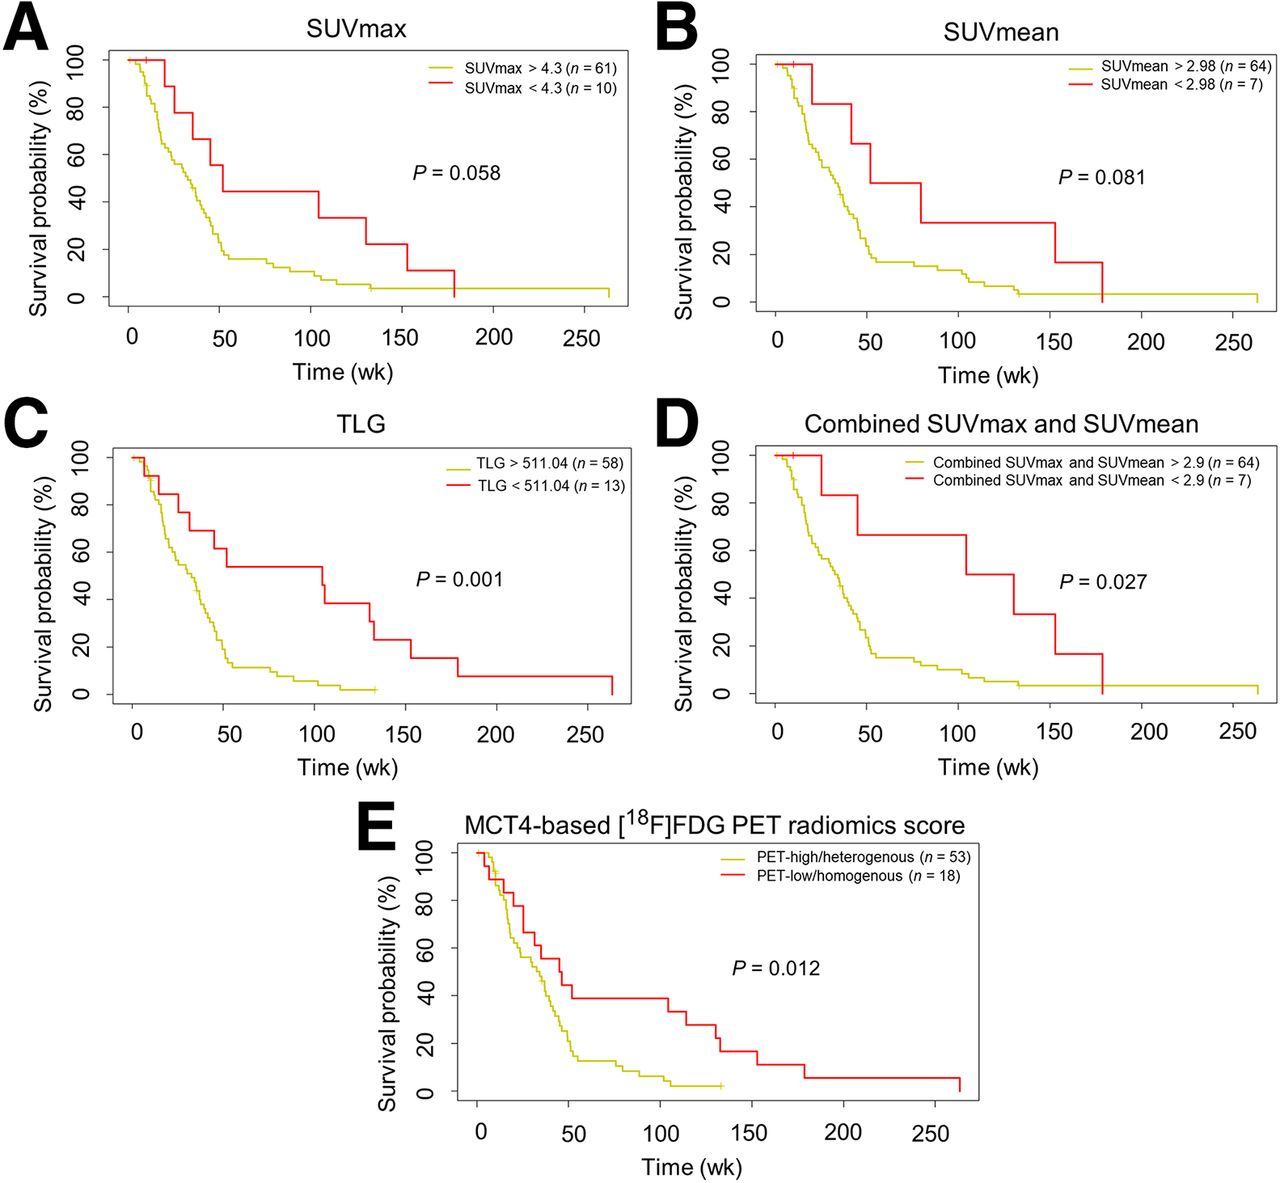
MCT4-based [18F]FDG PET patterns can be associated with overall survival. (A–C) Survival curves based on optimal cutoff for SUVmax, SUVmean, and TLG for validation cohort. High TLG predicts worse survival. (D) Survival curve based on optimal cutoff for combined SUVmax and SUVmean (calculated by [SUVmax − SUVmean] × SUVmean) for validation cohort. (E) Correlation of MCT4-based [18F]FDG PET–derived features with overall survival. Kaplan–Meier survival curves demonstrate impact of these PET-derived features on overall survival. PET-high/heterogeneous label predicts worse survival with statistical significance.
Furthermore, we analyzed whether patient survival can be predicted by single radiomics features such as the traditionally used SUVmax, SUVmean, and TLG, using the optimal cutoff algorithm for optimal separation of patients in survival groups with minimal P value (highest statistical power). The 7-feature radiomics score provides survival prediction with similar statistical power to SUVmean and SUVmax as single features only or combined. However, as a sole feature, higher TLG better predicts worse survival in PDAC patients (Fig. 7) (42).
DISCUSSION
It is increasingly understood that PDAC intra- and intertumoral heterogeneity plays a pivotal role in treatment resistance. To effectively treat PDAC, patient-tailored approaches based on subtype detection and patient stratification are mandatory. This generally requires invasive tissue extraction procedures for genomic or transcriptomic analyses (43). Therefore, noninvasive biomarkers that address and represent the tumor biology are highly needed.
Although the data on the existence of a glycolytic subtype of PDAC are convincing (7,44,45), and [18F]FDG PET as a clinical glycolysis surrogate marker has stood for decades, a good interpretation of [18F]FDG PET signals with a correlation to the underlying biology is missing in PDAC, as well as in many other tumor types. The utility of [18F]FDG PET for PDAC detection and patient stratification has been challenging with different groups using different SUVmax cutoffs for optimal stratification (46). Furthermore, SUVmax is extrapolated as representative of the whole tumor, neglecting intratumoral heterogeneity.
To fill this gap, we aimed to compare the histologic expression of the metabolic markers MCT4 and MCT1 with the findings of [18F]FDG PET scans in a cohort of patients (n = 29) for whom both [18F]FDG PET data and histologic tumor samples were available.
We performed an immunohistochemistry analysis for the lactate transporters MCT4, MCT1, pan-cytokeratin, and sirius red and a consequent radiomics study in which we extracted the most discriminative pathomics features from the histologic staining and correlated these with [18F]FDG PET images. On the basis of the histologic expression patterns of MCT4 and comparative analysis with the [18F]FDG PET signals of the corresponding patients, we determined a set of 7 radiomics features that identify patients with MCT4-high/heterogeneous expression patterns. A good correlation between MCT4-high/heterogeneous histologic patterns and [18F]FDG PET high/heterogeneous radiomics expression patterns was revealed, suggesting a connection between MCT4 positivity and a high [18F]FDG PET signal in tumors.
Furthermore, our observation of a good positive correlation of the PET-high/heterogeneous radiomics feature expression pattern with the pan-cytokeratin–high/heterogeneous pathomics feature expression pattern and the collagen-low/homogeneous feature expression pattern supports the view that tumor regions that are rich in MCT4/pan-cytokeratin–positive cancer cells but poor in collagen-positive stroma are underlying those prominent [18F]FDG PET signals. Stroma-rich PDAC submicroenvironments are generally less populated with cancer cells (13), and in addition, stromal fibers per se organize a barrier for delivery of nutrients (47), including glucose, thus supporting the lower glycolysis in those tumor areas and observed PET-low/homogeneous [18F]FDG signals (Supplemental Fig. 16).
It should be noted that the selected 5 MCT4 pathomics features correlate well with each other and that the stratification power of single features may be high as well. This can in part be explained by the relatively small size of our developmental cohort (n = 29), with rather uniform sizes of smaller PDAC tumors. We anticipate that the 7-feature radiomics score is more robust to variation and less dependent on arbitrary choices than using single features. This will especially be relevant when applying this signature to larger tumors with more pronounced tissue heterogeneity or cohorts with different distributions of MCT4 expression patterns. Thus, to generate a model that can potentially be generalized, we opt for using scores of several features, as we did for all 5 selected pathomics features used here, rather than single features (48).
High expression of MCT4 is a well-described predictor of worse survival in PDAC patients (16). We thus challenged the prognostic power of the developed MCT4-based PET radiomics score on a larger set of PDAC patients (n = 71) in an independent multicenter validation cohort. The radiomics score successfully stratified patients into subgroups with prognostic relevance, where patients with PET-high/heterogeneous label had worse survival. Also, it should be noted that single features of the score, such as SUVmean, SUVmax, or TLG, also performed well in the patient stratification and that the predictive power of the radiomics score is certainly a result of the synergism achieved by combining them. However, the good predictive power of high TLG in the validation cohort is notable and can potentially be attributed to 2 issues: the first is that TLG is a combination of 2 traits (tumor size and SUVmean) that, additively, surpass the power of the single traits, and the second is that tumors with high TLG are larger tumors known to predict worse survival (42). It should also be noted that for generation of survival curves based on SUVmean, SUVmax, and TLG, we used an algorithm for optimal separation of patients to obtain the minimal P value, which potentially introduces a forced positive bias into the result. The PET label, however, is a selected group of radiomics features based on histologic MCT4 expression patterns, with no presumption on potential prognostic value. To provide the ultimate evidence that high MCT4 expression indeed underlies the high [18F]FDG signals, future studies with a larger, independent cohort of patients with available histologic material and [18F]FDG PET scans are warranted.
In addition to direct correlations, we observed cases that did not match MCT4-based patterns in [18F]FDG PET signatures, which urges us to consider some biologic and technical limitations of our approach. First, for the purpose of a histology-based imaging biomarker centered around glycolytic activity, we choose MCT4 expression, as MCT4 was previously shown to correlate with molecular subtypes and survival in PDAC (16). However, the roles and cellular allotment of MCT4 in the tumor microenvironment are complex, and other lactate transporters may also play a role in cancer (49,50) and contribute to glycolytic turnover. In PDAC, MCT1 expression has also been shown to have prognostic value (45), and it functions mainly as a lactate importer, expressed on oxidative cancer cells that potentially use lactate as fuel. Consequently, these oxidative cancer cells consume less glucose and hence present lower [18F]FDG uptake (49). In our cohort, MCT1 expression did not correlate with [18F]FDG uptake patterns. This also implies that glycolytic pancreatic cancer cells may outcompete oxidative pancreatic cancer cells. However, the initial selection of patients also included only patients with [18F]FDG uptake above the background level to delineate the tumor on PET images. Inclusion of such patients may have resulted in a preselection of those who had molecular subtypes of PDAC with higher glycolytic activity.
Second, the observed local variation in [18F]FDG uptake described in the PET-high/heterogeneous subgroup may illustrate the coexistence of PDAC cells that rely on both glycolysis and oxidative phosphorylation as a main energy source. Additionally, MCT4 not only may export lactate but also may be involved in transport of other metabolites, such as pyruvate and ketones (49,50–52). Therefore, MCT4 expression may reflect not only glycolysis but also, in part, activity of additional metabolic pathways present at the cellular level.
Last, when histology is linked to [18F]FDG uptake on PET, it should be noted that neither of these is tumor-cell–specific per se. MCT4 expression was also observed in stroma and in other noncancer cells, indicating active glycolysis in other cells as well. Also, [18F]FDG uptake along the pancreatic–biliary stent, which was present in 22 patients, or in obstructive pancreatitis distal from the tumor localization, demonstrates that [18F]FDG uptake and glucose metabolism are a part of non–cancer-related inflammatory processes as well (Supplemental Fig. 17). Together, these additional mechanisms may be present in patients whose [18F]FDG uptake pattern did not match the identified MCT4 patterns. Cross-modal image analysis pipelines are intrinsically impacted by differences in the specifications of imaging hardware. In this study, when linking the molecular markers on a cellular level to tissue-based measurements by PET, we encountered the problem of the low PET spatial resolution that results in loss of information on [18F]FDG PET and its extracted features. Variations in glucose metabolism in intratumoral subvoxel regions are averaged on PET but can be quantified on MCT4-based density maps. To match the PET images, we choose to compute features on MCT4 density maps at the lowest spatial resolution, which was 128 μm/pixel. Another consequence of the lower spatial resolution of PET is the challenging delineation of tumors, which may be located around organs with high background [18F]FDG uptake (aorta, liver, intestines, kidneys) or may be hard to discriminate from [18F]FDG uptake in adjacent abscesses, cysts, or lymph nodes. Although tumor delineation was based on 40% SUVmax isocontouring to maximize uniformity, it still required manual checking and correction before the final tumor volume was determined. Last, the developmental patient cohort consisted of tumors that were completely resected, thus being, in general, primary tumors of earlier T stage. For tumors with even smaller diameters, the spatial resolution of PET will be limiting and the presented MCT4-based [18F]FDG PET radiomics score is difficult to apply. However, smaller tumors do undergo surgery more often, and tissue is then available for direct analyses on MCT4 expression. Despite the technical difficulties, developing a noninvasive imaging biomarker of intratumoral metabolic heterogeneity is increasingly relevant to predict treatment efficacy in cancers in general (8–12) and for PDAC in particular (13,14). For example, stereotactic body radiation therapy for locally advanced or irresectable PDAC is emerging (53,54), indicating that our findings could be of particular interest to optimize radiation treatment plans (55,56). Moreover, the strong dependency of most cancers on glycolysis, also in the presence of sufficient oxygen, is increasingly used as a target for therapeutic interference (57), including selective blockade of monocarboxylate lactate transporters (58,59).
The general failure of PDAC clinical trials so far is mostly due to tissue heterogeneity and the resulting difficulty in choosing patients who would benefit from a selected therapy. By combining multiple pathomics and radiomics features and a whole-tumor view on both a pathologic and a radiologic level, we avoid reducing the tumor metabolic activity to a single value output, typically using SUVmax, leading to a descriptive statement of a tumor as being glycolytic or nonglycolytic. We support a view that combines multiple pathomics and radiomics features and can thus provide a better overview of the tumor’s heterogeneous appearance and biology.
We envisage that in the future the [18F]FDG PET radiomics features will be used not only to better predict patient survival but also to stratify patients for, for example, antimetabolic or glycolytic therapies. Furthermore, observations that we make here are potentially applicable to other cancer entities, especially those with a known high dependency on glycolysis (e.g., renal cancer and glioblastoma).
CONCLUSION
We envision that our approach to developing pathomics-based PET radiomics scores facilitates the adoption and implementation of PET imaging as a noninvasive biomarker to interrogate relevant aspects of tumor biology (28). The cross-modal image analysis pipeline developed in this study is among the first to use quantitative immunohistochemistry to link protein expression patterns to PET radiomics obtained in routine clinical practice.
DISCLOSURE
This study was supported the Radboud Oncologie Fonds/Stichting Bergh in het Zadel, partner of the Dutch Cancer Society (grant KUN2015-8106 and an institutional junior researcher grant to Erik Aarntzen), the Deutsche Forschungsgemeinschaft (405344257 [SI1549/3-2] and 421166016 [SI1549/4-1]), the German Federal Ministry of Education and Research (01KD2206A/SATURN3), the CANTAR research network of the Ministry of Culture and Science of the State of North Rhine-Westphalia, and the European Union Seventh Framework Program for Research, Technologic Development, and Demonstration (CAM-PaC grant 602783). Jens Siveke and Marija Trajkovic-Arsic are supported by the German Cancer Consortium. Jens Siveke receives honoraria as a consultant or for continuing medical education presentations from AstraZeneca, Bayer, Boehringer Ingelheim, Bristol-Myers Squibb, Immunocore, Merck Sharp & Dohme, Novartis, Roche/Genentech, and Servier. His institution receives research funding from Abalos Therapeutics, AstraZeneca, Boehringer Ingelheim, Bristol-Myers Squibb, Celgene, Eisbach Bio, and Roche/Genentech; he holds ownership and serves on the Board of Directors of Pharma15, all outside the submitted work. Francesco Ciompi was chair of the Scientific and Medical Advisory Board of TRIBVN Healthcare, France, and received advisory board fees from TRIBVN Healthcare, France, in the last 5 y. He is a shareholder of Aiosyn BV, the Netherlands. This article reflects the views of the authors, and Aiosyn BV is not liable for any use that may be made of the information contained herein. No other potential conflict of interest relevant to this article was reported.
KEY POINTS
QUESTION: Can quantitative immunohistochemistry provide ground to develop PET radiomics scores with a biologic rationale?
PERTINENT FINDINGS: We developed and validated a radiomics-based, automated approach to correlate histopathologic MCT4 expression analysis with [18F]FDG PET image features, allowing development of tissue-based radiomics scores that capture intratumoral glycolytic heterogeneity as a noninvasive means to identify a subset of PDAC patients with a poor prognosis.
IMPLICATIONS FOR PATIENT CARE: This cross-modal image analysis pipeline facilitates the adoption and implementation of PET imaging as a noninvasive biomarker to interrogate relevant aspects of tumor biology based on quantitative immunohistochemistry.
ACKNOWLEDGMENT
We thank Ine van Raaij for assisting with immunohistochemistry protocols.
Footnotes
- © 2024 by the Society of Nuclear Medicine and Molecular Imaging.
REFERENCES
- Received for publication July 1, 2023.
- Accepted for publication April 22, 2024.
In this issue


Jump to section
Related Articles
Cited By...
- No citing articles found.