


Abstract
Because of the high glucose metabolism in normal brain tissue 18F-FDG is not the ideal tracer for the detection of gliomas. Methyl-11C-l-methionine (11C-MET) is better suited for imaging the extent of gliomas, because it is transported specifically into tumors but only insignificantly into normal brain. 3′-Deoxy-3′-18F-fluorothymidine (18F-FLT) has been introduced as a proliferation marker in a variety of neoplasias and has promising potential for the detection of brain tumors, because its uptake in normal brain is low. Additionally, the longer half-life might permit differentiation between transport and intracellular phosphorylation. Methods: PET of 18F-FLT and 11C-MET was performed on 23 patients (age range, 20–70 y) with histologically verified gliomas of different grades. On all patients, conventional MRI was performed, and 16 patients additionally underwent contrast-enhanced imaging. Images were coregistered, and the volumes of abnormality were defined for PET and MRI. Uptake ratios and standardized uptake values (SUVs) of various tumors and regions were assessed by region-of-interest analysis. Kinetic modeling was performed on 14 patients for regional time–activity curves of 18F-FLT from tumorous and normal brain tissue. Results: Sensitivity for the detection of tumors was lower for 18F-FLT than for 11C-MET (78.3% vs. 91.3%), especially for low-grade astrocytomas. Tumor volumes detected by 18F-FLT and 11C-MET were larger than tumor regions displaying gadolinium enhancement (P < 0.01). Uptake ratios of 18F-FLT were higher than uptake ratios of 11C-MET (P < 0.01). Uptake ratios of 18F-FLT were higher in glioblastomas than in astrocytomas (P < 0.01). Absolute radiotracer uptake of 18F-FLT was low and significantly lower than that of 11C-MET (SUV, 1.3 ± 0.7 vs. 3.1 ± 1.0; P < 0.01). Some tumor regions were detected only by either 18F-FLT (7 patients) or 11C-MET (13 patients). Kinetic modeling revealed that 18F-FLT uptake in tumor tissue seems to be predominantly due to elevated transport and net influx. However, a moderate correlation was found between uptake ratio and phosphorylation rate k3 (r = 0.65 and P = 0.01 for grade II–IV gliomas; r = 0.76 and P < 0.01 for grade III–IV tumors). Conclusion: 18F-FLT is a promising tracer for the detection and characterization of primary central nervous system tumors and might help to differentiate between low- and high-grade gliomas. 18F-FLT uptake is mainly due to increased transport, but irreversible incorporation by phosphorylation might also contribute. In some tumors and tumor areas, 18F-FLT uptake is not related to 11C-MET uptake. In view of the high sensitivity and specificity of 11C-MET PET for imaging of gliomas, it cannot be excluded that 18F-FLT PET was false positive in these areas. However, the discrepancies observed for the various imaging modalities (18F-FLT and 11C-MET PET as well as gadolinium-enhanced MRI) yield complementary information on the activity and the extent of gliomas and might improve early evaluation of treatment effects, especially in patients with high-grade gliomas. Further studies are needed, including coregistered histology and kinetic analysis in patients undergoing chemotherapy.
Methyl-11C-l-methionine (11C-MET) and 18F-FDG are well-established markers in brain tumor diagnosis. Although the potential of 18F-FDG in the diagnosis of cortical gliomas is limited because of the hypo- or isometabolism of some tumors, 11C-MET has been shown to possess high specificity in tumor detection, tumor delineation, and differentiation of benign from malignant lesions (1). 11C-MET uptake, which seems to be caused by increased carrier-mediated transport rather than elevated protein synthesis, correlates with cell proliferation, in vitro Ki-67 expression, and proliferating cell nuclear antigen expression (2–4) as well as with microvessel density (5). Unfortunately, the short half-life of 11C (20 min) and the rapid catabolism of methionine in vivo limits kinetic modeling for this tracer.
Recently, Shields et al. have developed the new PET tracer, 3′-deoxy-3′-18F-fluorothymidine (18F-FLT), which allows for noninvasive assessment of tumor proliferation (6). In contrast to 18F-FDG and 11C-MET, which provide only an indirect measure of proliferation status, 18F-FLT allows the direct measurement of cellular thymidine kinase activity, which is proportional to the proliferative activity of the tumor, and early assessment of response to therapy. After phosphorylation by cellular thymidine kinase 1 (TK1), 18F-FLT nucleotides are trapped within the cell (7). Although in normal cells TK1 activity is increased by about 10-fold only during the DNA synthetic phase (8), in malignant cells the increase in TK1 activity is higher and permanent (9,10).
18F-FLT uptake has already been demonstrated in a variety of tumors such as lung cancer, colorectal carcinoma, malignant melanoma, and non-Hodgkin’s lymphoma (11–14). Several studies detected a strong correlation between the standardized uptake value (SUV) of 18F-FLT and the proliferative status in corresponding tumor samples (11,14). In cell culture experiments, 18F-FLT uptake correlated well with percentage of cells in S-phase and TK1 activity (15). Because uptake of 18F-FLT is low in intact brain tissue, 18F-FLT provides a low-background cerebral image and thus is considered to be an attractive PET tracer for the imaging of brain tumors.
The purpose of this prospective study was to clarify the role of 18F-FLT in the diagnosis of primary central nervous system tumors. We therefore compared the newly developed 18F-FLT PET with the routinely used 11C-MET PET and contrast-enhanced MRI to determine DNA metabolism and amino acid uptake as well as the integrity of the blood–brain barrier in patients with gliomas.
MATERIALS AND METHODS
Patients
Twenty-three patients with primary central nervous system tumors (11 men and 12 women; mean age, 47.1 ± 14.6 y; range, 20–70 y) were included in this prospective study after giving their informed consent. Diagnoses had been confirmed histologically according to World Health Organization (WHO) criteria in all patients before or after the PET examination. Tumor types and grades were distributed as follows: WHO grade I astrocytoma (n = 1); WHO grade II astrocytoma (n = 6); WHO grade II oligoastrocytoma (n = 2); WHO grade III astrocytoma (n = 4); WHO grade III oligodendroglioma (n = 1); WHO grade III oligoastrocytoma (n = 1); anaplastic ganglioglioma (n = 1); WHO grade IV glioblastoma (n = 6); and WHO grade IV medulloblastoma (n = 1). Because patients partly had received different therapy schemes before being included in the study, the WHO groups were divided into a treated subgroup (n = 15) and an untreated subgroup (n = 8). Individual clinical data are summarized in Table 1.
Characteristics of 22 Patients with Glioma and 1 Patient with Medulloblastoma
PET Studies
Data Acquisition.
PET imaging devices were an ECAT EXACT (CTI/Siemens; in-plane full width at half maximum, 6 mm; slice thickness, 3.375 mm; axial field of view, 162 mm) and an ECAT EXACT HR (CTI/Siemens; in-plane full width at half maximum, 3.6 mm; slice thickness, 3.125 mm; axial field of view, 150 mm). For attenuation correction, 10-min transmission scans with 3 rotating 68Ga/68Ge sources were obtained before tracer application.
All patients were examined using 11C-MET and 18F-FLT synthesized according to the method of Machulla et al. (16) and Wodarski et al. (17). The radiolabeling yield of 18F-FLT was 6.3% ± 1.3%, and the radiochemical purity of 18F-FLT was 98%.
After injection of 677.1 ± 148.0 MBq (range, 222–720 MBq) of 11C-MET, tracer accumulation was recorded over 60 min in 47 transaxial slices of the entire brain as described elsewhere (5).
The mean dose of 18F-FLT was 321.9 ± 85.1 MBq (range, 111–370 MBq). For kinetic analysis of 18F-FLT, arterialized blood samples were obtained from 14 patients using an intravenous catheter separate from that used for tracer injection. The hand of the patient was kept in a 40°C water bath from at least 10 min before the PET examination until the end of the examination to ensure sufficient arterial-venous shunting. The oxygenation status of a blood sample was measured before the start of the PET examination to ensure that oxygenation was greater than 85%. 18F-FLT PET images were acquired as a 90-min dynamic set comprising the following frame durations: 6 × 10 s, 3 × 20 s, 2 × 30 s, 2 × 60 s, 2 × 150 s, and 16 × 300 s.
To allow for coregistration of metabolic and anatomic data, digitally delivered T1- and T2-weighted MRI was performed on a 1.5-T system (Gyroscan Intera; Philips Medical Systems) for all patients. Contrast-enhanced T1-weighted MRI was performed on 16 of the 23 patients. Multitracer PET and MRI scans were completed within 6.3 ± 3.0 d (range, 2–13 d).
Data Analysis.
For 2 patients, the results of both 11C-MET PET and 18F-FLT PET were false negative, and these data were thus exempted from further analysis. Tumor volumes were defined in the remaining 21 and 14 patients for PET and contrast-enhanced MRI, respectively, using the 3D-Tool, which was developed in-house. The threshold for increased 11C-MET uptake was set to 1.3 (18), the threshold for increased 18F-FLT uptake was set to 2.0, and the threshold for positive contrast enhancement on MRI was determined by varying the lower value to match the area of positive enhancement on individual MRI scans. To all 3 imaging modalities, a component analyses was applied to extract areas of positive enhancement or tracer uptake outside the brain, such as high 11C-MET uptake in lacrimal or pituitary glands and high 18F-FLT uptake in bone and venous sinuses.
A region-of-interest (ROI) approach was used to compare tracer uptake in 11C-MET and 18F-FLT PET. To determine maximal tracer uptake, a circular ROI 8 mm in diameter was placed on the areas of highest 11C-MET and 18F-FLT uptake. For reference, a commensurate ROI was placed on the corresponding contralateral region or, if impossible because of the tumor location, on intact brain regions. Uptake ratios and SUVs were calculated as described elsewhere (5,19).
For further differentiation of 11C-MET, 18F-FLT, and gadolinium-diethylenetriaminepentaacetic acid (DTPA) uptake, detailed, irregularly shaped ROIs were placed on coregistered PET and available MRI scans where increased uptake of 18F-FLT alone, 11C-MET alone, gadolinium-DTPA alone, or a combination of any of these was observed. A circular ROI was placed on the nasal mucosa, being a rapidly dividing tissue with presumed high TK1 activity. Because of the variation in ROI size, reference ROIs were placed on intact gray and white matter to calculate the uptake ratios.
For kinetic analysis of 18F-FLT, time–activity curves were generated from circular regions placed over the tumor region with maximum tracer uptake. Because of low counts in intact brain tissue, reference ROIs were enlarged to the whole contralateral hemisphere to improve kinetic fitting. Time–activity curves obtained from 3 consecutive slices of the dynamic image set were analyzed by the PMOD biomedical image quantification and kinetic modeling software (PMOD Technologies Ltd.).
A three-compartment (4 rate constants) model was used to describe tracer kinetics. In this model, K1 and k2 are rate constants describing tracer influx and efflux from plasma to tissue, respectively. The metabolic rate constant k3 describes the phosphorylation rate of 18F-FLT by TK1. The dephosphorylation constant k4 was either set to zero (20,21) or also included into the fitting procedure. The net influx constant Ki of 18F-FLT into the respective regions was calculated as follows: Ki = K1 × k3/(k2 + k3). Additionally, blood volume was assessed in both tumor and reference regions.
Statistical Analysis
The Wilcoxon signed rank test, the Mann–Whitney rank sum test, and Spearman correlation analysis were used to assess the significance of any differences. Differences were considered statistically significant when P was <0.05.
RESULTS
Sensitivity of 18F-FLT PET in Detecting Gliomas Is Lower Than Sensitivity of 11C-MET PET
Of the 23 tumors studied, 21 (91.3%) were imaged by 11C-MET PET and 18 (78.3%) by 18F-FLT PET. Tumors that were false negative on 11C-MET PET (n = 2) also were false negative on 18F-FLT PET; thus, no tumors were detected by 18F-FLT PET only. Of the tumors that were false negative on 18F-FLT PET (n = 5), 1 exhibited slight contrast enhancement by MRI, 3 did not show contrast enhancement, and for 1 the diagnosis was made by 11C-MET PET, without an MRI examination (Table 2). Both tracers failed to detect WHO grade II astrocytomas; 18F-FLT PET additionally was false negative in 1 case of WHO grade III oligodendroglioma. All tumors showing positive contrast enhancement on MRI (n = 13) were depicted by 11C-MET PET, 1 of these patients had false-negative 18F-FLT uptake.
Results for 23 Patients Undergoing PET and MRI
These data indicate that, in this study, 18F-FLT PET was less sensitive than 11C-MET PET in detecting primary central nervous system tumors, especially WHO grade II astrocytomas.
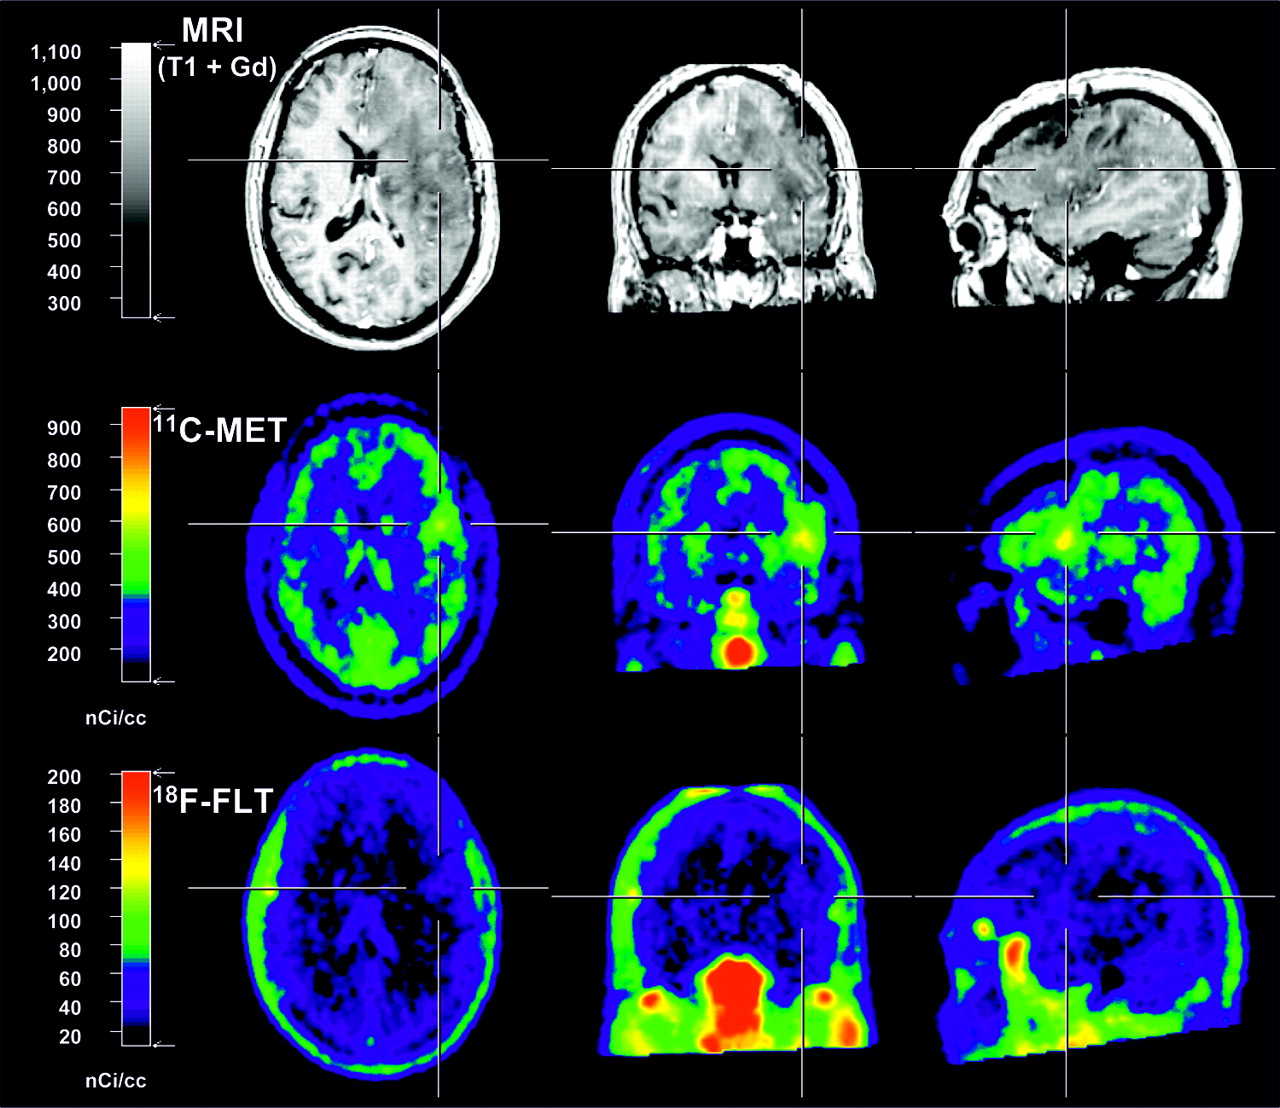
Figure 1 gives 2 examples of increased 18F-FLT uptake in regions of increased gadolinium uptake, with additional information on the true extent of the tumor given by 11C-MET PET. Figure 2 gives an example of a false-negative result on 18F-FLT PET. Figures 3 and 4 give examples of patients for whom complementary information on the activity and extent of the tumor could be obtained by 18F-FLT PET.

Two patients with highly intense 18F-FLT accumulation that was found mainly in areas of breakdown of blood–brain barrier as depicted by gadolinium-enhanced MRI. A 64-y-old man with newly diagnosed glioblastoma (A) and 26-y-old woman with newly diagnosed WHO grade I astrocytoma (B). In both patients, 11C-MET PET is suggestive of a larger extent of tumor as depicted by gadolinium MRI.
False-negative findings on 18F-FLT PET in 50-y-old woman with WHO grade II astrocytoma that had been resected at primary diagnosis. At a regular follow-up, MRI depicted signal changes within large parts of left hemisphere with only minor gadolinium enhancement (volume, 1.2 cm3) and area of mildly increased 11C-MET uptake (volume, 5.7 cm3; factor, 1.6). Mucosa and cranial bone marrow show intense 18F-FLT uptake, whereas 18F-FLT background in normal brain is low.

Two examples of complementary information on activity and extent of tumor as depicted by multimodal imaging. (A) A 49-y-old woman with recurrent glioblastoma that had been treated by operation, radiation, and 5 cycles of temozolomide. 18F-FLT seems to depict some extension of tumor toward internal capsule and thalamus that was not clearly depicted by gadolinium MRI and 11C-MET PET. Contours on MRI depict tumor extent as measured by 18F-FLT PET; contours on 11C-MET and 18F-FLT PET depict tumor extent as measured by gadolinium enhancement. (B) A 58-y-old woman with WHO grade III ganglioglioma. High tumor activity is depicted by high 18F-FLT uptake (uptake ratio, 13.0; SUV, 3.0), which exceeds involvement shown by gadolinium enhancement to lateral side (volume, 40 cm3 vs. 14.4 cm3). 11C-MET PET shows even further extension of tumor toward pole of temporal lobe. Contours on MRI depict tumor extent as measured by 18F-FLT PET; contours on 18F-FLT PET depict tumor extent as measured by gadolinium enhancement.
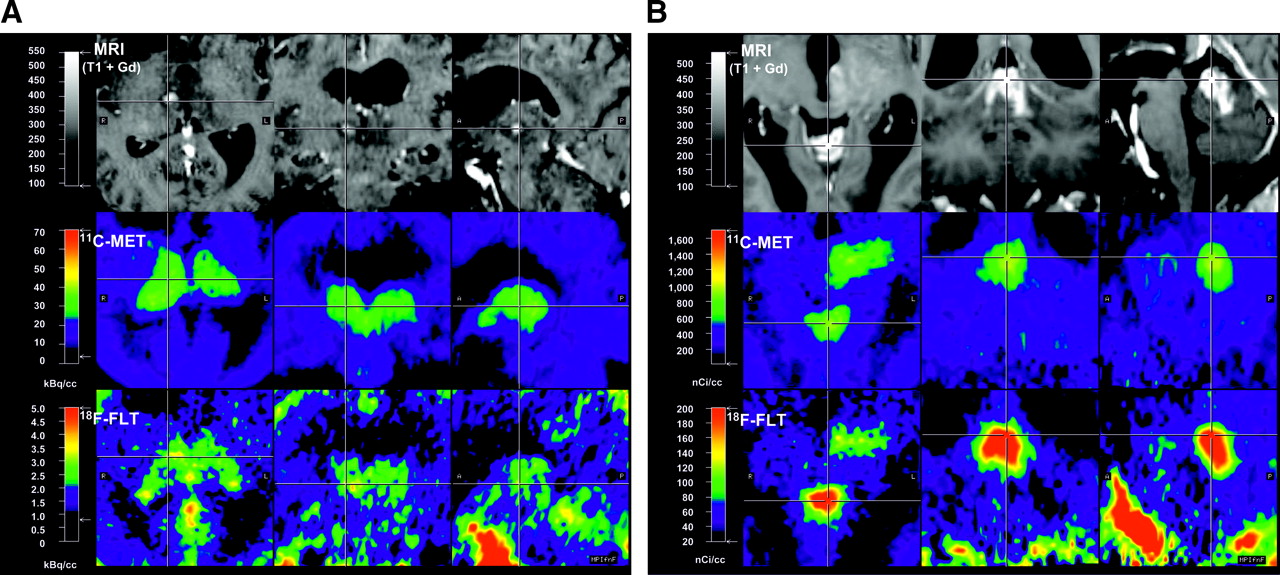
Complementary information on tumor activity and extent as depicted by multimodal imaging in 2 patients with tumors near midline. (A) A 57-y-old woman with recurrent WHO grade III oligoastrocytoma in thalamus. Whereas area of gadolinium enhancement is small, 11C-MET and 18F-FLT PET are suggestive of gross involvement of thalami on both sides. (B) A 39-y-old woman with recurrent astrocytoma within vermis and extension into midbrain and thalamus. Gadolinium enhancement is mainly restricted to vermis, whereas 11C-MET and 18F-FLT uptake show clear involvement of left-sided midbrain and thalamus.
Tumor Volumes Defined by 18F-FLT PET and 11C-MET PET Are Larger Than Blood–Brain Barrier Breakdown Detected by Gadolinium-Enhanced MRI
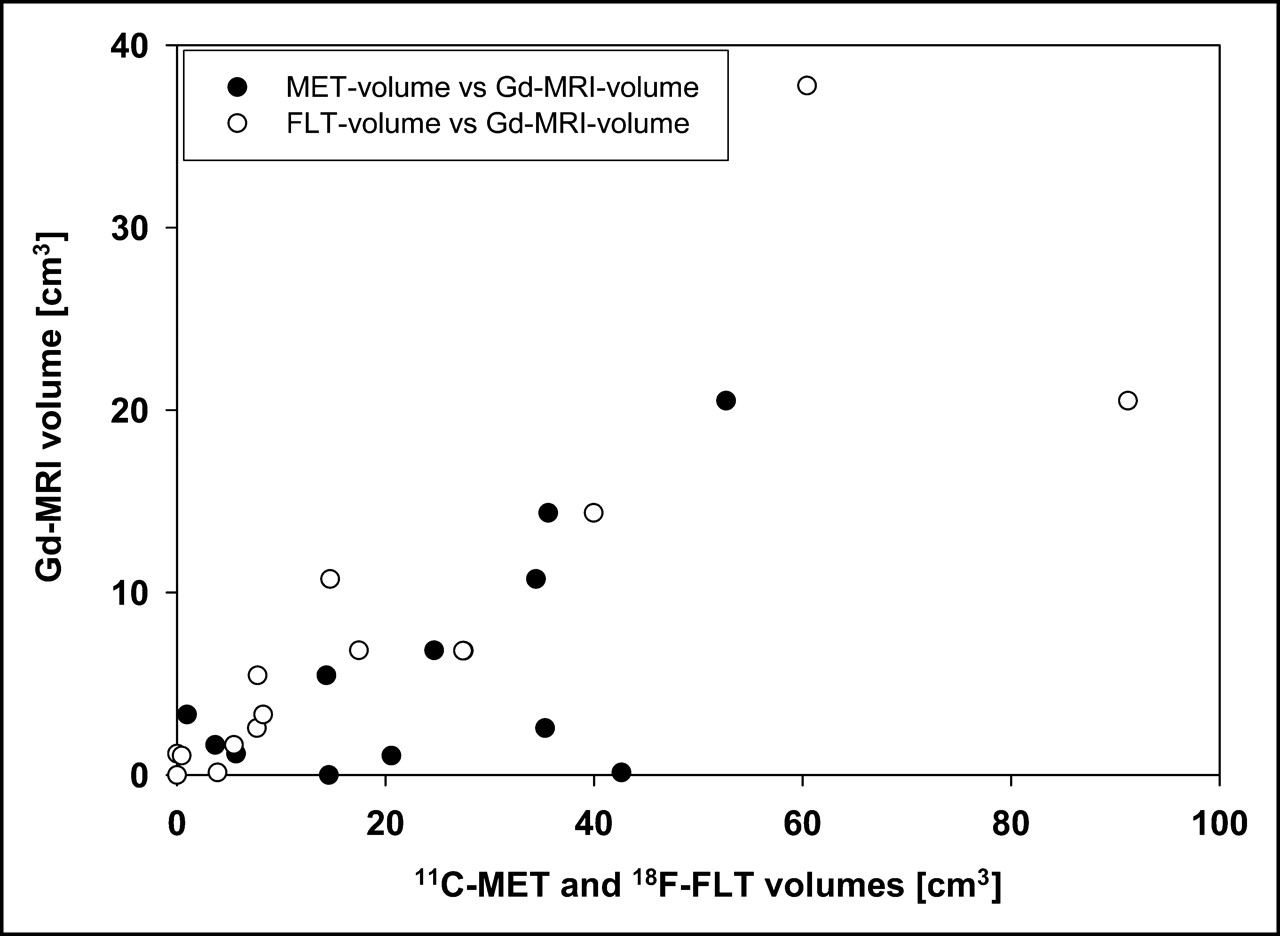
The mean tumor volumes as measured with the 3D-Tool were 27.1 ± 17.6 cm3 in 11C-MET PET, 18.9 ± 24.2 cm3 in 18F-FLT PET, and 8.0 ± 10.4 cm3 in gadolinium-positive MRI. Individual tumor volumes are depicted in Table 2. In 11 of 16 patients, tumor volumes as measured by 18F-FLT PET, ranging from a factor of 1.4 to 29.9 (mean, 4.4), were greater than tumor volumes as measured by gadolinium-enhanced MRI. Examples are given in Figures 3 and 4. In 12 of 16 patients, tumor volumes as measured by 11C-MET PET, ranging from a factor of 1.4 to 327.8 (mean, 29.9), were greater than tumor volumes as measured by gadolinium-enhanced MRI (Table 2). In only 1 patient each was the tumor volume as measured by 11C-MET or 18F-FLT PET smaller than the tumor volume as measured by gadolinium-enhanced MRI. Normalized tumor volumes (FLT/gadolinium and MET/gadolinium) are also depicted in Table 2. As expected, tumor volumes on gadolinium-positive MRI were significantly smaller than those on 11C-MET and 18F-FLT PET (Wilcoxon, P < 0.01). There was a positive correlation between tumor volumes as measured by PET and tumor volumes as measured by MRI (Wilcoxon, P < 0.01). The relationship between tumor volumes as measured by 11C-MET PET and 18F-FLT PET in comparison with gadolinium-enhanced MRI is depicted in Figure 5.

Relationship between tumor volumes as measured by gadolinium-enhanced MRI in comparison to 11C-MET PET (•) and 18F-FLT PET (○). In most cases, tumor is larger when measured by PET than when measured by MRI.
These data indicate that both 18F-FLT PET and 11C-MET PET can detect tumor regions that are not detected by gadolinium-enhanced MRI.
For 18F-FLT PET, Uptake Ratio Is Higher and SUVs Are Lower Than Those for 11C-MET PET
Normal cerebral distribution of 18F-FLT is characterized by low background activity in intact brain (Figs. 1 and 2) and significant accumulation within tumor, cranial bone marrow (Figs. 1 and 2), and venous sinuses (Fig. 1B).
Uptake ratios and SUVs were calculated from ROIs placed over the area with maximum tracer uptake, and data are summarized in Table 2. A positive correlation was found between the uptake ratios of 11C-MET and 18F-FLT in the entire patient group (Spearman r = 0.72, P < 0.001), indicating the relationship between increased uptake and transport rates of amino acids and nucleosides into the tumor. The average uptake ratio of 18F-FLT was significantly higher than the average uptake ratio of 11C-MET in the entire patient group (4.9 ± 3.0 vs. 2.3 ± 0.8, P < 0.01 [Wilcoxon]), probably because of the low background activity of 18F-FLT in intact brain relative to tumor tissue. Furthermore, the uptake ratio of 18F-FLT was significantly higher in glioblastomas (n = 6) than in astrocytomas (n = 9) (6.9 ± 1.9 vs. 3.0 ± 1.4, P < 0.01 [Mann–Whitney]). Although no further statistical analysis was performed because of the low numbers in treated and untreated subgroups, these preliminary data already point to a relationship between 18F-FLT uptake and histologic grade and tumor type. The absolute uptake of 18F-FLT was relatively low, with the average SUV for 18F-FLT being significantly lower than the average SUV for 11C-MET (1.3 ± 0.7 vs. 3.1 ± 1.0, P < 0.01; Table 2).
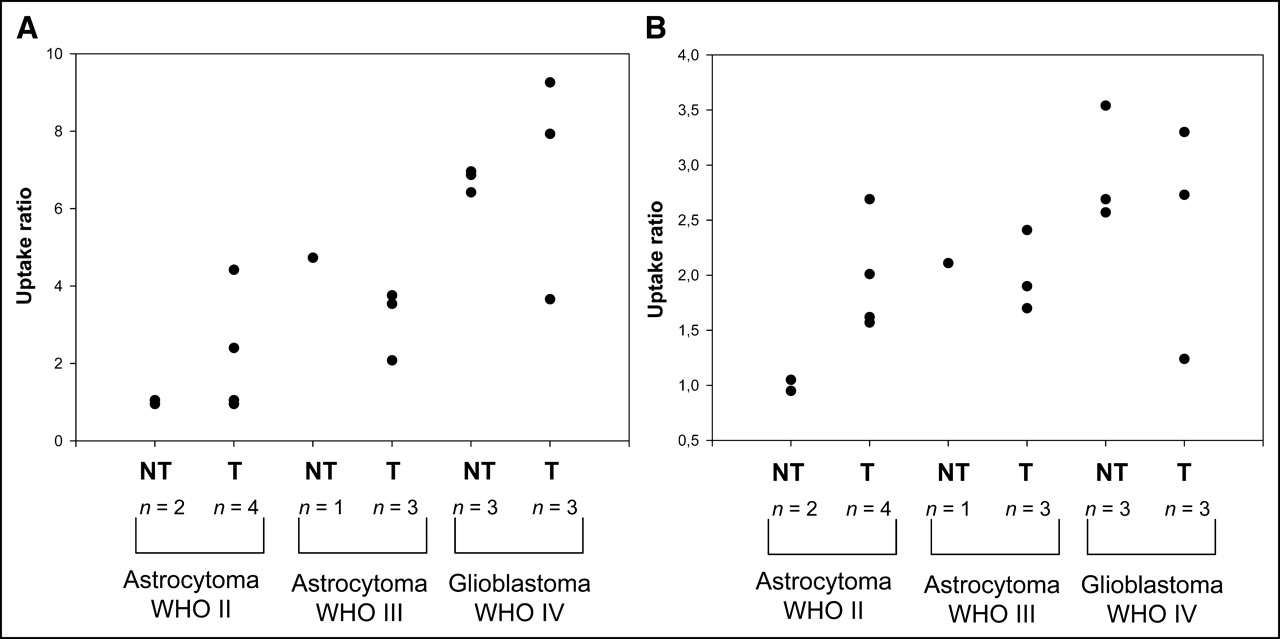
Figure 6 gives an overview of average uptake ratios in treated and untreated astrocytoma and glioblastoma patients for 18F-FLT and 11C-MET PET.

Comparison of uptake ratios for 18F-FLT (A) and 11C-MET (B) in treated and untreated astrocytomas and glioblastomas. Uptake ratios of untreated tumors tend to increase with WHO grade. Uptake ratios vary more in treated tumors, most probably because of tissue alterations in response to therapy. NT = no therapy before study inclusion; T = therapy before study inclusion.
Large Parts of Tumors Are Detected by Both 18F-FLT and 11C-MET PET, but Additional Tumor Regions Are Discovered Separately by Each Tracer
For detailed ROI analysis, tumors were segmented into regions with increased tracer uptake of 18F-FLT alone, 11C-MET alone, gadolinium-DTPA alone, or a combination of these using irregularly shaped ROIs. Because of differences in ROI size, the average of the ROIs placed over intact gray and white matter was used as the reference region. For comparison of tumor regions with known highly proliferative tissue, a circular ROI was placed on the nasal mucosa. Uptake ratios for detailed ROIs were then calculated as already described.
High proliferative activity in the nasal mucosa was reflected in a significantly higher uptake ratio for 18F-FLT than for 11C-MET (P < 0.001 [Wilcoxon]).
A mean of 2.4 ± 1.0 (range, 1–4) different ROIs were defined in the tumor tissue of 21 patients, and a total of 50 ROIs were evaluated. Regions positive for both PET tracers were identified in most tumors (gadolinium, 18F-FLT, and 11C-MET: n = 11; 18F-FLT and 11C-MET: n = 12). In these regions, the uptake ratios for 18F-FLT were significantly higher than those for 11C-MET (P < 0.01 [Wilcoxon]; gadolinium, 18F-FLT, and 11C-MET: 5.8 ± 3.0 vs. 2.3 ± 0.8; 18F-FLT and 11C-MET: 4.0 ± 2.0 vs. 2.3 ± 0.7). In 13 patients, circumscribed tumor regions were detected by 11C-MET PET only. As expected in these ROIs, uptake ratios for 11C-MET were significantly higher than those for 18F-FLT (2.0 ± 0.4 vs. 1.6 ± 0.4, P < 0.01 [Wilcoxon]). In 7 patients, certain tumor regions were positive on 18F-FLT PET only (3.4 ± 1.4 vs. 1.1 ± 0.3, P < 0.05 [Wilcoxon]). In the ROIs for gadolinium (n = 1) and gadolinium-18F-FLT (n = 2), as well as in tumor necrosis (n = 4), uptake ratios for 18F-FLT and 11C-MET were not significantly different, most probably because of low sample numbers.
These data indicate that 18F-FLT and 11C-MET detect mainly the same tumor regions, although there are regions detectable only by either 18F-FLT or 11C-MET (Figs. 3 and 4). Furthermore, the presence of regions positive for the respective PET tracer but not showing gadolinium enhancement implies that both 18F-FLT and 11C-MET can detect tumor regions that do not present with gross destruction of the blood–brain barrier as shown by gadolinium-enhanced MRI.
18F-FLT Uptake in Tumor Seems to Be Due to High Transport and Net Influx but Correlates with Phosphorylation Rate by TK1
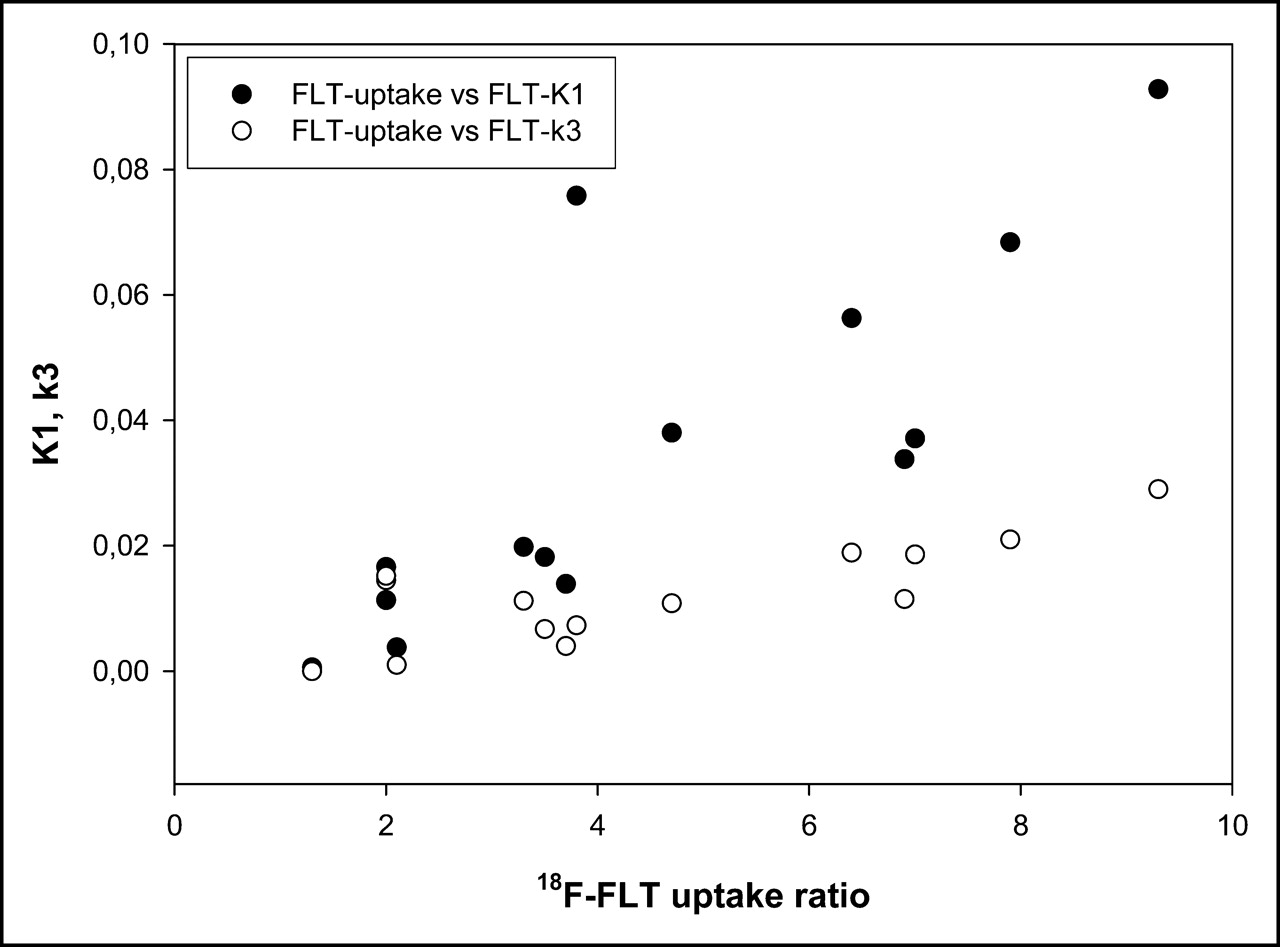
A representative example of the kinetic analysis is given in Figure 7. 18F-FLT-derived radioactivity in the tumor region peaks in the first 2 min and declines rapidly in the next 5 min, thereafter staying at constant levels (Fig. 7A) that are higher than the radioactivity levels in blood (Fig. 7B) and in the contralateral control region (Fig. 7C). In the kinetic analysis, the 3-compartment model provided a significantly better fit of the data than did the 2-compartment model. Tumor regions were significantly different from the reference region in blood volume, most probably because of higher vascularization of tumor tissue (Tables 3 and 4). Furthermore, Ki and K1 differed significantly, indicative of a higher transport and net influx of 18F-FLT into tumor tissue. Kinetic analysis revealed no significant differences in k3 between tumor and normal brain (Tables 3 and 4). Kinetic analysis including a k4 revealed a significant difference between tumor and control region, suggesting that a significant amount of 18F-FLT would not be trapped in the tissue (Table 4). There was a good correlation between the net influx (Ki) and the uptake ratio of 18F-FLT in tumor tissue (Spearman r = 0.88, P < 0.001) and a weaker correlation between the rate constants K1 and k3 and the uptake ratio of 18F-FLT in tumor tissue (K1: Spearman r = 0.85, P < 0.001; k3: Spearman r = 0.65, P = 0.011; Fig. 8). Restriction to grade III and IV gliomas (n = 11) revealed a stronger correlation between k3 and 18F-FLT uptake ratio (Spearman r = 0.76, P < 0.01). Multiple-regression analysis revealed that K1 and k3 are 2 independent factors predicting 18F-FLT uptake (K1: P < 0.01; k3: P < 0.05). The relationship between K1 and k3 and 18F-FLT uptake is shown in Figure 8. These data point to the relevance of increased transport and net influx of 18F-FLT into tumor tissue but do not exclude the mechanism of increased phosphorylation of 18F-FLT by TK1, as indicated by tumor-to-blood ratios significantly higher than those 15 min and later after tracer application and by the correlation between the uptake ratio for 18F-FLT and the metabolic rate constant k3 in tumor tissue.
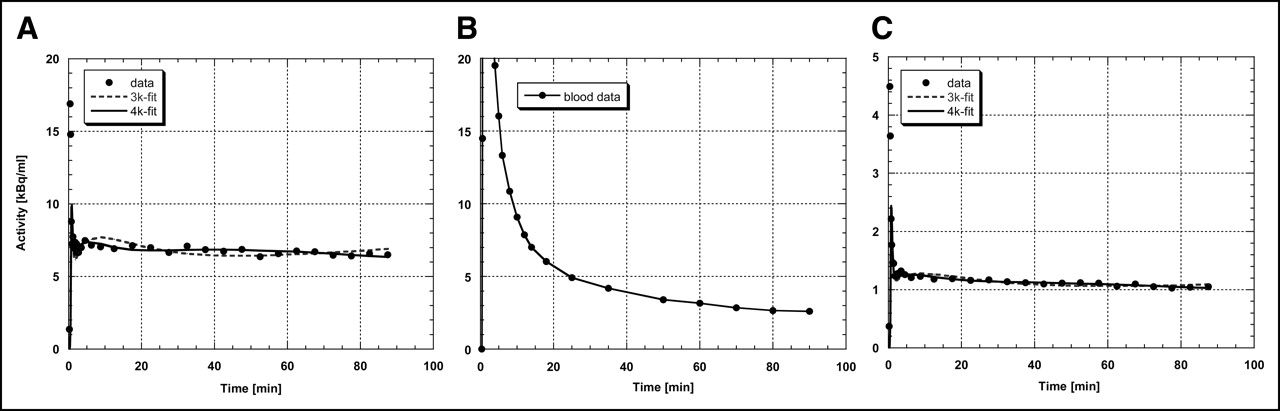
Representative measured and fitted time–activity curves from patient 7 (Figs. 1A and Tables 3 and 4). (A) Time–activity curve from tumor region with increased 18F-FLT uptake; simple mean reduced χ2 value for fit without k4 is 241.1 and with k4 is 250.6. (B) Time–activity curve from blood. (C) Time–activity curve from contralateral control region; simple mean reduced χ2 value for fit without k4 is 130.3 and with k4 is 134.9. Fifteen minutes or more after radiotracer administration, tumor-to-blood ratio is significantly higher than 1, supporting hypothesis that 18F-FLT uptake is at least partly determined by 18F-FLT trapping and TK1 activity.

Correlation of K1 and k3 with 18F-FLT uptake ratio. Spearman rank correlation coefficients are r = 0.85 for K1 (P < 0.001) and r = 0.65 for k3 (P = 0.011).
For 14 Patients, Individual Data Obtained by Kinetic Analysis with Fixed k4 of 0
For 14 Patients, Individual Data Obtained by Kinetic Analysis Including k4
Tables 3 and 4 give the individual data of the kinetic analysis obtained from the tumor and reference regions of 14 patients with and without inclusion of k4.
DISCUSSION
To our knowledge, this is the first clinical study to include kinetic modeling in a systematic comparison of 18F-FLT PET with 11C-MET PET in human gliomas. We demonstrate, first, that absolute uptake of 18F-FLT is lower than that of 11C-MET (SUV, 1.3 ± 0.7 vs. 3.1 ± 1.0) and that the uptake ratios for tumor to normal brain are higher (4.9 ± 3.0 vs. 2.3 ± 0.8) because of the low uptake of 18F-FLT in normal brain; second, that sensitivity for the detection of tumor is lower for 18F-FLT than for 11C-MET (78.3% vs. 91.3%), especially in low-grade gliomas; third, that in individual patients, 18F-FLT, 11C-MET PET, and gadolinium-enhanced MRI give complementary information on the true extent of the tumor; fourth, that 18F-FLT is taken up predominantly in tumor regions with a disrupted blood–brain barrier; and fifth, that a variable combination of different processes, such as increased transport and phosphorylation and blood–brain barrier disruption, leads to 18F-FLT accumulation.
For the management of malignant gliomas, it is of the utmost importance to detect those areas where the tumor progresses into the neighboring tissue, because recurrence of the tumor—and the fate of the patient—highly depends on the extent and activity of this proliferation zone. This area should therefore be the main target of invasive diagnostic and therapeutic strategies. Often, these regions cannot be clearly distinguished from edema or necrosis by morphologic imaging modalities such as CT or MRI, and they may escape detection by 18F-FDG PET because of the high-energy metabolism of normal gray matter obscuring subtle increases of 18F-FDG uptake in tumorous tissue with low cellular density (22). 11C-MET therefore has been introduced to better delineate the extent of gliomas because its selective transport into tumorous tissue results in a high contrast to normal brain where uptake of this tracer is low. However, the short half-life of this tracer does not permit evaluation of protein synthesis, and therefore, the increased uptake is probably related more to microvessel density (5) than to cellular proliferation. Labeled nucleotides, such as tritiated thymidine, have been widely used in experimental models to quantitate tumor DNA synthesis (23). Moreover, 11C-thymidine was shown to be especially useful as an imaging agent for determining tumor proliferation (24), but the short half-life and the necessary complex analysis of data due to large amounts of labeled molecules limited the application of this tracer in the clinical workup of patients with brain tumors. With 18F-FLT, a tracer was introduced (6) that has a half-life well suited for clinical application. Additionally, trapping of the product phosphorylated by thymidine kinase, the target enzyme, permits the analysis of accumulation kinetics in a 3-compartment model. The high correlation to thymidine uptake suggests that 18F-FLT accumulation is a reliable measure of the salvage pathway of DNA synthesis (15,25). As a consequence, this compound has found many applications in oncology (26) and, despite some limitations, is widely accepted as a marker for tumor cell proliferation. However, despite the advantage of a low uptake of 18F-FLT in normal brain, only a few studies on brain tumors have been reported.
The most detailed analysis so far was one recently reported on 25 patients with newly diagnosed (n = 7) or previously treated (n = 18) glioma. The study used 18F-FLT and 18F-FDG PET, as well as Ki-67 staining in a subgroup of patients (27). This study showed a rapid 18F-FLT uptake, peaking at 5–10 min after application and remaining stable up to 75 min; excellent delineation of WHO grades III and IV tumors, with low absolute uptake (mean SUV, 1.33) but excellent image contrast (tumor-to-normal ratio, 3.85); no appreciable 18F-FLT uptake in WHO grade II gliomas and stable lesions; and a high correlation of 18F-FLT SUV with Ki-67 expression as an indication that 18F-FLT is a surrogate marker for tumor proliferation in high-grade gliomas (27). Our results are in accordance with the findings of Chen et al. (27) with regard to low SUV, low uptake in normal brain, and resulting high tumor-to-normal ratios. Moreover, our study, in being the first to compare 18F-FLT uptake with 11C-MET uptake, apply kinetic analysis to the 3-compartment model of 18F-FLT uptake in a larger group of patients with various gliomas, and differentiate between transport and increased tracer retention associated with tumor proliferation, extends these findings. Our results also extend previous findings with 2-11C-thymidine applying sequential 11C-CO2 and 11C-thymidine scans and analysis of filtered data in a 5-compartment model (24,28). Two types of tissue compartments could be identified by the 3 imaging parameters: tissue compartments with elevated gadolinium enhancement, elevated 11C-MET uptake, and elevated 18F-FLT uptake (here, disruption of the blood–brain barrier is the most likely cause of 11C-MET and 18F-FLT uptake) and tissue compartments with positive 11C-MET and 18F-FLT uptake and without obvious disruption of the blood–brain barrier, at least not as depicted by gadolinium-enhanced MRI (here, 18F-FLT and 11C-MET uptake is most likely due to increased transport of nucleosides and amino acids into the tumor). The facts that k2 is not significantly different between tumor and control regions and that k3 correlates with FLT uptake suggests that phosphorylation and trapping also play a role in 18F-FLT uptake. In summary, the regional distribution of 18F-FLT uptake with and without positive contrast enhancement on MRI and with and without accumulation of 11C-MET suggests the presence of various tissue compartments in which 18F-FLT accumulation is due to the breakdown of the blood–brain barrier, increased transport, increased proliferation, or a variable combination of these components.
In all positive tumors, the gadolinium-enhanced volumes on MRI were smaller than the volumes with significantly increased accumulation of 18F-FLT or 11C-MET, indicating an increased transport of these tracers into active tumorous tissue even before the blood–brain barrier breaks down substantially. Because the transport characteristics of fluorinated nucleosides would not lead one to expect a substantial uptake without a disrupted blood–brain barrier, our findings might also suggest 18F-FLT as the more sensitive marker for blood–brain barrier disruption, and it may well be that subtle blood–brain barrier leakage is not depicted as gadolinium enhancement and 3-dimensional volumetry. Nevertheless, for both tracers a correlation between the increased transport and the proliferation rate has been demonstrated (2–4,6,28). Because k3 showed no statistically significant difference between tumor and control region, our data do not permit the clear conclusion that 18F-FLT accumulates significantly in gliomas as a consequence of phosphorylation and irreversible trapping in proliferating cells. With k3 values significantly greater than zero in the control region, our data may even suggest Ki as the more robust parameter, in which case the normal brain is very low. However, because we observed a significant correlation between the uptake ratio of 18F-FLT and the metabolic rate constants K1 and k3 (Fig. 8), these data indicate that FLT uptake is due to a combination of factors, including increased transport and phosphorylation. Including a k4 in our analysis minimally altered the goodness of fit (Fig. 7), but whether k4 plays a substantial role is unresolved and deserves further investigation.
In some tumor regions, 18F-FLT does not accumulate despite increased uptake of 11C-MET. This discrepancy might be due to the selectivity of thymidine kinase as the target of 18F-FLT for the salvage pathway of DNA synthesis (15,25,29). In tumor cell lines using de novo DNA synthesis, the proliferation rate might be underestimated by this tracer (30). The fact that this patient population was heterogeneous, with 9 of 23 patients pretreated by radiation therapy, might have had some influence on the state of the blood–brain barrier with subsequent alteration of 18F-FLT uptake.
CONCLUSION
This study demonstrated that 18F-FLT is a promising tracer for the detection and characterization of brain tumors. Compared with 18F-FDG, 18F-FLT has the advantage of high uptake in tumors in relation to the low background in normal brain tissue. Compared with 11C-MET, the longer half-life of 18F-FLT permits the follow-up of increased transport into tumor cells. Our preliminary data in a relatively small and heterogeneous patient population do not support the clear conclusion that analysis of glioma cell proliferation, which is the target for evaluation of early treatment effects in humans, is possible. However, the study indicated that 18F-FLT uptake differentiates low-grade from high-grade gliomas; that 18F-FLT uptake is due to a combination of factors, including increased transport and phosphorylation; and that 18F-FLT PET might provide information on the extent and activity of a glioma additional to that provided by MRI and 11C-MET. Further studies might find feasible the determination of typical signatures of various brain tumors and the assessment of the value of 18F-FLT as a tracer for early evaluation of treatment effects in patients with gliomas.
Acknowledgments
This work was supported in part by the Deutsche Forschungsgemeinschaft (DFG-Ja98/1-2); Ministerium für Schule, Wissenschaft und Forschung NRW (MSWF 516-40000299); Center for Molecular Medicine Cologne (CMMC-TV46); Max-Planck Society; and 6th FW EU grant EMIL (LSHC-CT-2004-503569).
Footnotes
Received Jan. 20, 2005; revision accepted Aug. 19, 2005.
For correspondence or reprints contact: Andreas H. Jacobs, MD, Laboratory for Gene Therapy and Molecular Imaging, MPI for Neurological Research, Gleuelerstrasse 50, 50931 Cologne, Germany.
E-mail: Andreas.Jacobs{at}pet.mpin-koeln.mpg.de
Andreas H. Jacobs and Anne Thomas contributed equally to this work.
REFERENCES
In this issue


Jump to section
Related Articles
Cited By...
- Simultaneous Mapping of Vasculature, Hypoxia, and Proliferation Using Dynamic Susceptibility Contrast MRI, 18F-FMISO PET, and 18F-FLT PET in Relation to Contrast Enhancement in Newly Diagnosed Glioblastoma
- Head-to-Head Comparison of 11C-PBR28 and 18F-GE180 for Quantification of the Translocator Protein in the Human Brain
- Repeatability of 18F-FLT PET in a Multicenter Study of Patients with High-Grade Glioma
- The Role of PET [18F]FDOPA in Evaluating Low-grade Glioma
- PET Findings of Intramedullary Tumors of the Spinal Cord Using [18F] FDG and [11C] Methionine
- Correlation of MRI-Derived Apparent Diffusion Coefficients in Newly Diagnosed Gliomas with [18F]-Fluoro-L-Dopa PET: What Are We Really Measuring with Minimum ADC?
- Correlation of 18F-FLT Uptake with Tumor Grade and Ki-67 Immunohistochemistry in Patients with Newly Diagnosed and Recurrent Gliomas
- Analysis of the Growth Dynamics of Angiogenesis-Dependent and -Independent Experimental Glioblastomas by Multimodal Small-Animal PET and MRI
- Concurrent Temozolomide and Dose-Escalated Intensity-Modulated Radiation Therapy in Newly Diagnosed Glioblastoma
- 3'-Deoxy-3'-18F-Fluorothymidine PET and MRI for Early Survival Predictions in Patients with Recurrent Malignant Glioma Treated with Bevacizumab
- Imaging biomarkers of brain tumour margin and tumour invasion
- Specific biomarkers of receptors, pathways of inhibition and targeted therapies: clinical applications
- Discriminant Analysis of 18F-Fluorothymidine Kinetic Parameters to Predict Survival in Patients with Recurrent High-Grade Glioma
- Multimodality Assessment of Brain Tumors and Tumor Recurrence
- Tumor 3'-Deoxy-3'-18F-Fluorothymidine (18F-FLT) Uptake by PET Correlates with Thymidine Kinase 1 Expression: Static and Kinetic Analysis of 18F-FLT PET Studies in Lung Tumors
- Correlation of 6-18F-Fluoro-L-Dopa PET Uptake with Proliferation and Tumor Grade in Newly Diagnosed and Recurrent Gliomas
- Kinetics of 3'-Deoxy-3'-18F-Fluorothymidine During Treatment Monitoring of Recurrent High-Grade Glioma
- Switching on the Lights for Real-Time Multimodality Tumor Neuroimaging: The Integrated Positron-Emission Tomography/MR Imaging System
- Kinetic Modeling of 3'-Deoxy-3'-18F-Fluorothymidine for Quantitative Cell Proliferation Imaging in Subcutaneous Tumor Models in Mice
- First Demonstration of Leukemia Imaging with the Proliferation Marker 18F-Fluorodeoxythymidine
- Imaging of Cell Proliferation: Status and Prospects
- Glioma Proliferation as Assessed by 3'-Fluoro-3'-Deoxy-L-Thymidine Positron Emission Tomography in Patients with Newly Diagnosed High-Grade Glioma
- Dynamic Small-Animal PET Imaging of Tumor Proliferation with 3'-Deoxy-3'-18F-Fluorothymidine in a Genetically Engineered Mouse Model of High-Grade Gliomas
- Predicting Treatment Response of Malignant Gliomas to Bevacizumab and Irinotecan by Imaging Proliferation With [18F] Fluorothymidine Positron Emission Tomography: A Pilot Study
- Clinical Applications of PET in Brain Tumors
- Imaging-Guided Gene Therapy of Experimental Gliomas
- Kinetic Analysis of 3'-Deoxy-3'-18F-Fluorothymidine in Patients with Gliomas