


Abstract
Locally advanced breast cancer (LABC) is commonly treated with neoadjuvant chemotherapy followed by definitive surgery. The factors influencing the response of LABC to presurgical chemotherapy are incompletely understood. To characterize in vivo tumor biology in patients with LABC, we measured pretherapy blood flow and glucose metabolism in LABC, compared measurements with clinical and pathologic parameters, and examined blood flow and response to subsequent neoadjuvant chemotherapy. Methods: Thirty-seven patients with newly diagnosed LABC underwent 18F-FDG and 15O-water PET imaging. Thirty-one of these patients underwent neoadjuvant chemotherapy, and response was evaluated by serial measurements of tumor size and pathologic examination after definitive surgery after chemotherapy. Tumor metabolism was estimated from graphic analysis of dynamic 18F-FDG studies and was expressed as the metabolic rate of 18F-FDG (MRFDG). Blood flow was estimated from dynamic images after bolus 15O-water injection using a 1-compartment model. Tumor blood flow and metabolism were compared with clinical and pathologic parameters and with response to chemotherapy. Results: Both blood flow and metabolism were significantly higher in tumor than in normal breast. Tumor blood flow and metabolism were correlated but highly variable. There were weak associations of metabolism with patient age and tumor grade and of blood flow with estrogen receptor status. There was a statistically significant trend for patients with a high MRFDG to have a poorer response to therapy (P = 0.001). Response was not significantly correlated with any other parameters. A low ratio of MRFDG to blood flow was the best predictor of macroscopic complete response (CR) (P = 0.02 vs. non-CR). Preliminary analysis of patient follow-up showed the ratio of MRFDG to blood flow to also be predictive of disease-free survival. Conclusion: Despite uniformly large tumor size, blood flow and metabolism in LABC are highly variable. High glucose metabolism predicts a poor response to neoadjuvant chemotherapy, and low MRFDG relative to blood flow is a predictor of CR. Further work is needed to elucidate the biologic mechanisms underlying these findings.
Breast cancer that is greater than 5 cm in diameter, invades the chest wall or skin, has fixed lymph node metastases, or is inflammatory is defined as locally advanced breast cancer (LABC) (1,2). Current approaches to the treatment of these types of breast cancer include chemotherapy given before definitive surgical therapy, termed neoadjuvant, primary, or induction chemotherapy (3). Induction chemotherapy, because it offers the possibility of breast-conserving surgery rather than mastectomy, has also been applied to the treatment of lower-stage breast cancer. Although recent trials reported clinical response rates > 70%, a small fraction of patients achieves a complete macroscopic response to therapy, defined as an absence of gross viable tumor at definitive surgery after therapy (4,5). However, patients who achieve a macroscopic complete response (CR) have a significantly better prognosis than patients left with residual tumor at the end of chemotherapy (5,6). Despite the development of new techniques to characterize the biologic features of breast tumors, the factors influencing the quality of response to therapy remain obscure. Biologic markers have shown an ability to predict breast cancer response to particular forms of therapy (7–9); however, the literature about such markers in LABC is sparse.
One of the factors that may influence response to systemic chemotherapy is tumor perfusion (10,11). Prior studies of large breast tumors using a variety of techniques, including histologic analysis of vessel density (12), PET with 15O-water (13), dynamic contrast-enhanced MRI (14,15), single-photon imaging with 99mTc-sestamibi (16,17), and Doppler sonography (18), all suggest that blood flow in LABC is quite variable. Tumors with relatively poor perfusion may not receive adequate delivery of systemic therapy. This lack may be a factor in poor response to intravenous chemotherapy (11). Furthermore, underperfused tumors may be hypoxic (19). Hypoxia has been implicated in the induction of biologic features associated with aggressive behavior and poor response to various forms of chemotherapy (20). We performed quantitative PET studies to estimate tumor blood flow using 15O-water and tumor energy metabolism before treatment in a group of patients with LABC. 18F-FDG PET has previously been shown to be useful in response monitoring and prognosis for primary breast tumors (21–24). Prior studies in animal models have shown that the combination of blood flow and metabolism strongly influences tumor growth (19). Although tumor blood flow and glucose metabolism have been studied in LABC (13,21–23), no study has examined both factors simultaneously and quantitatively. Our hypothesis was that poorly perfused tumors, identified on the basis of low blood flow or low blood flow relative to metabolism, would respond poorly to systemic presurgical chemotherapy.
MATERIALS AND METHODS
Patient Selection
Patients presenting to the University of Washington Breast Cancer Specialty Center with LABC were eligible for the study. Patients were excluded if they were pregnant, unwilling or unable to undergo PET imaging, or not considered surgical candidates. Forty-one patients participated in the study, and 4 were excluded from analysis. Two patients could not tolerate the imaging protocol, resulting in uninterpretable images caused by significant motion during the study. One patient had a substantial portion (>50%) of the primary tumor excised during the diagnostic biopsy. 18F-FDG PET detected unsuspected distant metastases (stage IV disease) on the pretherapy scan for 1 patient, and she no longer met the study eligibility criteria. All patients were being considered for presurgical chemotherapy, and 31 of the remaining 37 patients in the study received chemotherapy before definitive surgery. Although referring physicians were not kept unaware of the results of PET imaging, these results were not used to select therapy. The patients provided signed informed consent for the PET studies according to the guidelines of the University of Washington Human Subjects Committee.
Pretherapy Clinical and Pathologic Parameters
Before the start of chemotherapy, patient age, menopause status, and tumor size and the presence or absence of clinically positive lymph nodes as assessed by the referring oncologist were recorded. Pretherapy biopsy samples were obtained by fine-needle aspiration, incisional biopsy, or core-needle biopsy. The tumor histologic grade was determined using the Nottingham grading system (25). Immunocytochemistry was used to assess estrogen receptor (ER) expression, c-erbB-2 (HER2/Neu) expression, p53 overexpression, and the Ki-67 (MIB1) index of tumor proliferation (7–9). ER expression was assessed using the 1D5 antibody (Dako Corp., Carpinteria, CA) and was expressed as negative (<5% positive), 1+ (5%–20% of tumor cells ER positive), 2+ (20%–80% positive), or 3+ (>80% positive). The polyclonal antibody preparation of Dako was used for c-erbB-2 immunocytochemistry, and grading was determined by intensity of membrane staining compared with normal ductal epithelium. A 2+ level of staining was considered intermediate overexpression, and 3+ staining was considered high overexpression. Overexpression of the p53 gene product was assessed using the D07 antibody (Dako) and was defined as positive when >50% of tumor nuclei were positive for the gene product. Cellular proliferation was assessed using Ki-67 (MIB1 MIB-1; Immunotech, Westbrook, ME) and was recorded as low (<10% of cells positive), intermediate (10%–20% of cells positive), or high (>20% of cells positive).
PET Imaging
All imaging was performed using an Advance tomograph (General Electric Medical Systems, Waukesha, WI), which provides imaging of 35 transaxial planes 4.25 mm thick with an intrinsic in-plane spatial resolution of 4.5 mm (26). Images were acquired in 2-dimensional high-sensitivity mode. Patients were positioned supine to view the breasts and the left ventricles (LVs) using a short transmission study. An intravenous cannula was placed in the arm contralateral to the breast tumor, and a blood sample was drawn before radiotracer injection for the determination of plasma glucose with an analyzer (Beckman Coulter, Inc., Fullerton, CA). A 25-min transmission study for attenuation correction was performed either before the study or after the completion of the emission study injection, using a correction for emission counts during transmission (26).
Blood flow imaging was performed using 962–1,998 MBq 15O-water. 15O was produced by 45-MeV proton bombardment of oxygen gas, using the (p,pn) reaction. 15O-water was then produced by the catalytic conversion of 15O-oxygen and hydrogen. Tracer was administered by bolus intravenous injection in a 1- to 4-mL volume. Radiochemical purity was >99%.
Dynamic 15O-water images were collected for 7.75 min after injection. The dynamic imaging sequence, starting with the initiation of the bolus, was 15 × 2 s, 15 × 5 s, 12 × 10 s, 8 × 15 s, and 6 × 20 s. Peak total coincidence counting rates did not exceed 700 kcps and were therefore well within the ability of the tomograph to accurately correct for dead time (26).
Metabolism imaging was performed using 259–407 MBq 18F-FDG, prepared using the method of Hamacher et al. (27). In all cases, 18F-FDG radiochemical purity was >95% and specific activity was >47 GBq/μmol. 18F-FDG was infused over 2 min in a volume of 7–10 mL. Dynamic imaging was performed for 60 min after the start of 18F-FDG infusion, using the following sequence: 1-min preinjection frame, 4 × 20 s, 4 × 40 s, 4 × 1 min, 4 × 3 min, and 8 × 5 min. Background counts from the 15O-water study were ≤4 kcps at the start of the 18F-FDG studies, with a typical 18F-FDG peak counting rate of 80 kcps.
Dynamic imaging data underwent corrections for random coincidences, scattered coincidences, and attenuation and were reconstructed into 35 × 128 × 128 matrices using a Hanning filter, yielding a reconstructed spatial resolution of 10–12 mm (26). Image count data were converted to kBq/mL values obtained weekly by scanning calibration vials of known activity measured in a dose calibrator (radioisotope calibrator CRC-7; Capintec, Inc., Ramsey, NJ).
PET Image Analysis
Regions of interest (ROIs) were drawn over the tumor, contralateral normal breast, and LV to obtain the blood time–activity curves (28). Tumor ROIs were 1.5-cm-diameter circles on 3 adjacent imaging planes (total axial distance, 1.3 cm) and surrounded the area of maximal tumor FDG uptake seen on the 30- to 60-min summed images. These regions were representative of the most metabolic portion of the tumor and therefore likely represented the area with the most biologically aggressive behavior. ROIs were completely encompassed by the tumor in all cases. Because the tumors studied were large, this region size did not result in appreciable partial-volume count loss. Normal breast ROIs ranged from 8 to 10 cm, depending on breast size, and were placed on 3 successive planes of the contralateral normal breast. LV ROIs were 1.5-cm circles placed on 3 successive midventricular slices close to the valve plane to avoid spillover of counts from adjacent myocardium (28). In our experience, this has been shown to result in reproducible curves in comparison with arterial blood samples.
Water studies were analyzed according to the method of Wilson et al. (13) using a 1-compartmental model described by the following differential equation:
 Eq. 1 where A(t) is the time-varying tissue activity in kBq/g, Cb(t) is the time-varying blood activity in kBq/mL, F is blood flow in mL/min/g, Vd is water distribution volume in mL/g, and λ is the radioactive decay constant for 15O, equal to 0.338 min−1. Blood flow and distribution volume were estimated by optimizing model parameters (F and Vd) to the tissue time–activity curves obtained from PET imaging, using the LV time–activity curve as the blood input function (Cb). Blood and tissue time–activity curves were not corrected for decay because the model accounts for radioactive decay. Nonlinear optimization was performed using the conjugate gradient optimizer in the Solver Tool in the spreadsheet program Excel (Microsoft, Redmond, WA). The model optimization was verified using simulated time–activity curves generated by the modeling program Stella (High Performance Systems, Hanover, NH) and by comparison with estimates using a different optimizer (Berkeley-Madonna, Berkeley, CA). Simulations of data with statistical noise added to match that observed in clinical studies revealed an SE of 13% for flow and 14% for distribution volume. A single repeated study on a patient yielded a difference of 11% for blood flow.
18F-FDG studies were analyzed using a standard Patlak-Gjedde graphic analysis approach to estimate the tracer flux constant, Ki (mL/min/g), obtained from the slope of the graphic relationship of normalized tissue uptake versus normalized time (29), using the decay-corrected data obtained from 30 to 60 min after injection. Metabolic rates were calculated as follows:
 Eq. 2 where [glucose] is the measured plasma glucose (μmol/mL). This method does not assume a constant to describe the relationship between the rate of glucose metabolism and the rate of 18F-FDG metabolism and is therefore reported as an 18F-FDG metabolic rate, MRFDG (μmol/min/100 g).
Clinical Tumor Measurements and Assessment of Response
Clinical response was assessed using the modality that best defined tumor size in the opinion of the referring medical oncologist. These modalities included sonography, mammography, or physical examination, as we have previously reported (17). A response was defined, in accord with established definitions, as a >50% decline in the product of the 2 greatest perpendicular tumor dimensions (30). Patients not achieving this endpoint were classified as showing clinical nonresponse (NR). Patients were judged to have a clinical CR when no viable tumor could be observed by diagnostic imaging or palpated by physical examination. Patients with a residual mass detected at the end of therapy and a ≥50% reduction in size were considered to show a clinical partial response (PR).
The presence or absence of macroscopic residual viable tumor in clinical responders receiving presurgical chemotherapy was determined from the report of the pathologist performing gross and histopathologic evaluation of the posttherapy surgical breast specimen. By standard definitions, a macroscopic pathologic CR was defined as the absence of macroscopic tumor by gross examination at the time of surgery (5). This response endpoint has been used in several prior studies of neoadjuvant treatment of LABC and has been shown to carry prognostic significance (5, 6). Patients with macroscopic abnormalities on gross pathology and minimal evidence of invasive tumor on histologic analysis were considered to have a macroscopic CR. Macroscopic complete responders were further classified as having a microscopic CR if no invasive tumor was seen by microscopic examination of the specimen. Pathologic lack of response in clinical nonresponders was confirmed by comparing tumor size measurements of the surgical specimen with clinical size measurements that had indicated a lack of response. Tumors with equivocal findings were reviewed and classified by a pathologist specializing in breast pathology who was unaware of PET imaging results.
Statistical Analysis
Differences in PET measurements between tumor and normal breast tissue were assessed using a 2-tailed Student t test. Associations between PET and clinical/pathologic tumor features were assessed by the Pearson correlation coefficient for continuous parameters (age, tumor size), the Kendall rank correlation coefficient for ordered nominal parameters (tumor grade, ER and c-erb-2 expression, Ki-67 proliferative index), and 2-tailed t tests for dichotomous parameters (menopausal status, clinically positive nodes, p53 overexpression) (31). The test for statistical significance was adjusted for multiple correlations using a Bonferroni correction (31). To determine the association of response (NR, PR, or CR) with pretherapy tumor parameters (clinical features, pathologic features, and PET measurements), the Kendall rank correlation coefficient (τb) was used for continuous variables (including PET measurements) and the χ2 test for trend (31) was used for ordered nominal and dichotomous variables (menopausal status, clinically palpable nodes, p53 overexpression, type of chemotherapy given). The association of clinical, pathologic, and PET parameters with disease-free survival was assessed using the Cox proportional hazards model. Initial screening of parameters was performed in a univariate fashion, and parameters with significance or borderline significance were incorporated into a multivariate analysis. All statistical analyses were performed using the JMP software package (SAS Institute, Cary, NC), except for the χ2 test for trend, which was implemented on Excel according to the method of Bland (31).
RESULTS
Patients
Thirty-seven patients (age range, 33–72 y; mean age, 52 y) with LABC underwent 18F-FDG and 15O-water PET imaging. Sixteen of the patients were postmenopausal, and 21 were premenopausal. Median primary tumor size was 4.9 cm (range, 1.9–11 cm). Patients with the smaller tumors had LABC because of advanced axillary disease. Two patients with N2 disease had a 1.9- and a 2.2-cm primary tumor, 1 patient with N1 disease had a 2-cm primary tumor, and all other patients had a primary tumor ≥ 2.5 cm. Pretherapy diagnosis was made by core-needle biopsy in 32 patients, surgical biopsy in 3, and fine-needle aspiration in 2. Tissue diagnosis was infiltrating ductal carcinoma in 29 of 37 patients, infiltrating lobular in 5 of 37, and infiltrating ductal with lobular features in 3. Six of 37 breast carcinomas were classified as inflammatory. Twenty-three patients had abnormal axillary lymph nodes by physical examination. Twenty-three tumors were ER positive, and 15 patients had tumors expressing the Her2-Neu oncogene.
Thirty-one patients underwent presurgical chemotherapy and had posttherapy surgical specimens for evaluation of response. Of the remaining 6 patients, 3 elected to go directly to surgery without neoadjuvant chemotherapy; 2 underwent therapy at an outside institution and were lost to follow-up. One patient died from complications of concomitant cystic fibrosis before completing chemotherapy.
Treatment
Twenty-seven of 31 patients who were receiving neoadjuvant chemotherapy underwent weekly dose-intensive doxorubicin therapy with granulocyte colony-stimulating factor support. Twenty-three of these 27 had doxorubicin plus cyclophosphamide; 2 of 27 had doxorubicin, cyclophosphamide, and fluorouracil; and 2 of 27 had doxorubicin only. Of the remaining 4 patients, 1 was treated with 3-wk cycles of paclitaxel chemotherapy with vinorelbine, and 1 received 3-wk cycles of docetaxel and vinorelbine. One patient underwent cyclophosphamide/methotrexate/fluorouracil chemotherapy with concurrent radiation, and 1 patient was treated with weekly paclitaxel and trastuzumab (Herceptin; Genentech, Inc., South San Francisco, CA). PET imaging results were not used to select chemotherapy regimens. The mean duration of chemotherapy was 15 wk (range, 8–28 wk). A mean of 1.2 (range, 0–8) treatments were withheld for toxicity or patient illness over the course of therapy. After the completion of therapy, 24 patients underwent mastectomy and 7 patients underwent lumpectomy. Surgery was performed a mean of 3.5 wk after the completion of therapy (range, 0.7–11.9 wk).
Response
Clinical response to adjuvant chemotherapy was determined by serial measurements of tumor dimensions. Tumor size was measured clinically by sonography in 23 patients, mammography in 1, and physical examination in 7. Four of 31 patients were judged to have a clinical CR; 20 of 31, a clinical PR; and 7 of 31, a clinical NR.
Pathologic response based on examination of the surgical specimen was as follows: 6 of 31 patients had an NR, 18 of 31 patients had a PR, and 7 of 31 patients had a CR. One patient who was believed to have a minimal response by physical examination (clinical NR) showed a >50% reduction in tumor size at gross pathology (pathologic PR). Two patients who were believed to have clinical evidence of residual tumor (clinical PR) were found to have no macroscopic viable tumor by pathology (pathologic CR). Of the patients with a pathologic macroscopic CR, 3 had no evidence of invasive disease by microscopy (microscopic CR) and 4 had residual microscopic invasive carcinoma (microscopic PR). Twenty-four of 31 patients had 1 or more positive nodes at surgery after chemotherapy (median number of positive nodes, 2). Twenty-one of 24 of these had abnormal axillary 18F-FDG uptake before therapy.
PET Measurements
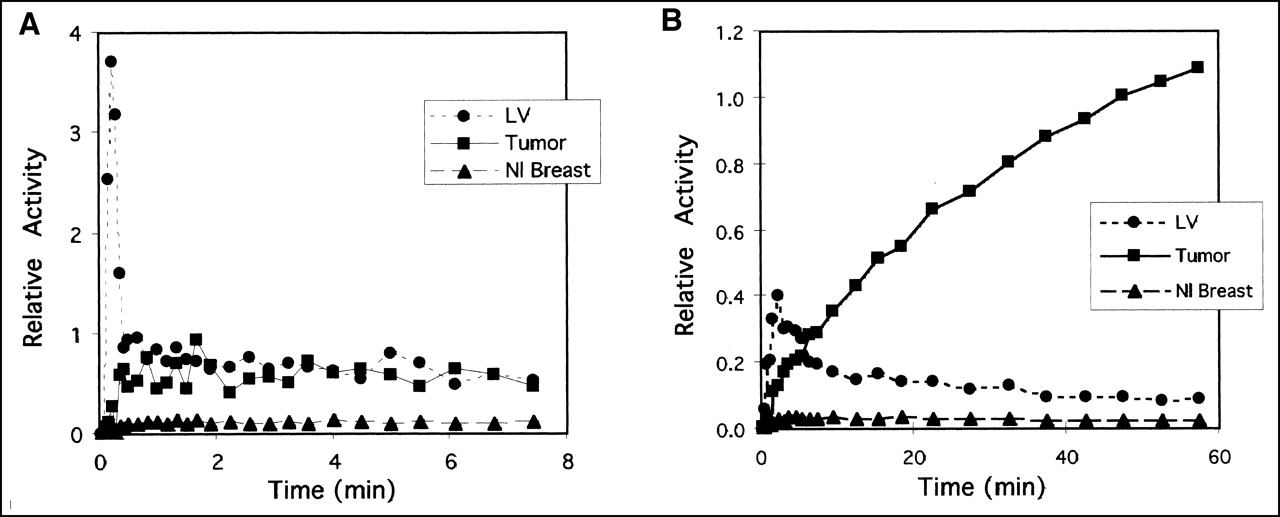
Examples of quantitative PET data are shown in Figures 1 and 2. Figure 1 shows sample time–activity curves for the 15O-water and 18F-FDG studies; Figure 2 shows examples of the fit of the model used to estimate blood flow and MRFDG.

Primary tumor, normal (Nl) breast, and LV blood time–activity curves from sample patient with metabolically active tumor after injection of 15O-water (A) and 18F-FDG (B). Y-axis units are arbitrary units of radioactivity that are same for both plots. Curves have been corrected for radioactive decay. Y-axis and x-axis scales are different.

Example of model estimation of blood flow and metabolic rate. (A) Compartmental model fits of tumor and tissue time–activity curves. Lack of smoothness in fit curve (tumor fit and normal [Nl] breast fit) results from lack of smoothing of blood time–activity curve, which serves as input to model, before use in model. (B) Graphic analysis plot for tumor and Nl breast shows line fits for data from 30 to 60 min after injection. Y-axis is normalized activity, which is tissue activity/blood activity. X-axis is normalized time, which is integrated blood activity/blood activity. 18F-FDG flux constant is estimated from slope of line fit (tumor fit and Nl breast fit).
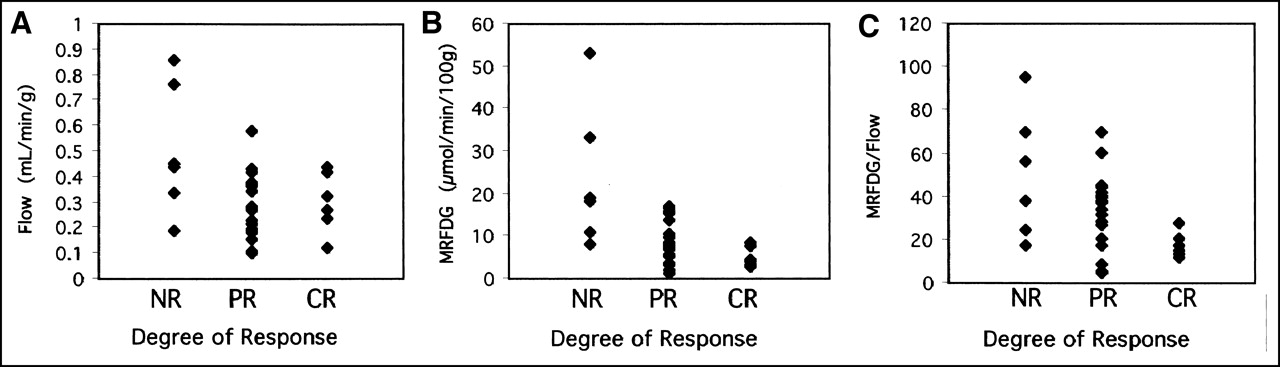
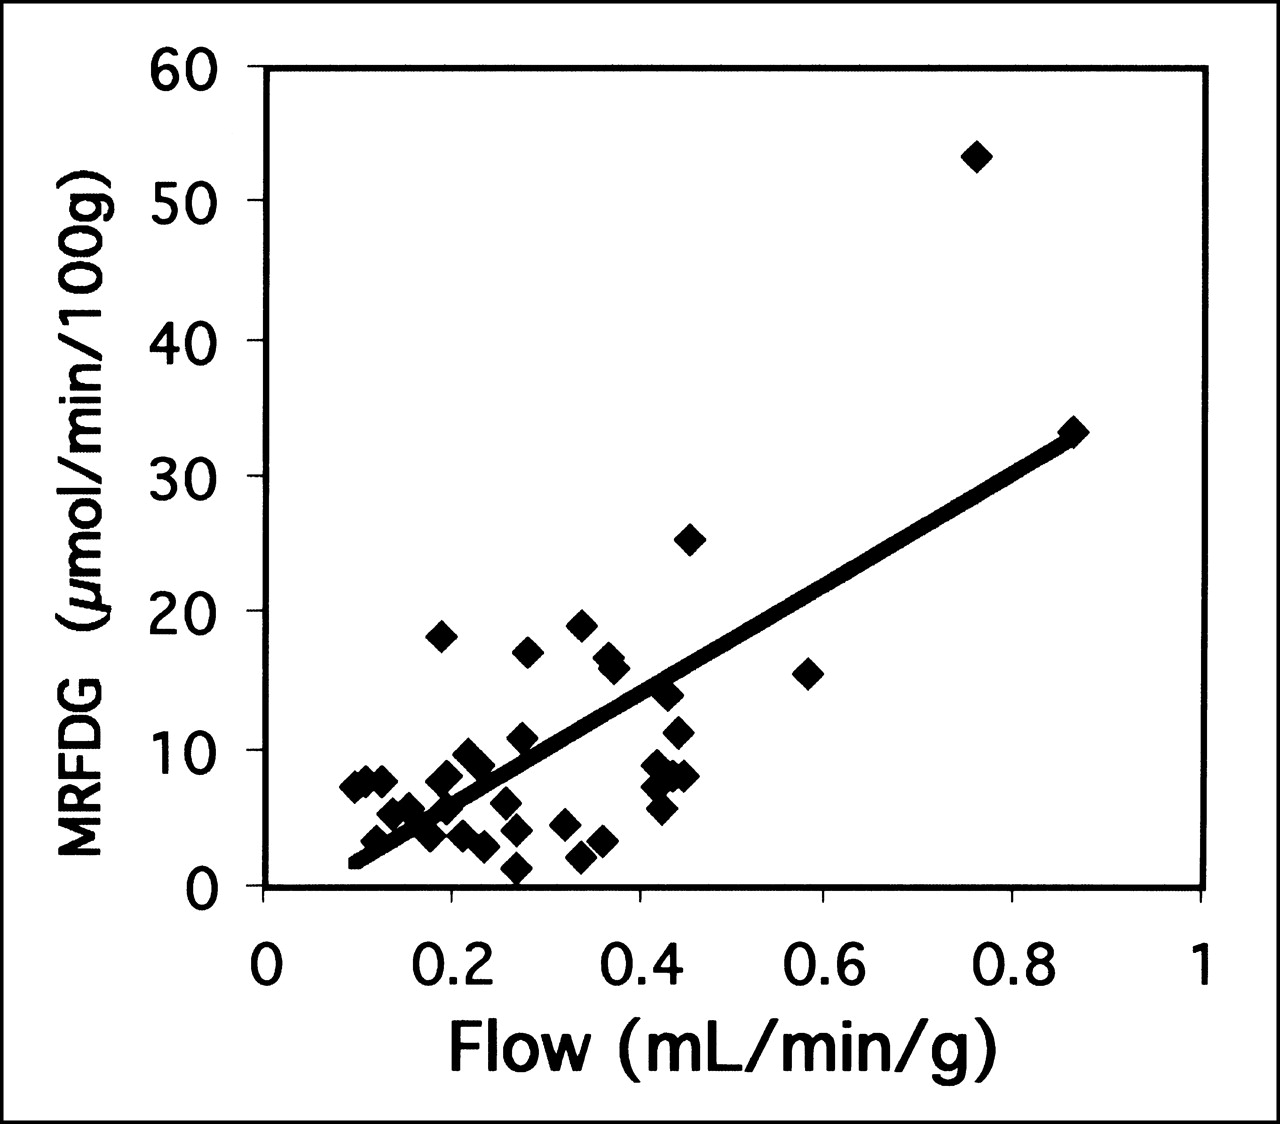
For all 3 PET measurements of blood flow, water distribution volume, and MRFDG, the mean for tumor differed significantly from the mean for normal breast tissue. Blood flow had a mean of 0.32 mL/min/g for tumor versus 0.06 mL/min/g for normal breast (P < 0.001), distribution volume had a mean of 0.58 mL/g for tumor versus 0.18 mL/g for normal breast (P < 0.001), and MRFDG had a mean of 10.6 μmol/min/100 g for tumor versus 0.6 μmol/min/100 g for normal breast (P < 0.001). Although tumor values were consistently higher than normal breast values, there was a large range of tumor values for each parameter (Fig. 3). The relationship between flow and MRFDG is plotted in Figure 4. Although a statistically significant correlation existed between blood flow and MRFDG (r = 0.70; P < 0.001), the relationships showed considerable dispersion as evidenced by a high SEE, with a value of 39% for SEE/mean. In addition, exclusion of 2 patients with unusually high MRFDG and blood flow reduced the correlation coefficient to 0.39.

PET parameter estimate values for tumor vs. normal breast: blood flow (A), water distribution volume (Vd) (B), and metabolism (MRFDG) (C).

Correlation between PET parameter estimates of MRFDG and flow.
The statistical associations between PET measurements of blood flow and metabolism and pretherapy patient and tumor features are listed in Table 1. A trend toward higher tumor metabolism in younger patients was found (P = 0.01). In addition, a trend toward higher MRFDG in higher-grade lesions was found (P = 0.02), and a weak association was found between lesions with a higher Ki-67 proliferative index and higher 18F-FDG, but this did not reach statistical significance (P = 0.09). There was a trend toward lower blood flow in more ER-positive tumors (P = 0.04). None of these correlations was statistically significant after correction for multiple correlations (n = 9; P cutoff = 0.006). No other significant correlations were found between the PET measurements and any of the clinical or pathologic parameters (P ≥ 0.11 for all other parameters).
Univariate Analysis of Correlation Between Blood Flow and Metabolism Measures and Clinical and Pathologic Breast Tumor Features
Two patients in the series had well-differentiated (grade I) lobular breast cancer. These tumors were notable for 18F-FDG tumor uptake close to normal breast background levels (MRFDG = 1.3 and 1.9 μmol/min/100 g), which made the tumors difficult to discern by 18F-FDG PET despite their large size (5.7 and 6.0 cm, respectively). Blood flow was not similarly low (blood flow = 0.27 and 0.34 mL/min/g, respectively).
Comparison with Response to Therapy
The relationships between response to therapy and pretherapy blood flow, MRFDG, and ratio of MRFDG to blood flow are plotted in Figure 5. There was a statistically significant trend for patients with higher MRFDG to have poorer response. Univariate analysis of the correlation between pretherapy parameters and tumor response (Table 2) showed only MRFDG and the ratio of MRFDG to flow to be significantly correlated with response (τb = −0.50, P = 0.001, and τb = −0.37, P = 0.01, respectively). The MRFDG association was statistically significant after correction for multiple correlations (n = 12; P cutoff = 0.004). This was not simply an association with chemotherapy regimens, as indicated by the lack of correlation of response and chemotherapy regimen (weekly doxorubicin-based therapy vs. other therapy: χ2 = 0.32; P = 0.57). Response was not significantly correlated with any of the other parameters (P ≥ 0.10), including tumor blood flow.
PET parameter estimates vs. pathologic response to neoadjuvant chemotherapy (NR, PR, or CR): blood flow (A), MRFDG (B), and MRFDG/blood flow (C).
Univariate Analysis of Correlation Between Clinical, Pathologic, and PET Data and Response to Therapy
We also examined the association between clinical, pathologic, and PET parameters and macroscopic CR to neoadjuvant therapy, a prognostically important endpoint. Only the ratio of MRFDG to flow showed a significant difference for patients with CR versus those with other than CR (t = 2.5; P = 0.02). Exclusion of the 2 patients with grade I lobular breast carcinoma and unexpectedly low MRFDG improved the significance (to P = 0.004) of the ratio of MRFDG to flow as a predictor of macroscopic CR.
Preliminary survival analysis of 31 patients with a median follow-up of 23 mo (Fig. 6; Table 3) showed only the ratio of MRFDG to flow and the number of positive axillary nodes to be significant predictors of disease-free survival. The predictive value of the ratio of MRFDG to flow remained significant in multivariate analysis that included axillary nodal status (P = 0.05).
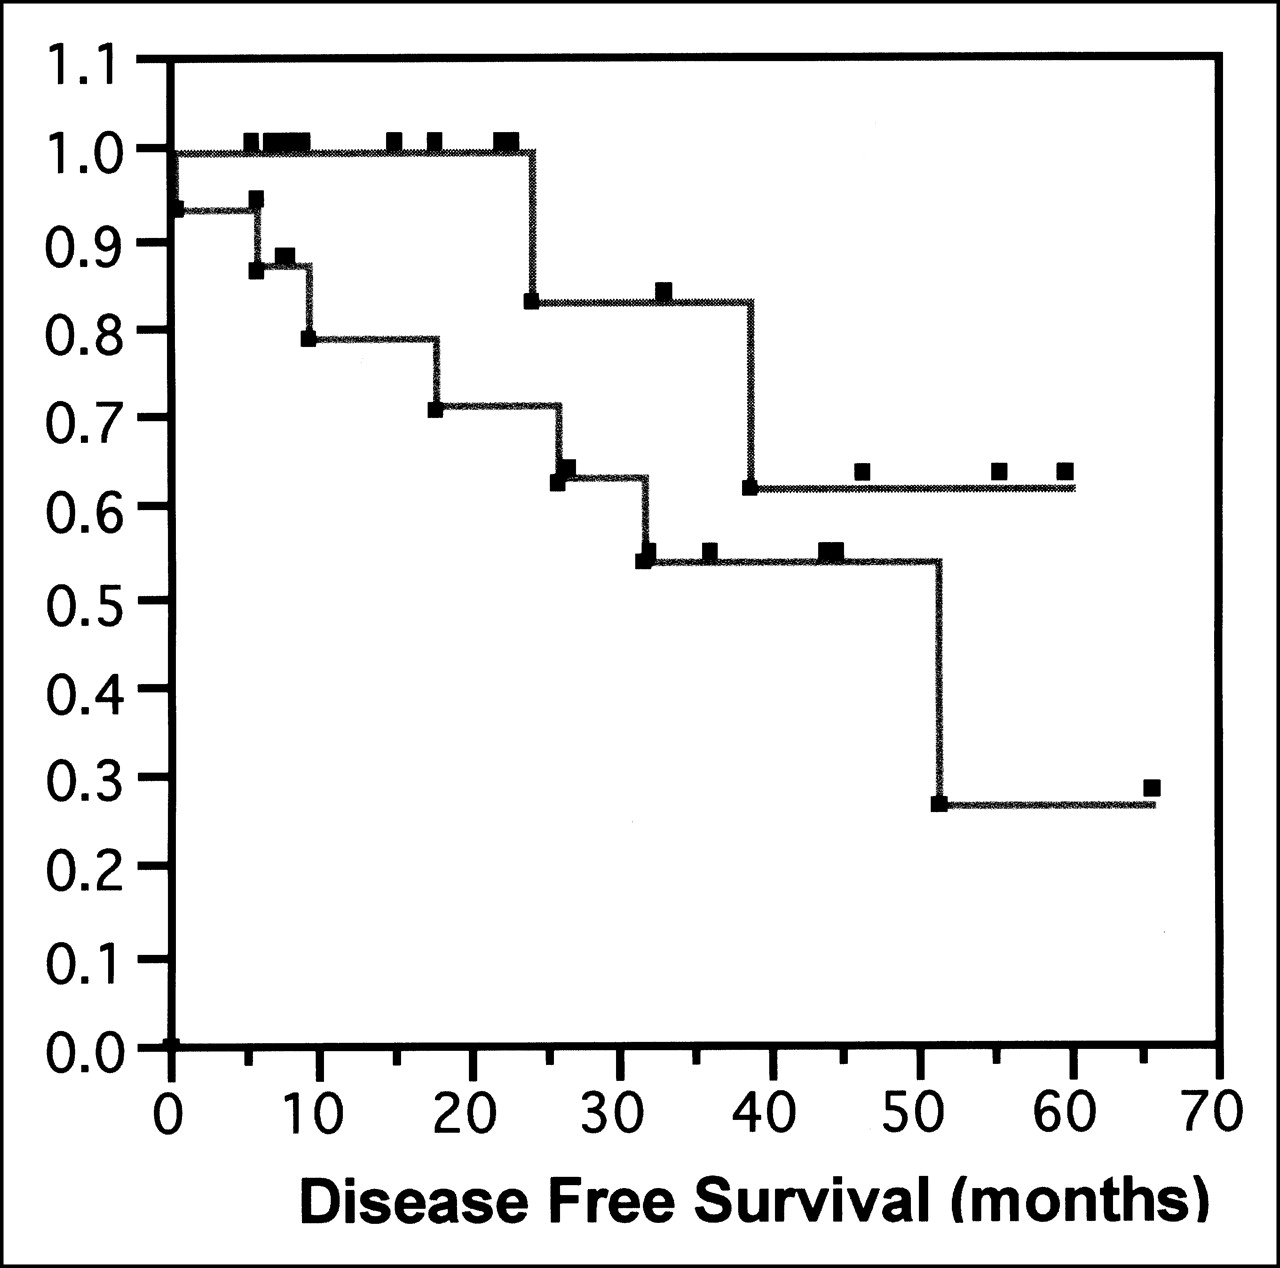
Kaplan–Meier plot of disease-free survival for patients with MRFDG/flow < median (top line) vs. patients with MRFDG/flow > median (bottom line) shows that patients with higher MRFDG-to-flow ratio have poorer disease-free survival. Probability value for difference in curves by Wilcoxon statistic is 0.09. Probability value for association between survival and MRFDG/flow by Cox proportional hazards model, which takes better advantage of continuous nature of PET data, is 0.05.
Univariate Survival Analysis for 31 Patients with Evaluable Response After Neoadjuvant Therapy
DISCUSSION
As in previous studies of LABC patients, our patients exhibited significantly increased blood flow and metabolism in breast tumors in comparison with the normal breast. Our estimates of tumor blood flow agree closely with values reported by Wilson et al. (13) for a similar group of patients, and estimates of MRFDG are similar to those found in the prior study of Wahl et al. (21). One of the striking features of the data is the wide range in tumor blood flow and metabolism, despite the fact that all patients had locally advanced tumors. Ours is, to our knowledge, the first study to report estimates of both blood flow and metabolism in LABC. Although tumor blood flow and metabolism values were correlated, there was considerable variability in the relationship, with the ratio of MRFDG to flow in tumors ranging from 4.6 to 95.3 μmol/min/100 g per mL/min/g. Our results show that although all patients in the study had advanced tumors, in vivo tumor biology varied considerably between patients. This may help explain the variability in response.
For our group of patients with LABC, trends were found toward higher MRFDG for younger patients and tumors with higher histologic grade and higher blood flow for ER-negative tumors. However, no trend was statistically significant after correction for multiple correlations, suggesting that the information provided by PET metabolism and flow images is distinct from standard clinical and pathologic data. This is similar to the results of Avril et al. (32), who found that 18F-FDG uptake was mostly unrelated to standard tumor pathologic features.
We had hypothesized that low tumor perfusion would predict poor response to systemic therapy; however, blood flow alone was not predictive of response. There was, however, a strong association between pretherapy metabolism, reflected by the MRFDG, and the degree of response. Tumors with high rates of glucose metabolism before therapy tended to have poor responses. In addition, a low ratio of MRFDG to blood flow was the best predictor of the prognostically important endpoint of macroscopic CR to treatment. Preliminary survival analysis also showed that a low ratio of MRFDG to flow was also predictive of better disease-free survival. These trends were not found by prior studies using PET to study LABC; however, prior studies did not examine flow and glucose metabolism simultaneously. In addition, most prior reports of 18F-FDG PET imaging in LABC relied on less precise measures of glucose metabolism, such as the standard uptake value, rather than more precise measures, such as MRFDG.
Overlap existed between categories of response for MRFDG and ratio of MRFDG to flow; in other words, these parameters did not predict response in individual patients. However, the significance of our findings is in the strong association of these parameters with response and resistance to chemotherapy, suggesting an important, and previously unrecognized, biologic factor influencing LABC response to neoadjuvant chemotherapy. The ratio of MRFDG to flow is an indirect indicator of glucose use relative to delivery. An elevated ratio indicates high glucose extraction by the tumor. One situation in which this might occur would be in the setting of limited oxygen availability in a relatively hypoxic environment, which would result in less aerobic, and therefore less efficient, glucose use. Hypoxia has been implicated as a factor in chemotherapy resistance in several tumor types, possibly through the induction of gene products that confer resistance (33). Studies have shown that hypoxia confers resistance to apoptosis, the principal mechanism of cell death in response to chemotherapy (34). Furthermore, recent studies (35) suggested that intermediate metabolites in the glycolytic pathway are important in initiating apoptosis and that alternations in these glycolytic intermediates may confer apoptotic resistance. These findings provide an intriguing hypothesis for hypoxia as a connection between altered glucose metabolism and chemotherapy resistance, which is the subject of ongoing studies at our institution.
In some prior studies of other cancers, high 18F-FDG uptake has been associated with high cellular proliferation (36,37). Because more highly proliferating tumors are often responsive to cytotoxic chemotherapy (7), it might be expected that high 18F-FDG uptake would indicate a higher likelihood of response to cytotoxic chemotherapy. In our study, somewhat paradoxically, high 18F-FDG uptake strongly predicted a poor response to chemotherapy. However, we did not find a significant association between 18F-FDG metabolism and cell proliferation (P = 0.09) as assessed by Ki-67 immunostaining. In addition, the Ki-67 index was not predictive of response. One of the differences between our study and other studies showing a stronger correlation between 18F-FDG uptake and proliferation is that we imaged a population of patients with uniformly large tumors, whereas other studies included patients with a wider range of tumor sizes and stages. In our population of patients with uniformly large tumors, in which factors such as substrate availability may also affect metabolism, cellular proliferation is likely to have a proportionally smaller influence on glucose metabolism than it would in smaller, earlier-stage, more uniform tumors. In addition to the energetics needed for tumor growth, high glucose metabolism may result from other tumor-specific factors, including tissue hypoxia (19) or alterations in the enzymes or control mechanisms in the glucose metabolic pathway (38). High glucose metabolism, as measured by 18F-FDG PET, has been implicated as a predictor of poor survival in several tumor types, including breast cancer (24). Our data suggest that high glucose metabolism in LABC is also a predictor of poor response to chemotherapy. This parallels prior in vitro data showing a higher rate of glycolysis in doxorubicin-resistant cells than in nonresistant cells (39).
This study had several limitations. The estimation of blood flow using 15O-water reflects bulk blood flow to the tumor but not necessarily nutritive blood flow. The frequently aberrant tumor vasculature may have significant arteriovenous shunting (11), which cannot be adequately separated from nutritive capillary blood flow by our method. This may, in part, explain why flow measurements alone did not predict response.
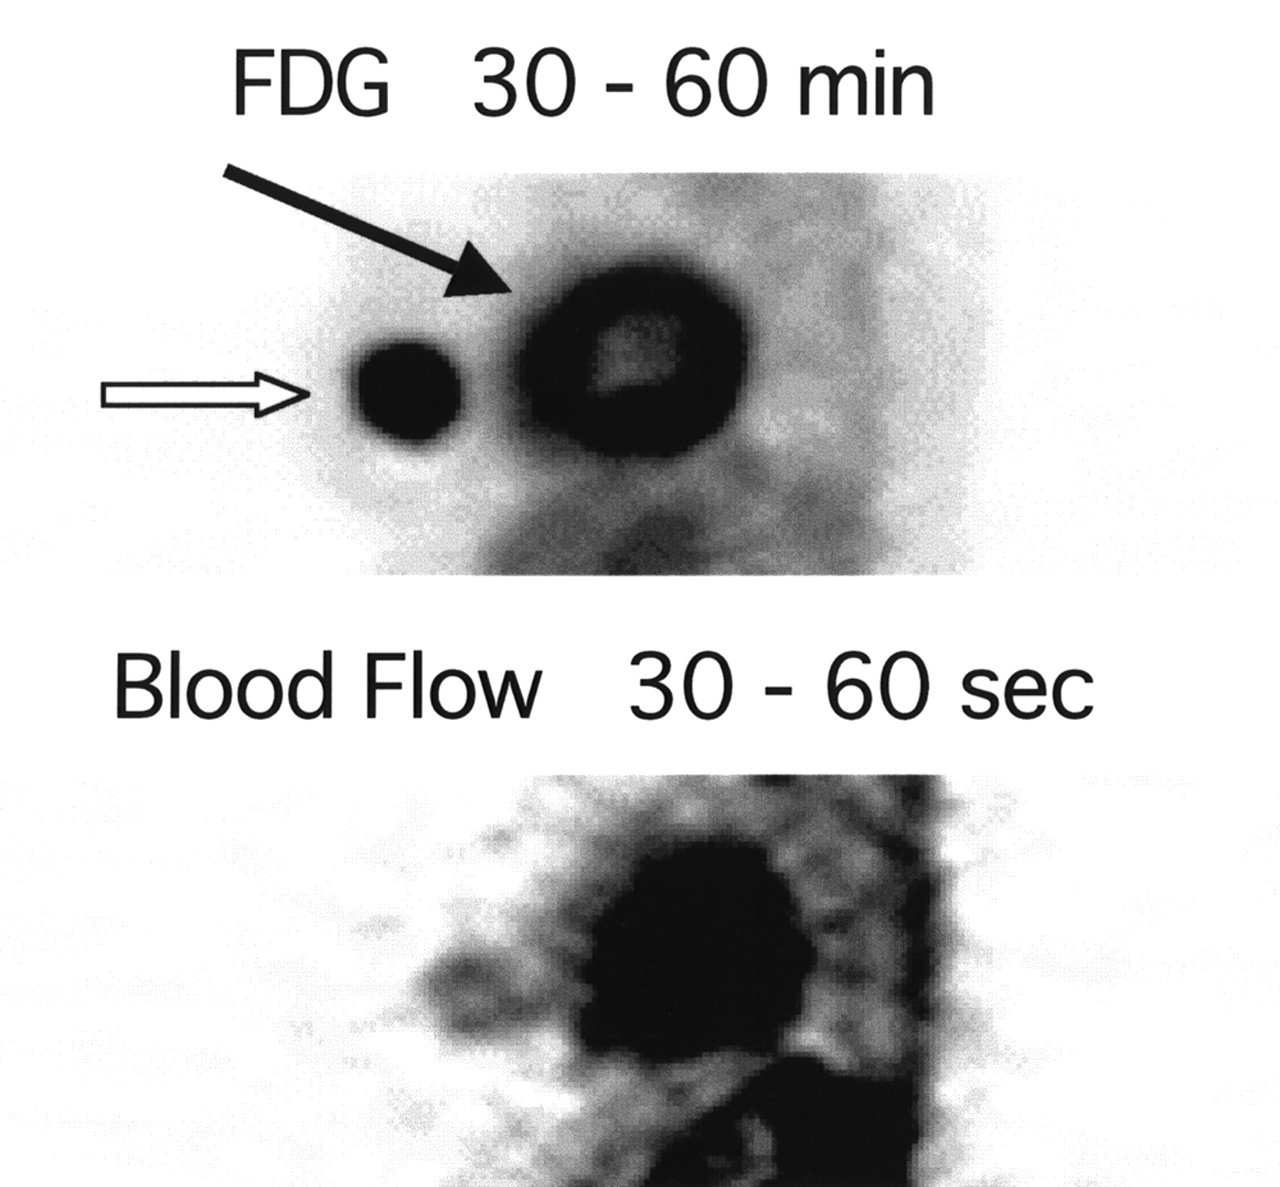
PET images were analyzed by measuring uptake in the portion of the tumor with maximal uptake of 18F-FDG, as an indicator of the most metabolically active portion. Although this approach targets what we presume is the most biologically aggressive portion, this method does not adequately reflect the regional heterogeneity of blood flow and metabolism in these large tumors. In addition to quantitative mismatches caused by tumor heterogeneity, regional mismatches may be present. Figure 7 shows summed water and 18F-FDG images in a patient with a partial response to therapy. This patient showed a regional metabolism–blood flow mismatch at the center of the tumor; however, the mismatch was quantitatively underestimated by the region-based analysis used in this study. The patient had a substantial reduction in tumor size but was left with a core of residual viable tumor at the end of chemotherapy. The use of pixelwise image analysis techniques may yield further insights into the heterogeneity of blood flow and metabolism and its possible contribution to therapy resistance.

Thick sagittal PET images: summed FDG image (top) and summed water image (bottom). Tumor activity is indicated by open arrow, and cardiac activity is indicated by solid arrow. Comparison suggests flow–metabolism mismatch at center of tumor, with comparatively less blood flow in center than periphery of tumor.
Serial measurements of blood flow and metabolism over the course of therapy may yield insights into the mechanisms of response and resistance. These studies are ongoing at our institution.
CONCLUSION
LABC exhibits a wide range of metabolism and blood flow, as measured by PET. High pretherapy metabolism, indicated by high 18F-FDG uptake, predicts a poor response to presurgical chemotherapy. Patients whose primary tumors have low metabolism relative to blood flow are the most likely to achieve a complete macroscopic response and have the longest disease-free survival. Further studies are needed to elucidate the biologic mechanism underlying these findings.
Acknowledgments
The authors acknowledge the support of Trevor Olson for image analysis; Dr. Jeanne Link and John Courter for isotope production; Dr. Thomas Lewellen, Steven Kohlmeyer, Barbara Lewellen, Manjit Basran, Pam Pham, and Colin Alden for technical assistance with the imaging studies; Drs. Janet Eary and Kenneth Krohn for helpful comments; Mimi Shurts for patient care coordination; and the staff of the University of Washington Breast Cancer Specialty Clinic for help with patient referrals. This study was supported by National Institutes of Health grants CA72064 and CA42045.
Footnotes
Received Jul. 26, 2001; revision accepted Dec. 19, 2001.
For correspondence or reprints contact: David A. Mankoff, MD, PhD, Division of Nuclear Medicine, Box 356113, UWMC, 1959 NE Pacific St., Seattle, WA 98195.
E-mail: dam{at}u.washington.edu
REFERENCES
In this issue


Jump to section
Related Articles
Cited By...
- Principles of Tracer Kinetic Analysis in Oncology, Part II: Examples and Future Directions
- Portable, handheld, and affordable blood perfusion imager for screening of subsurface cancer in resource-limited settings
- Initial Studies with 11C-Vorozole PET Detect Overexpression of Intratumoral Aromatase in Breast Cancer
- Additional Clinical Value for PET/MRI in Oncology: Moving Beyond Simple Diagnosis
- Breast Cancer Blood Flow and Metabolism on Dual-Acquisition 18F-FDG PET: Correlation with Tumor Phenotype and Neoadjuvant Chemotherapy Response
- Multiparametric Imaging of Tumor Hypoxia and Perfusion with 18F-Fluoromisonidazole Dynamic PET in Head and Neck Cancer
- Assessing Prostate Cancer Aggressiveness with Hyperpolarized Dual-Agent 3D Dynamic Imaging of Metabolism and Perfusion
- Sympathetic Innervation of Cold-Activated Brown and White Fat in Lean Young Adults
- 18F-FDG PET-Derived Tumor Blood Flow Changes After 1 Cycle of Neoadjuvant Chemotherapy Predicts Outcome in Triple-Negative Breast Cancer
- Role of Positron Emission Tomography for the Monitoring of Response to Therapy in Breast Cancer
- Oncogene Pathway Activation in Mammary Tumors Dictates FDG-PET Uptake
- Evaluation of Breast Tumor Blood Flow with Dynamic First-Pass 18F-FDG PET/CT: Comparison with Angiogenesis Markers and Prognostic Factors
- PET Tumor Metabolism in Locally Advanced Breast Cancer Patients Undergoing Neoadjuvant Chemotherapy: Value of Static versus Kinetic Measures of Fluorodeoxyglucose Uptake
- Tumor Metabolism and Blood Flow as Assessed by Positron Emission Tomography Varies by Tumor Subtype in Locally Advanced Breast Cancer
- 18F-FDG Uptake in Lung, Breast, and Colon Cancers: Molecular Biology Correlates and Disease Characterization
- Imaging Tumor Phenotype: 1 Plus 1 Is More Than 2
- Decreased Blood Flow with Increased Metabolic Activity: A Novel Sign of Pancreatic Tumor Aggressiveness
- The Role of Radiotracer Imaging in the Diagnosis and Management of Patients with Breast Cancer: Part 2--Response to Therapy, Other Indications, and Future Directions
- Response to Therapy in Breast Cancer
- Blood flow and Vd (water): both biomarkers required for interpreting the effects of vascular targeting agents on tumor and normal tissue
- Reproducibility of Tumor Blood Flow Quantification with 15O-Water PET
- Tumor Metabolism and Blood Flow Changes by Positron Emission Tomography: Relation to Survival in Patients Treated With Neoadjuvant Chemotherapy for Locally Advanced Breast Cancer
- Use of H215O-PET and DCE-MRI to Measure Tumor Blood Flow
- Tumor Blood Flow Measured by PET Dynamic Imaging of First-Pass 18F-FDG Uptake: A Comparison with 15O-Labeled Water-Measured Blood Flow
- Research Issues Affecting Preoperative Systemic Therapy for Operable Breast Cancer
- Tumor-Specific Positron Emission Tomography Imaging in Patients: [18F] Fluorodeoxyglucose and Beyond
- Dynamic and Static Approaches to Quantifying 18F-FDG Uptake for Measuring Cancer Response to Therapy, Including the Effect of Granulocyte CSF
- Monitoring of Early Response to Neoadjuvant Chemotherapy in Stage II and III Breast Cancer by [18F]Fluorodeoxyglucose Positron Emission Tomography
- Quantitative Fluoroestradiol Positron Emission Tomography Imaging Predicts Response to Endocrine Treatment in Breast Cancer
- A Physiologic Imaging Pilot Study of Breast Cancer Treated with AZD2171
- The potential of PET to increase understanding of the biological basis of tumour and normal tissue response to radiotherapy
- Sonographic Evaluation of Early-Stage Breast Cancers That Undergo Neoadjuvant Chemotherapy
- Spatial Heterogeneity and Oxygen Dependence of Glucose Consumption in R3230Ac and Fibrosarcomas of the Fischer 344 Rat
- Progress and Promise of FDG-PET Imaging for Cancer Patient Management and Oncologic Drug Development
- FDG-PET and Beyond: Molecular Breast Cancer Imaging
- 18F-FDG Kinetics in Locally Advanced Breast Cancer: Correlation with Tumor Blood Flow and Changes in Response to Neoadjuvant Chemotherapy
- Hypoxia and Glucose Metabolism in Malignant Tumors: Evaluation by [18F]Fluoromisonidazole and [18F]Fluorodeoxyglucose Positron Emission Tomography Imaging
- Assessment of Inter- and Intrapatient Variability in C15O2 Positron Emission Tomography Measurements of Blood Flow in Patients with Intra-abdominal Cancers
- Positron emission tomographic imaging of angiogenesis and vascular function
- Changes in Blood Flow and Metabolism in Locally Advanced Breast Cancer Treated with Neoadjuvant Chemotherapy
- Locally Advanced Breast Cancer: Is PET Useful for Monitoring Primary Chemotherapy?
- SUV Varies with Time After Injection in 18F-FDG PET of Breast Cancer: Characterization and Method to Adjust for Time Differences
- Are We Ready for Dedicated Breast Imaging Approaches?
- 18F-FDG PET Evaluation of the Response to Therapy for Lymphoma and for Breast, Lung, and Colorectal Carcinoma