


Abstract
The purpose of this study was to measure how 18F-FDG PET standardized uptake values (SUVs) change over time in breast cancer and to examine the feasibility of a method to adjust for modest variations in the time of uptake measurement experienced in clinical practice. Methods:18F-FDG PET was performed as 60-min dynamic imaging with an additional image acquired at ∼75 min after injection. For 20 newly diagnosed, untreated, locally advanced breast cancer patients, both the maximum SUV and the average SUV within the lesion were calculated with and without correction for blood glucose concentration. A linear regression analysis of the portion of the time–activity curves starting at 27 min after injection was used to estimate the rate of SUV change per minute during the interval from 27 to 75 min. The rate of SUV change with time was compared with the instantaneous SUV obtained at different times from 27 to 75 min. Results: In untreated breast cancer, 18F-FDG SUV values changed approximately linearly after 27 min at a rate ranging from −0.02 to 0.15 per minute. In addition, the rate of SUV change was linearly correlated with the instantaneous SUV measured at different times after injection (r2 ranged from 0.82 to 0.94; P < 0.001). Using this information, an empirical linear model of SUV variation with time from injection to uptake measurement was formulated. The comparison method was then applied prospectively to a second set of 20 locally advanced breast cancer lesions not included in the initial analysis. The average percent error using the method to adjust for time differences was 8% and 5% for maximum SUVs and average SUVs ranging from 2 to 12. Conclusion: In untreated breast cancer, the SUV at any time point approximately predicts the rate of change of SUV over time. A comparison method based on this finding appears feasible and may improve the usefulness of the SUV by providing a means of comparing SUV acquired at different times after injection.
The standardized uptake value (SUV) is a relative measure of tracer uptake in tissue used in 18F-FDG PET (1). As pointed out by Keyes (2), the SUV varies with body habitus, plasma glucose concentration, and, perhaps one of the most important factors affecting the SUV, the time from injection to imaging. However, the SUV is a clinically practical and useful approach to tissue uptake quantification for diagnosis and treatment follow-up (3–6). Hamburg et al. (7) examined the temporal changes in SUV in 8 patients with stage III lung cancer and found a wide variation with time of measurement. Most PET centers allow for 40–70 min from injection to imaging (8). In a busy PET department, a fixed 45- or 60-min protocol can be difficult to adhere to precisely, and this may affect the SUV used for clinical interpretation. This is especially important in serial scan comparisons to measure tumor response to therapy. Understanding how SUV changes in tumors over time after injection is useful for comparing varying times between injection and PET imaging, thus improving the usefulness of 18F-FDG SUV when comparing different studies, including serial studies in the same patient.
The purpose of this study was to measure how the SUV changes with observation time after injection in breast cancer and to examine the feasibility of an approximate method to compare the SUVs from studies with modest variations in the time between injection and uptake measurement experienced in clinical practice. Thie et al. (8) used dynamic scans of normal tissue and a heterogeneous group of tumors to explore the change in activity over time and to better define the appropriate time for imaging after injection based on optimal contrast ratios. They also suggested a method for correcting uptake measurements to a standardized time. Our study differs in that we analyzed dynamic scans of a homogeneous group of tumors and we also evaluated the potential error of this approach using a second independent study.
MATERIALS AND METHODS
18F-FDG PET data from 20 newly diagnosed, untreated, locally advanced breast cancer patients were retrospectively analyzed. These patients were imaged as part of an ongoing study evaluating PET imaging and locally advanced breast cancer at our institution. Results from some of these patients have been reported (9).
18F-FDG PET imaging was performed using 246–393 MBq (6.7–10.6 mCi) 18F-FDG, prepared using the method of Hamacher et al. (10). In all cases, 18F-FDG radiochemical purity was >95% and specific activity was >47 GBq/μmol. 18F-FDG was infused using a volume of 7–10 mL over 2 min in the antecubital vein contralateral to the affected breast. All imaging studies were performed using an Advance PET scanner (General Electric Medical Systems) operating in a 2-dimensional high-sensitivity mode with 35 imaging planes covering an axial field of view of 15 cm (4.0-mm axial full width at half maximum at the center of the tomograph) and an intrinsic in-plane resolution of ∼5 mm (11,12). Before the PET study, patients fasted for a minimum of 6 h and blood glucose levels were measured using a glucose analyzer (Beckman Coulter, Inc.) before 18F-FDG injection.
Dynamic imaging was performed for 60 min after the start of 18F-FDG infusion. For the portion of the scans evaluated in this study, 5-min time bins were used. For 13 of the patients, a 7-min static emission scan, taken as part of a torso survey and starting up to 12 min after the 60-min dynamic study (yielding time points of up to 75 min), was also available and used for data analysis. Imaging data underwent corrections for attenuation, random coincidences, and scattered coincidences and were reconstructed into 35 transverse image planes (128 × 128 pixels) using filtered backprojection with a Hann 10-mm smoothing window. Image count data were converted to kilobecquerels/milliliter using data from calibration vials of known activity measured in a dose calibrator (radioisotope calibrator CRC-7; Capintec, Inc.).
For each lesion, the SUV versus time curves were generated using both the maximum SUV (Smax) and the average SUV (Sav) within a volume of interest (VOI). The VOI consisted of 3 circles of 17 pixels and ∼1.5-cm diameter each, over 3 contiguous transaxial planes, each 4.5-mm thick, and the middle slice containing the maximum pixel value for the lesion. Both the Smax and the Sav were calculated using the formula:
 Eq. 1 where AVOI is the measured activity in the VOI (in μCi/mL), ID is the injected dose (in mCi), and W is the body weight of the patient (in kg). SUVs were also processed with correction for blood glucose concentration by using the formula (13):
 Eq. 2 where SGlu is the glucose-corrected SUV and [Glu] is the blood glucose level (in mg/dL). Because this study examined the change in SUV with time of uptake, all tumors were >2 cm, and the regions of interest were 1.5 cm in diameter, no partial-volume correction was applied.
The time of each SUV was considered to be the midinterval of each acquisition time bin or frame. As mentioned above, for most studies, an additional SUV measurement was obtained between 71 and 75 min after injection from a subsequent standard clinical scan.
A linear regression analysis of the curves after 27 min following injection was used to estimate the rate of SUV change (dS/dt [min−1]) during the interval from 27 to 75 min for each lesion. The estimated dS/dt was compared with the instantaneous measured SUV at 27, 42, 57, and 75 min after injection. Using a linear model of dS/dt versus SUV(t), an empirical method for comparing SUV for varying times from injection to uptake measurement based on the linear correlation of dS/dt versus SUV(t) was formulated.
To test the validity of this comparison method, we selected a second set of 20 locally advanced breast cancer lesions in patients not included in the initial analysis who were studied using the same the same imaging protocol and data analysis as described above. Using the comparison method based on our linear model, we estimated the Smax and Sav at 71–75 min after injection using the known Smax and Sav at 45 min in those patients. The estimated values were compared with the measured values at 71–75 min.
RESULTS
Patients and Tumors
The 20 patients studied included 6 whose findings were reported in our prior analysis of blood flow and metabolism determined by PET (9). Patients ranged from 33 to 72 y old (mean, 49 y) at the time of their study participation. Of the 20 patients, 13 were premenopausal women. Blood glucose level at the time of injection ranged from 74 to 117 mg/mL (mean, 88 mg/mL). The size of the breast lesions ranged from 2 to 11 cm in diameter (mean, 6 cm) as assessed by mammography, ultrasound, or physical examination conducted before therapy. Histopathologic analysis of core needle biopsy specimens revealed 16 infiltrating ductal carcinomas (11 low grade, 5 intermediate grade) and 4 infiltrating lobular carcinomas (1 intermediate grade, 3 high grade). Three of the 20 patients had inflammatory breast cancer at the time of diagnosis.
SUV Measurements
Figure 1 shows the tumor time–activity curves of tumor VOIs for all patients. At 57 min, the Smax for the tumors ranged from 1.3 to 12.4 (mean, 6.6) and the Sav ranged from 0.9 and 10.6 (mean, 4.9). When blood glucose correction was applied, the Smax at 57 min ranged from 1.0 to 10.5 (mean, 5.8) and the Sav ranged from 0.7 and 8.6 (mean, 4.3).
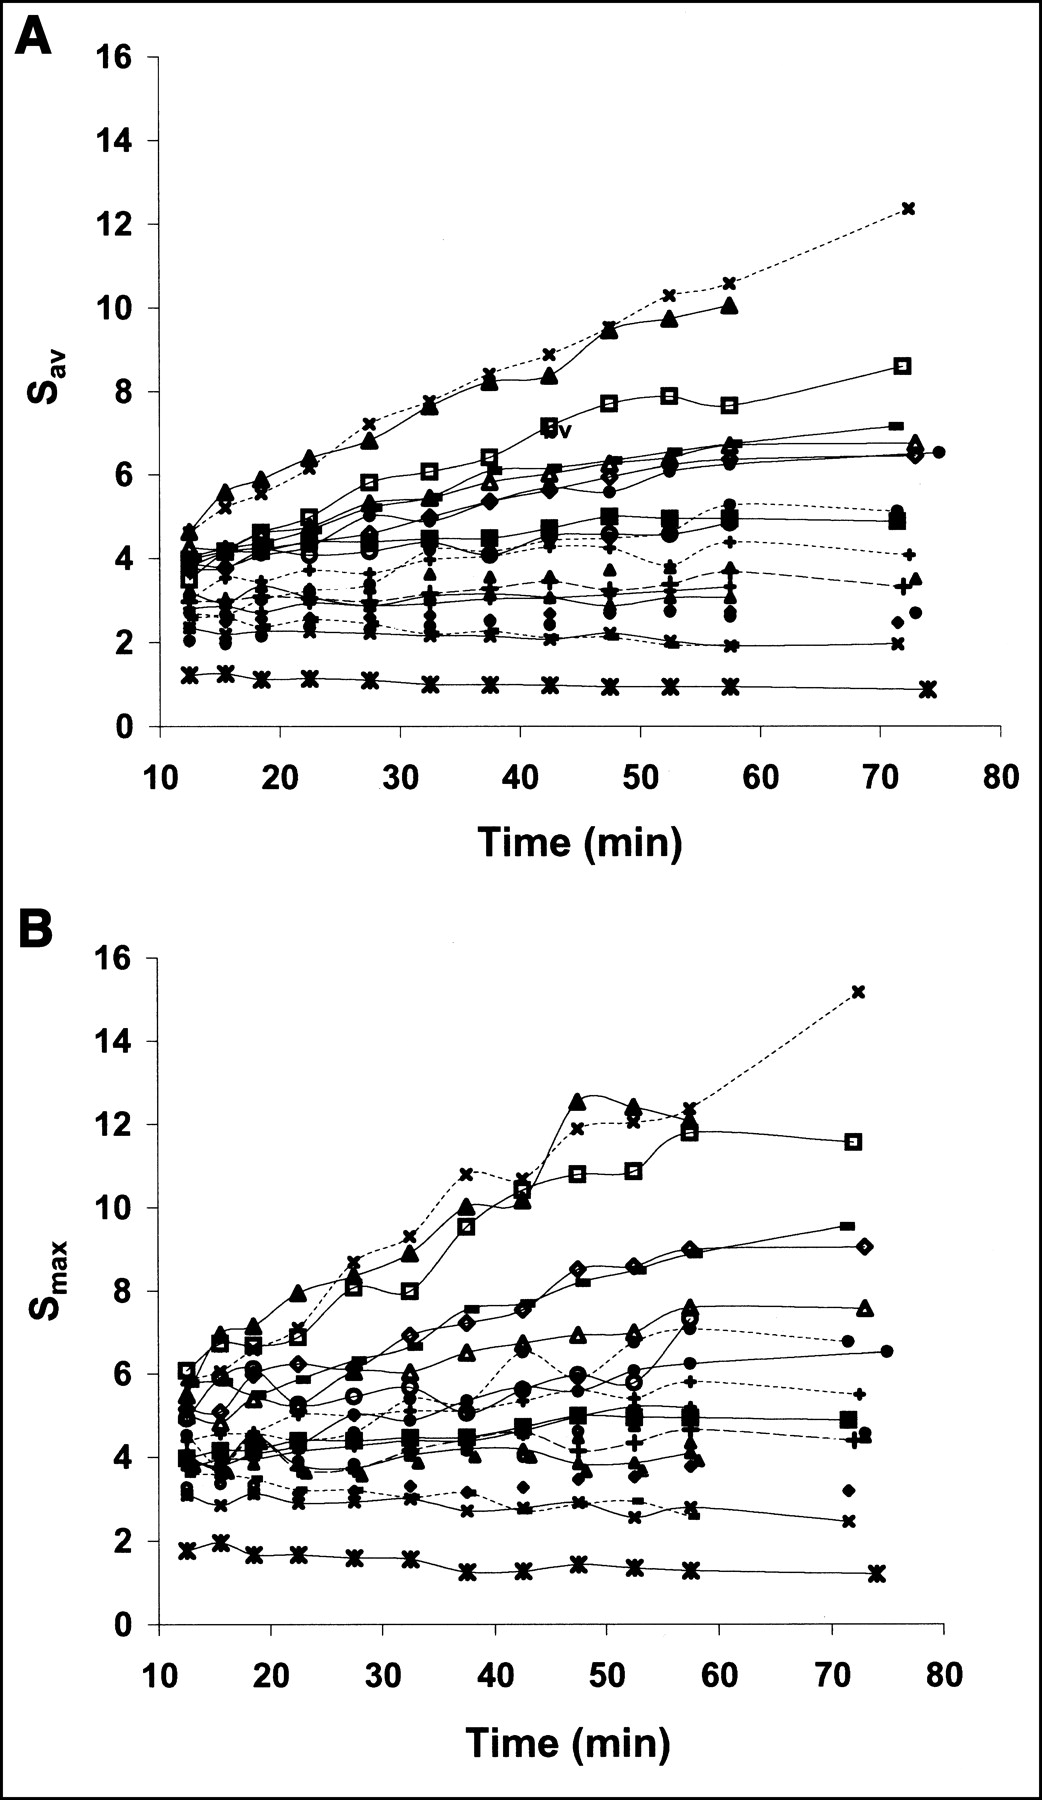
Tumor time–activity curves of VOIs for all patients: Sav (A) and Smax (B) vs. time.
Rate of Uptake Change with Time
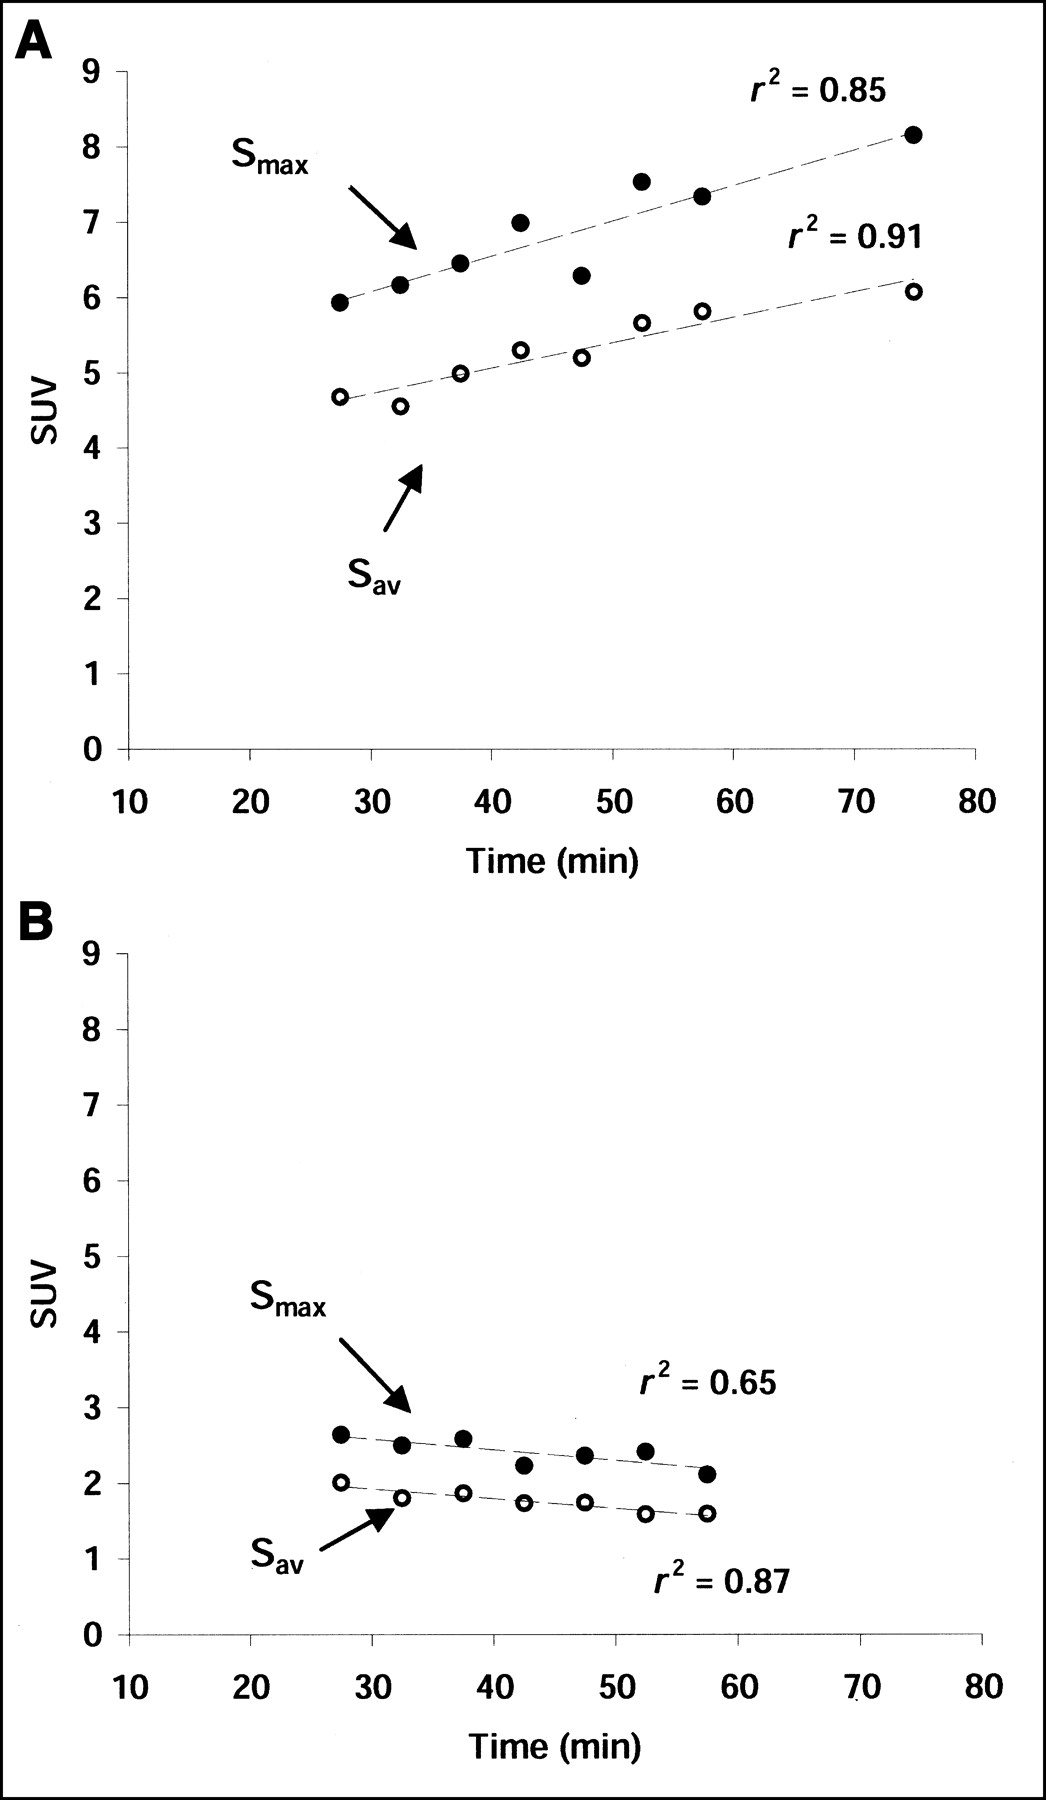
Linear regression analysis was applied to each of the curves in Figure 1 starting at 27 min. Figure 2 shows examples of linear fits for 2 lesions, one for which the linear regression generated a positive slope (Fig. 2A) and another for which the linear regression generated a negative slope (Fig. 2B). As illustrated by these curves (Figs. 1 and 2), Smax showed more variability than Sav. This is most likely due to a higher statistical noise for Smax compared with Sav. 18F-FDG uptake changed approximately linearly between 27 and 75 min. The dSmax/dt (slope of the linear regression) ranged from −0.02 to 0.15 min−1 and was positive (increased uptake over time) for 17 patients and negative (decreased uptake over time) for 3 patients. The dSav/dt ranged from −0.02 to 0.12 min−1 and was positive for the same 17 patients and negative for the same 3 patients as for Smax. Because the shapes of the curves did not change after blood glucose correction, the linear regression results are similar with and without blood glucose correction.

Example of linear fit for 2 lesions, one for which linear regression generated positive slope (A) and another for which linear regression generated negative slope (B).
Correlation of Rate of SUV Change with SUVs at Different Times After Injection
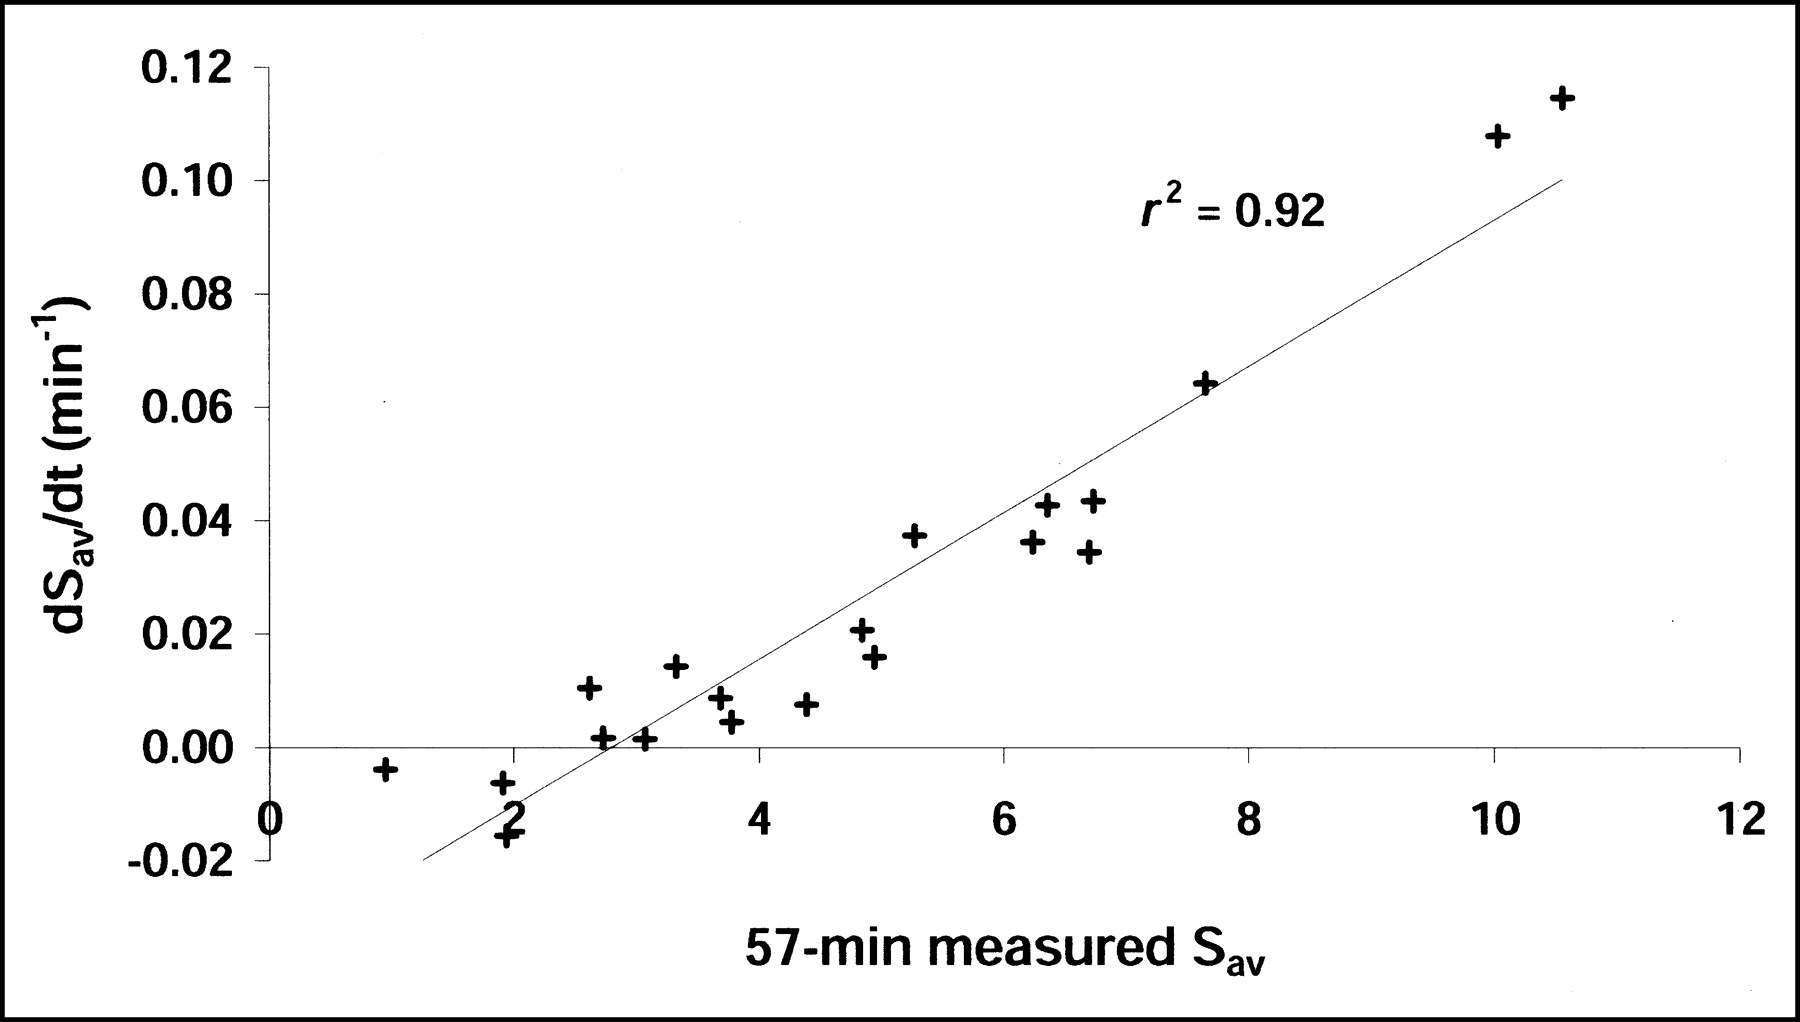
Table 1 displays correlation results between the rate of SUV change and SUVs measured at different times after injection, with and without blood glucose correction applied. Figure 3 shows graphically the correlation result at 57 min after injection for the Sav without glucose correction. These findings suggest that the rate of SUV change over time can be approximately predicted from an instantaneous SUV measured at 27–75 min with a simple linear model. The correlations were slightly better for the SUV at later time points. In other words, the rate of SUV change was more accurately predicted as the time from injection increased.

Rate of average Sav change vs. measured Sav at 57 min. SUV measurements were not corrected for plasma glucose concentrations.
Linear Correlation Regression Results (Eq. 4) for SUV Rate of Change vs. SUVs at Different Reference Times (t0)
Linear Model and Approximate Comparison Method
Assuming a linear increase in SUV over time we have:
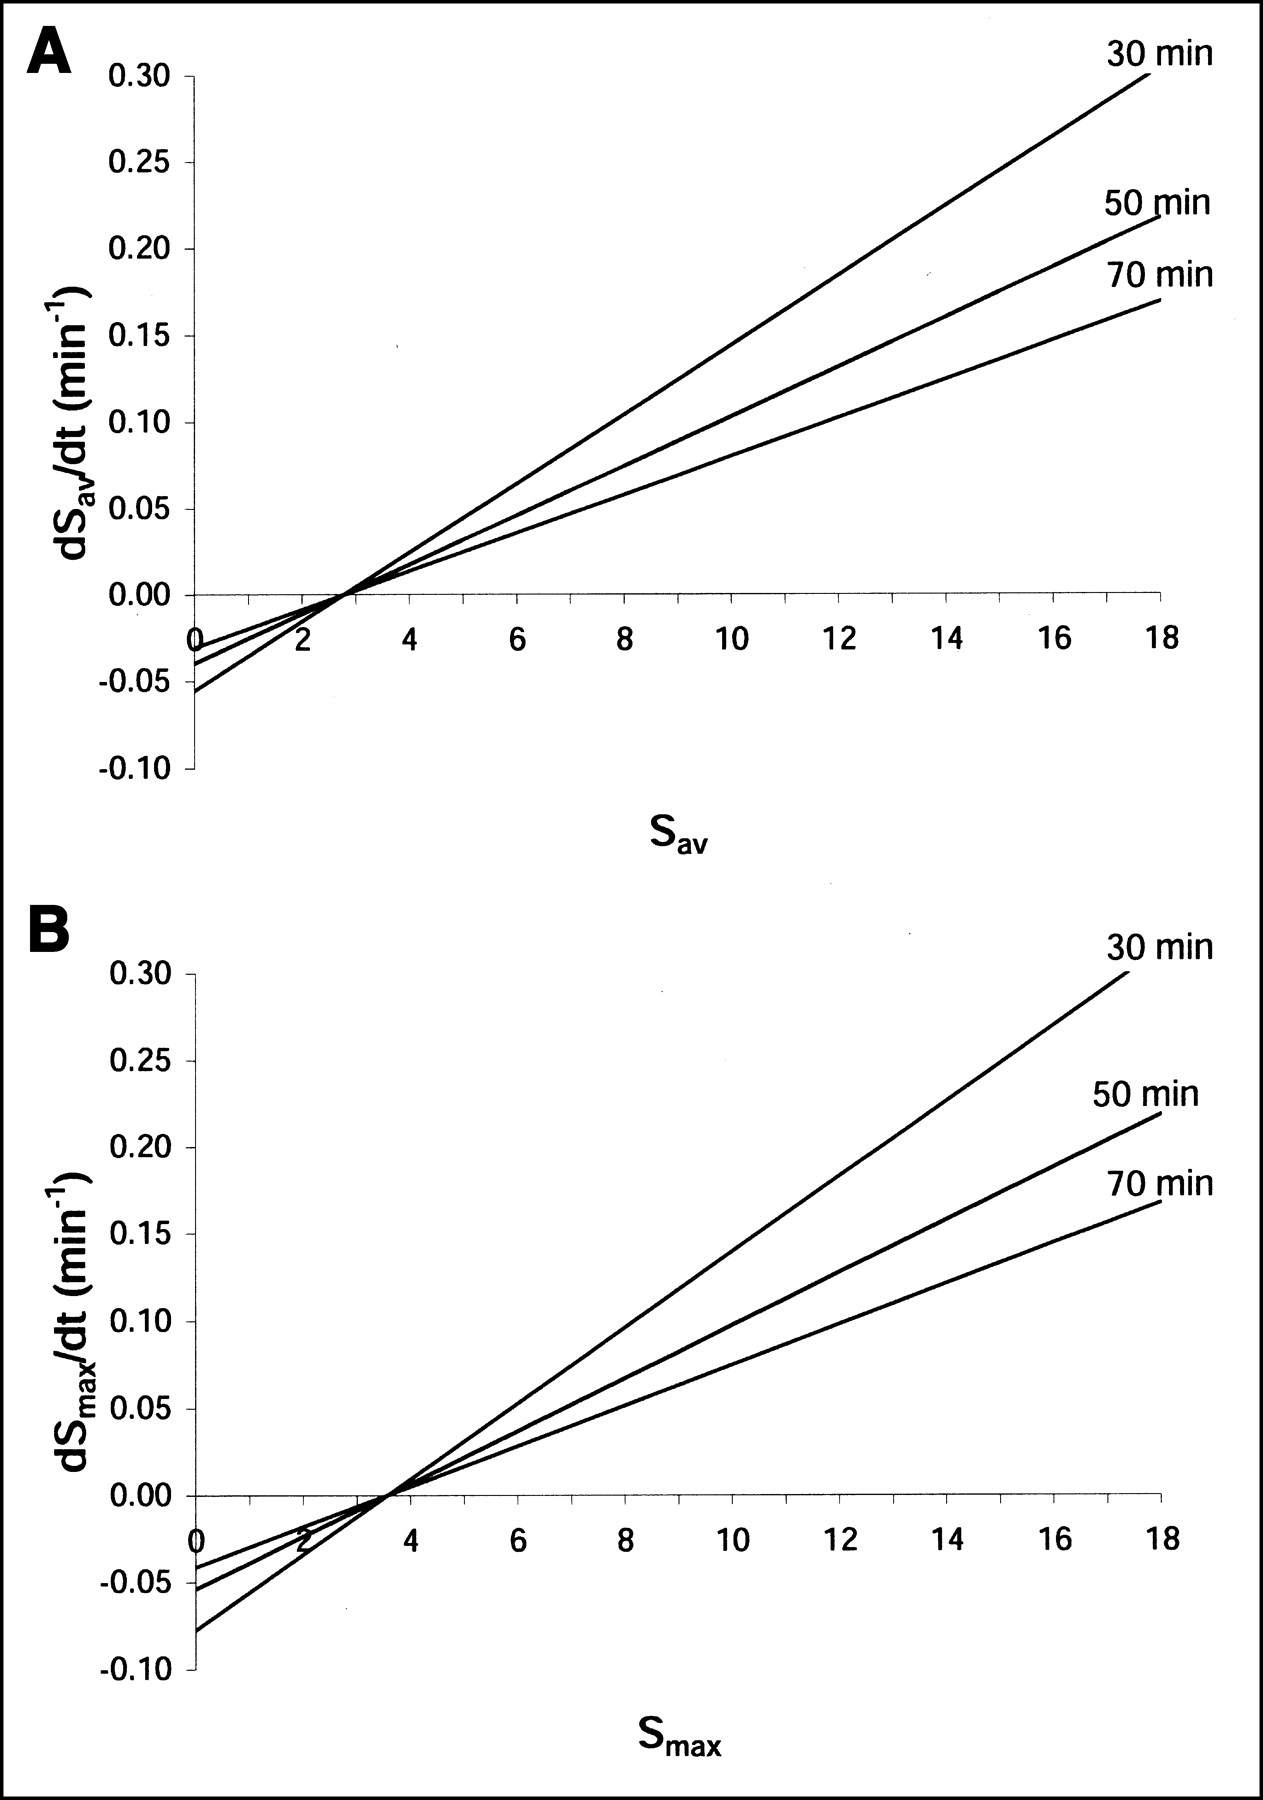
 Eq. 3 where S̃2 is the estimated SUV at a desired time t2, S1 is the measured SUV at time t1, and dS/dt is the rate of SUV change at the measurement time t1 for SUV, S1. The value for dS/dt can be obtained from the plots of the linear fits of dS/dt versus S in Figure 4 for the measurement time, t1.

Rate of SUV change vs. SUV at single time point for different single uptake time points: glucose-corrected Sav (A) and glucose-corrected SUVmax (B). These plots can be used to compare SUV measured at different times between studies.
Alternately, if we also assume that at a fixed reference time, t0, the rate of change depends linearly on the SUV at that time, t0, then:
 Eq. 4 where a and b are intercept and slope constants. These constants were estimated from the measured data and are listed in Table 1 for different reference times (t0). In the range of approximate linear behavior there is only 1 line that connects (S1, t1) and (S2, t2) (Fig. 5). This line will also have a unique value S0 at the reference time t0, for which the slope of the line is known (Eq. 4 and Table 1). Because dS/dt = a + bS0 = (S1 − S0)/(t1 − t0), straightforward rearrangement leads to S0 = (S1 − a[t1 − t0])/(1 + b[t1 − t0]), thus:
 Eq. 5 This can be used with Equation 3 to estimate the SUV at any other time in the range of approximate linear behavior. For example, a tumor having a glucose-corrected Smax of 9.0 at 42 min will have a 0.11 min−1 rate of Smax change over time, dSmax/dt (given by Eq. 5 and by a and b in Table 1), and the estimated Smax for comparison at 72 min will be ∼12.3. We note that, in principle, any reference time can be used for the values a and b. Alternately, the approximate value for dS/dt can be found graphically using Figure 4.

Illustration of proposed SUV correction method where SUV increases linearly with time, and rate of change (dS/dt) at any fixed time increases linearly with SUV value (S) at that time (dashed lines). From any measured point, a desired point can be extrapolated by use of a predetermined reference point as given in Equations 3 and 5 and Table 1.
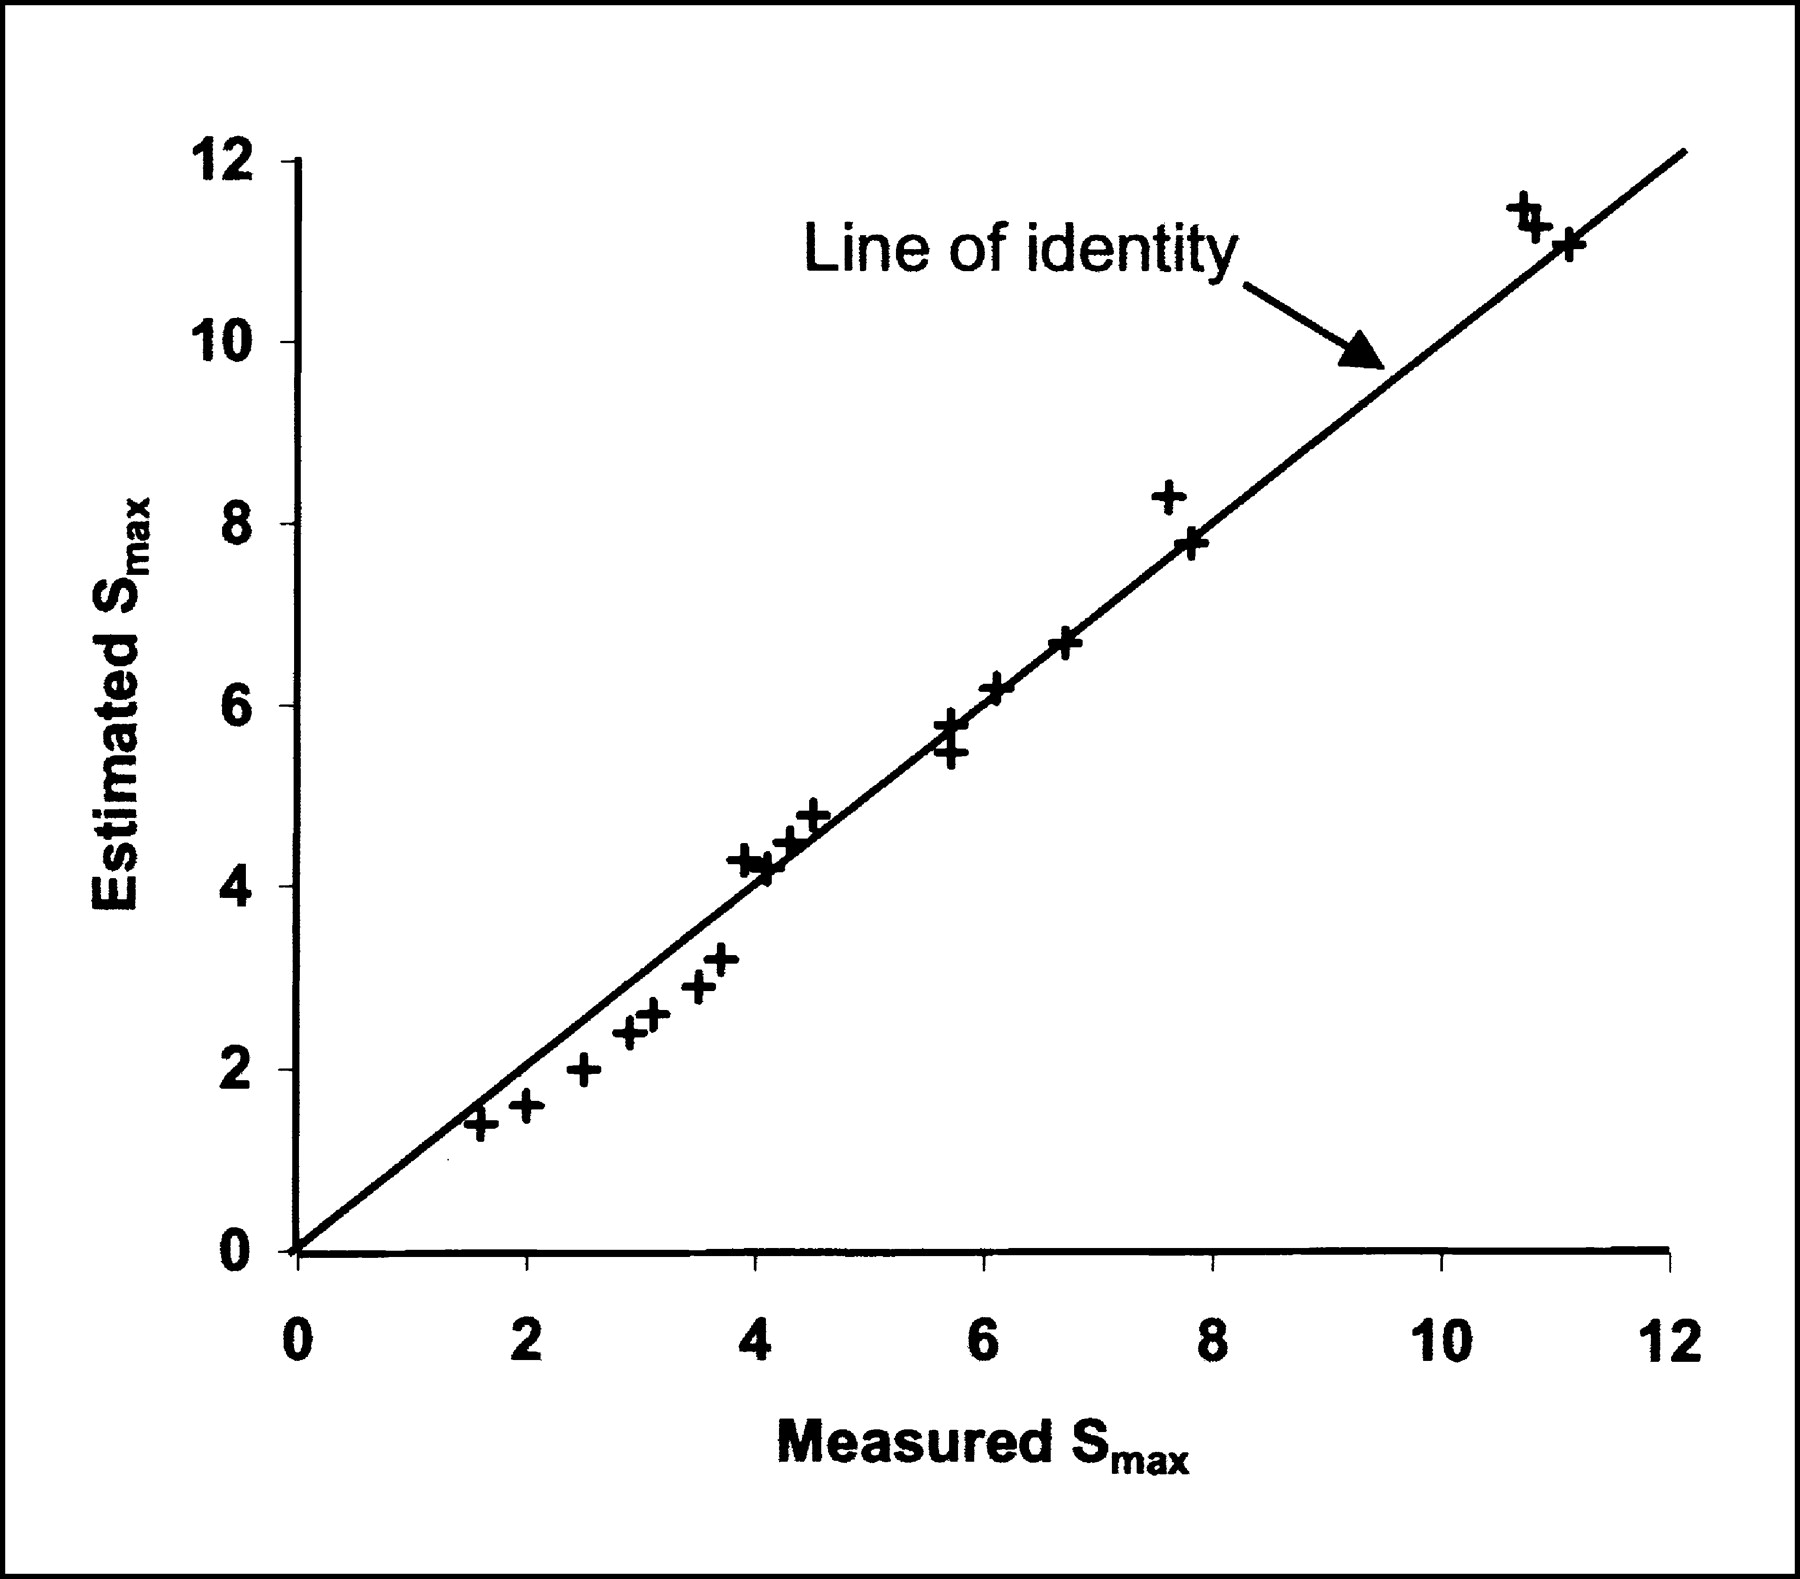
Figure 6 shows the results of testing our method on a second, independent set of 20 locally advanced breast cancer lesions in patients not included in the initial analysis and imaged using the same protocol. The estimated Smax (S̃2) at 71–75 min after injection using the comparison method at a reference time (t0) equal to 57 min and a measured Smax (S1) at 45 min (t1) was compared with the measured Smax at 71–75 min. Table 2 shows the average percent error on the Smax and Sav measured at 71–75 min. The comparison method was most accurate for SUVs (both Smax and Sav) higher than 5. For SUVs lower than 5, the comparison method had an average percent error comparable to simply ignoring the effect of differences in injection time. As expected, the method performed better (lower average percent error) using Sav due the significantly higher intrinsic statistical noise of Smax as compared with Sav.

Estimated Smax at 71–75 min after injection (using Eq. 3) compared with measured value at 71–75 min for 20 additional locally advanced breast cancer lesions in patients not included in original analysis.
Average Percent Error
DISCUSSION
We described the SUV change over time after injection up to 75 min in locally advanced breast cancer. These tumors exhibit a wide range of 18F-FDG uptake, as reported (9). Within the 27- to 75-min time interval, however, we found 2 levels of approximate linearity. First, we found that the 18F-FDG change over time was approximately linear or, at least, that a linear model would be good enough within the specific interval to be used as a basis for our comparison method. We emphasize that the overall time–activity curves of 18F-FDG uptake are not linear. The behavior in the time interval from approximately 27–75 min, however, was well described by a linear fit in all 40 cases studied. As a second level of linearity, we found that the level of 18F-FDG uptake and the rate of change in 18F-FDG uptake over time are approximately linearly correlated. Tumors with low uptake can have SUVs that increase little with time or even decrease slightly, whereas tumors with high uptake can have a 20%–25% increase in SUV in only 15 min. This could be a significant confounding factor for using 18F-FDG PET to follow response to therapy if injection to imaging time varied. Thie et al. (8) pointed out that sequential scans should be compared on the basis of the midpoint of the acquisition duration (frame). This applies to both dynamic (single bed position) and whole-body (multiple bed positions) studies, where there can be a significant difference between the start and end times. We agree that this is important, given the magnitude of SUV change over time observed with breast cancer in our study.
It is notable that some tumors in our series with lower metabolic activity undergo a small decline in SUV over time. This could potentially confound dual time point imaging protocols used to distinguish a tumor from inflammatory or benign processes (14,15), because some tumors with lower uptake may have a late uptake-to-early uptake ratio less than unity and would be falsely considered benign.
The wide variation in SUV change among locally advanced breast cancer stresses the importance of consistently acquiring images at the same time after injection. However, in a busy PET service, this is not always possible to achieve. A literature survey of articles published since 1990 was conducted that showed considerable variability of SUV measurement time after injection even within protocols at the same institution (8). A corrective method to standardize the time of SUV estimation would increase the clinical usefulness of SUVs.
The strong linear correlation between the rate of SUV change and the SUV measured at different times after injection is in accordance with the findings of Thie et al. (8), who suggested that more metabolically active tissues can show steeper time–activity curve slopes. This information can be used to compare the SUV for varying times of uptake by using the linear model and Equation 3. The approach proposed here using Equations 3 and 5 (or Fig. 4) can be used as a simple tool to compare SUV for imaging time variations and to guide clinical interpretation of SUV. The linear model was validated for SUV from 2 to 12 measured between 27 and 75 min and, thus, our method may not apply to tumors with SUVs outside this range or with injection to scan time outside of the specified interval. As shown by the average percent error (Table 2), the comparison method is more useful for SUVs in the upper range (>5) and performed better using the Sav as compared with the Smax. For SUVs in the lower range (<5), the rate of SUV change over time and, thus, the absolute SUV change will be small and adjustment using our method is unnecessary. The accuracy of this comparison method also depends on the uncertainty on SUV measurements, which is larger, while using Smax as compared with Sav.
Some additional sources of variability need to be considered in applying the proposed comparison method. If the method were to be used with tumors of <2 cm in size, underestimation of the SUV due to partial-volume averaging would lead to underestimation of the rate of SUV change over time. Similar to the glucose correction, the use of a different normalization factor (lean body weight or surface area) would simply rescale the SUV versus time curve on the y-axis in a given patient without changing the shape of the curve. Therefore, a similar empirical linear model could be applied to SUV normalized with lean body weight or surface area.
Our model assumes that the SUV curves are approximately linear within the specified time interval. However, the shapes of SUV curves may be different for other types of tumors, which will affect the approximation. For example, tumors having a significant FDG dephosphorylation rate may have significant deviation from linearity of their SUV curves within the time interval studied. Similarly, the shapes of SUV curves may change after treatment (as shown in lung cancer (7)). Consequently, our comparison method may not necessarily apply to tumor types other than breast cancers or to treated breast tumors.
Future studies should examine SUV time dependency in a variety of treated and untreated tumors to refine such a comparison method. Also, studies using kinetic analysis in breast cancer may be helpful to understand the underlying biologic characteristics that explain the 2 levels of approximate linearity observed in our study in the specified time interval.
CONCLUSION
Given the magnitude of SUV change over time in untreated, locally advanced breast cancer, variations in time after 18F-FDG injection can be a major confounding factor for patient-to-patient comparisons and follow-up comparisons for a single patient. The time dependency of 18F-FDG SUV (7) stresses the importance of consistently acquired images at the same time after injection. However, if this cannot be achieved in a busy PET department, an empirical SUV comparison method to adjust for differences in the time of uptake based on a linear model appears feasible. More studies are needed before this method can be applied to other tumors, treated tumors, or imaging time beyond 75 min.
Acknowledgments
The authors acknowledge the support of the University of Washington Radiochemistry Group for isotope production; Dr. Thomas Lewellen and Mr. Steven Kohlmeyer for tomograph support; University of Washington PET technologists for technical assistance with the imaging studies; Dr. Janet Eary and Kenneth Krohn for helpful comments; Mimi Shurts for patient care coordination; the late Dr. Aaron Charlop for long-time collaboration; and the physicians and staff of the University of Washington Breast Cancer Specialty Clinic for help with patient referrals. This study was supported by National Institutes of Health grants CA72064, CA42045, and CA74135.
Footnotes
Received Nov. 1, 2002; revision accepted Mar. 21, 2003.
For correspondence or reprints contact: David A. Mankoff, MD, PhD, Division of Nuclear Medicine, Box 356113, University of Washington Medical Center, 1959 N.E. Pacific St., Seattle, WA 98195.
E-mail: dam{at}u.washington.edu
REFERENCES
In this issue


Jump to section
Related Articles
Cited By...
- Quantitative Assessments of Tumor Activity in a General Oncologic PET/CT Population: Which Metric Minimizes Tracer Uptake Time Dependence?
- Principles of Tracer Kinetic Analysis in Oncology, Part II: Examples and Future Directions
- Principles of Tracer Kinetic Analysis in Oncology, Part I: Principles and Overview of Methodology
- Multicenter Clinical Trials Using 18F-FDG PET to Measure Early Response to Oncologic Therapy: Effects of Injection-to-Acquisition Time Variability on Required Sample Size
- PET Tumor Metabolism in Locally Advanced Breast Cancer Patients Undergoing Neoadjuvant Chemotherapy: Value of Static versus Kinetic Measures of Fluorodeoxyglucose Uptake
- Time Course of Tumor SUV in 18F-FDG PET of Breast Cancer: Presentation of a Simple Model Using a Single Reference Point for Time Corrections of Tumor SUVs
- The XbaI G>T Polymorphism of the Glucose Transporter 1 Gene Modulates 18F-FDG Uptake and Tumor Aggressiveness in Breast Cancer
- Tumor Metabolism and Blood Flow Changes by Positron Emission Tomography: Relation to Survival in Patients Treated With Neoadjuvant Chemotherapy for Locally Advanced Breast Cancer
- Dual Time Point 18F-FDG PET Imaging Detects Breast Cancer with High Sensitivity and Correlates Well with Histologic Subtypes
- Consensus Recommendations for the Use of 18F-FDG PET as an Indicator of Therapeutic Response in Patients in National Cancer Institute Trials
- Simplified Quantification of Pittsburgh Compound B Amyloid Imaging PET Studies: A Comparative Analysis
- Potential of Dual-Time-Point Imaging to Improve Breast Cancer Diagnosis with 18F-FDG PET
- Reproducibility of 3'-Deoxy-3'-18F-Fluorothymidine MicroPET Studies in Tumor Xenografts in Mice
- Progress and Promise of FDG-PET Imaging for Cancer Patient Management and Oncologic Drug Development
- Application of Intravenous Contrast in PET/CT: Does It Really Introduce Significant Attenuation Correction Error?
- Understanding the Standardized Uptake Value, Its Methods, and Implications for Usage