


Abstract
The current perception of using contrast-enhanced CT (CECT) for attenuation correction (AC) is that of caution, as it might lead to erroneously elevated 18F-FDG uptake on the PET scan. This study evaluates in vivo whether an intravenous iodinated contrast agent produces a significant AC artifact in the level of standardized uptake value (SUV) changes in PET/CT. Methods: Fifty-four patients referred for whole-body (WB) PET/CT scans were enrolled and subdivided into 2 groups. In part I, 26 patients had a single WB PET scan that was corrected for attenuation using noncontrast and intravenous CECT obtained before and after the emission data, respectively. The final PET images were compared for any visual and SUV maximum (SUVmax) measurement difference. This allowed analysis of the compatibility of the scaling processes between the 2 different CTs and the PET. The SUVmax values were obtained from ascending aorta, upper lung, femoral head, iliopsoas muscle, spleen, liver, and the site of pathology (total, 193 regions). Part II addressed whether intravenous contrast also influenced the PET emission data. For that purpose, the remaining 28 patients underwent a limited plain CT scan from lung base to lower liver edge, followed by a 1-bed PET scan of the same region and then a WB intravenous contrast CT scan in tandem with a WB PET scan. SUVmax values were obtained at the lung base, liver, spleen, T11 or T12 vertebra, and paraspinal muscle (total, 135 regions). The data obtained from pre- and post-intravenous contrast PET scans were analyzed as in part I. Results: There was no statistically significant elevation of the SUV level in the measured anatomic sites as a whole (part I: mean SUVmax difference = 0.06, P > 0.05; Part II: mean SUVmax difference = −0.02, P > 0.05). However, statistically significant results as a group (mean SUVmax difference = 0.26, P < 0.05)—albeit considered to be clinically insignificant—were observed for areas of pathology in the part I study. No abnormal focal increased 18F-FDG activity was detected as a result of the intravenous contrast in both parts of this examination. Conclusion: No statistically or clinically significant spuriously elevated SUV level that might potentially interfere with the diagnostic value of PET/CT was identified as a result of the application of intravenous iodinated contrast.
Intravenous iodinated contrast is widely used in routine CT. Its application in PET/CT, however, is a subject of dispute, as there is concern that it could introduce artifacts into the PET images (1–7). This concern is theoretically justified as the algorithms that convert the CT attenuation coefficients measured at a range of 40–140 keV to the 511-keV values for emission data correction were developed and validated mainly for human tissue densities (1,8). Overcorrection had been observed in cortical bone (1), metallic implants (9,10), and intravenous iodinated contrast agents (2,3). Overcorrection may lead to diagnostic and quantitative inaccuracy (6). In the case of the intravenous contrast agents, such overcorrection is due to the high atomic number of iodine, which produces disproportionately high attenuation coefficients at the currently used CT energies. Applying the normal transformation formula (which was not designed for contrast-enhanced CT [CECT] data) to the CT transmission scan might overcorrect the attenuation value at 511 keV, creating errors in the final PET images. However, the exact amount of quantification error (best represented by the level of standardized uptake value [SUV] changes) generated in PET/CT and the potential contaminating effect of the intravenous contrast on the PET emission data have not been established in humans.
This study evaluates in vivo whether the routine dosage of intravenous iodinated contrast produces clinically significant attenuation correction (AC) artifacts, either visually or quantitatively, in the PET emission images.
MATERIALS AND METHODS
Patient Demographics
The study enrolled 54 patients who required PET/CT for staging of known malignancy or for follow-up of treatment. Diabetic patients, asthmatic patients, and patients with other contraindications to iodinated contrast or who had a recent whole-body (WB) CECT scan were excluded. They were further subdivided into 2 groups. Part I included 12 males and 14 females (total, 26) with an average age of 48.8 y (range, 13–70 y) and an average weight of 56.5 kg (range, 38–87 kg). Part II included 11 males and 17 females (total, 28) with an average age of 52.0 y (range, 26–80 y) and an average weight of 56.7 kg (range, 34–116 kg). Informed consent was obtained from all patients.
Patient Preparation
The injection dose of 18F-FDG ranged from 375 to 629 MBq in adults. The dose was weight adjusted in children (5.3 MBq/kg). Every patient fasted for at least 6 h before the examination and had a blood sugar level ranging from 3.3 to 7.4mmol/L before administration of the tracer. All subjects were instructed to rest comfortably for 60 min and empty the bladder before scanning.
Imaging Protocol
The study was performed in 2 steps. Part I was designed to assess whether CT transmission data would introduce changes in PET emission data in both normal tissue and pathologic tissue when intravenous contrast was present. Patients first had a WB noncontrast CT (NCCT) scan from the base of the skull to the upper thigh (30 mA × 0.5 s; 5-mm slice thickness, 4.25-mm slice spacing, 512 × 512 matrix, and a pitch factor of 6). A WB PET scan of the same region followed (4-min emission time per bed, 4.25-mm slice thickness, and 128 × 128 matrix), which finally was followed by a second WB CECT scan. One hundred milliliters of Iopamiro 300 (Bracco), containing 300 mg of iodine per milliliter, were injected with a mean flow rate of 2 mL/s by an automatic injector (Nemoto). CT commenced at 50 s after injection of the contrast agent to produce venous phase images, which carried the most diagnostic information (2,11). The parameters of the CECT were similar to the NCCT except for higher milliamperes (250 mA × 0.8 s) and a lower pitch factor of 3, as high-resolution CT was a requirement in our institute. The PET emission data were reconstructed twice, once with the NCCT (PET 1) and again with the CECT (PET 2).
Part II, which followed, was designed to investigate whether the preinjected intravenous contrast agent has a deleterious effect on PET emission data acquisition, reflected by the variation in the SUV and Hounsfield unit (HU) measurements. To derive closely compatible PET sequences quickly (thus, avoiding 18F-FDG decay) and with acceptable radiation exposure, an initial NCCT scan was performed from the lower lung to the tip of the liver. This dataset was used to correct a 3-min single-bed PET scan (PET 3) of the same area. Then CECT from the base of the skull to the upper thigh was performed, using the same intravenous contrast agent and protocol as in part I. This provided reconstruction for the subsequent 3-min-per-bed WB PET scan (PET 4). In essence, 2 sets of emission data 20 min apart were obtained from 2 CT attenuation correction.
Data Acquisition and Processing
The PET/CT scans were performed on a Discovery LS scanner (General Electric Medical Systems). The detailed specification of the scanner, mode of operation, and scaling process used to generate attenuation values to correct PET data are reported elsewhere (8,12). In summary, the PET emission map was acquired in 2-dimensional mode and reconstructed with the standard General Electric software. The CT scans were performed as described. The resultant 512 × 512 matrix CT data were adjusted to the PET 128 × 128 resolution by smoothing with a gaussian filter of 8-mm full width half maximum (FWHM). A bilinear conversion algorithm matched to the kilovolt peak (kVp) setting of the CT scan (140 kVp in our case) was next used to transform the CT HU to the 511-keV attenuation coefficients. The calculation was based on the characteristics of air and water for HU < 0 and for water and human bone for values > 0. Adjustments are made at higher HU values up to 3,071 to take account of nonbiologic materials that may be present (8). The final PET emission map after AC was reconstructed with the ordered-subset expectation maximization method (2 iterations and 21 subsets). The corrected PET images (Figs. 1 and 2), CT images, and fusion images were evaluated in axial, coronal, and sagittal planes and in maximum intensity projections using the manufacturer’s review station (eNTegra).
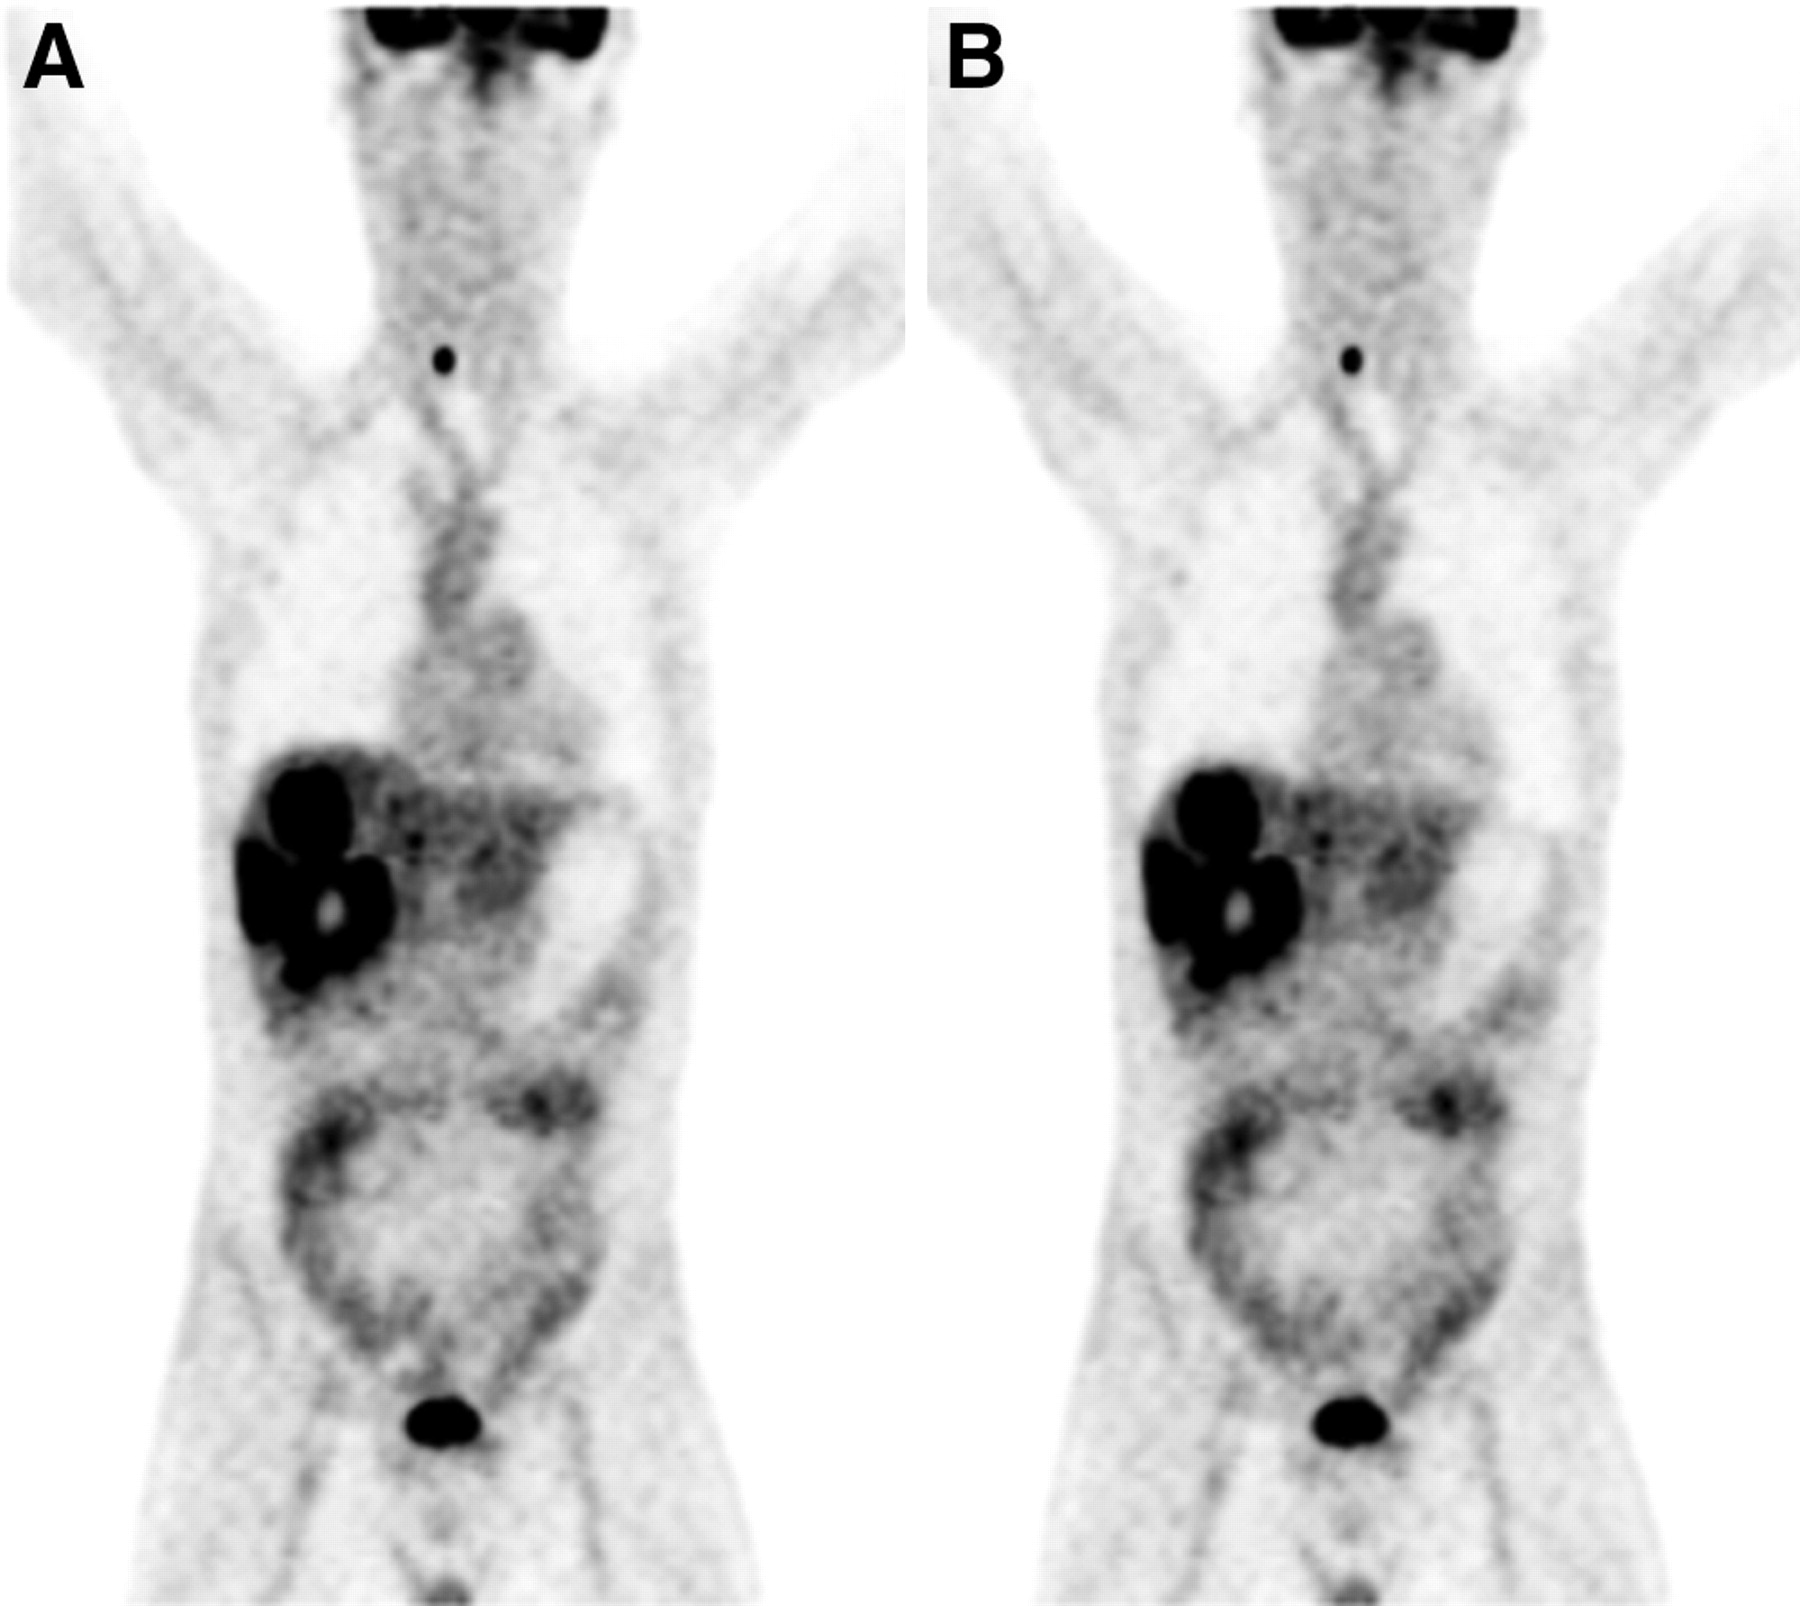
In part I, there was no visually mismatched 18F-FDG uptake in PET 1 (A) and PET 2 (B) from pathologic region.

In part II, there was no visually mismatched 18F-FDG uptake in PET 3 (A) and PET 4 (B).
In part I, 6 normal tissues representing different ranges of human tissue densities and 37 pathologies were assessed in 26 patients. A special effort was made to ensure anatomic consistency and to avoid contamination from adjacent activities:
Upper lobe of the right lung.
Lower pole of the liver (segment 6).
Ascending aorta above the carina.
Femoral head away from the bladder.
Iliopsoas muscle anterior to the femoral head.
Lower pole of the spleen away from splenic hilar vessels inflow and left renal activity.
Sites of pathologies consisted of:
Known primaries: 4 lung, 1 nasopharynx, 1 larynx, 1 ovarian, 1 uterine corpus, 1 endometrial, 1 retroperitoneal sarcoma, 1 colon.
Metastases: 7 neck nodes, 9 mediastinal nodes, 2 abdominal nodes, 2 lung, 4 bone, 2 liver.
As only a short body segment was imaged without contrast in part II, it was not possible to use the same range of tissue as in part I. However, similar rules applied in their selection:
Right lung base representing the lowest HU (mean HU, −783) in the group. The left lung base was used if pathology was present.
T12 vertebral body, which had the highest HU (mean HU, 313) in the tissues examined. T11 was used if there were excessive adjacent urinary activities. No vertebral venous plexus or collapsed vertebra was included in the measurements as they might give a falsely high bone density or SUV.
Segment 5 of the liver adjacent to the gallbladder, which belonged to the mid range of HU (mean HU, 90) in the studied group.
Lower pole of the spleen (mean HU, 87) with similar HU as liver.
Right paraspinal muscle, which had the second lowest HU of the entire group and was sampled (mean HU, 50) in the same slice as the thoracic vertebra.
The right side was arbitrarily selected in bilateral structures except when pathology was present. SUVs normalized to body weight were calculated using the following formula:

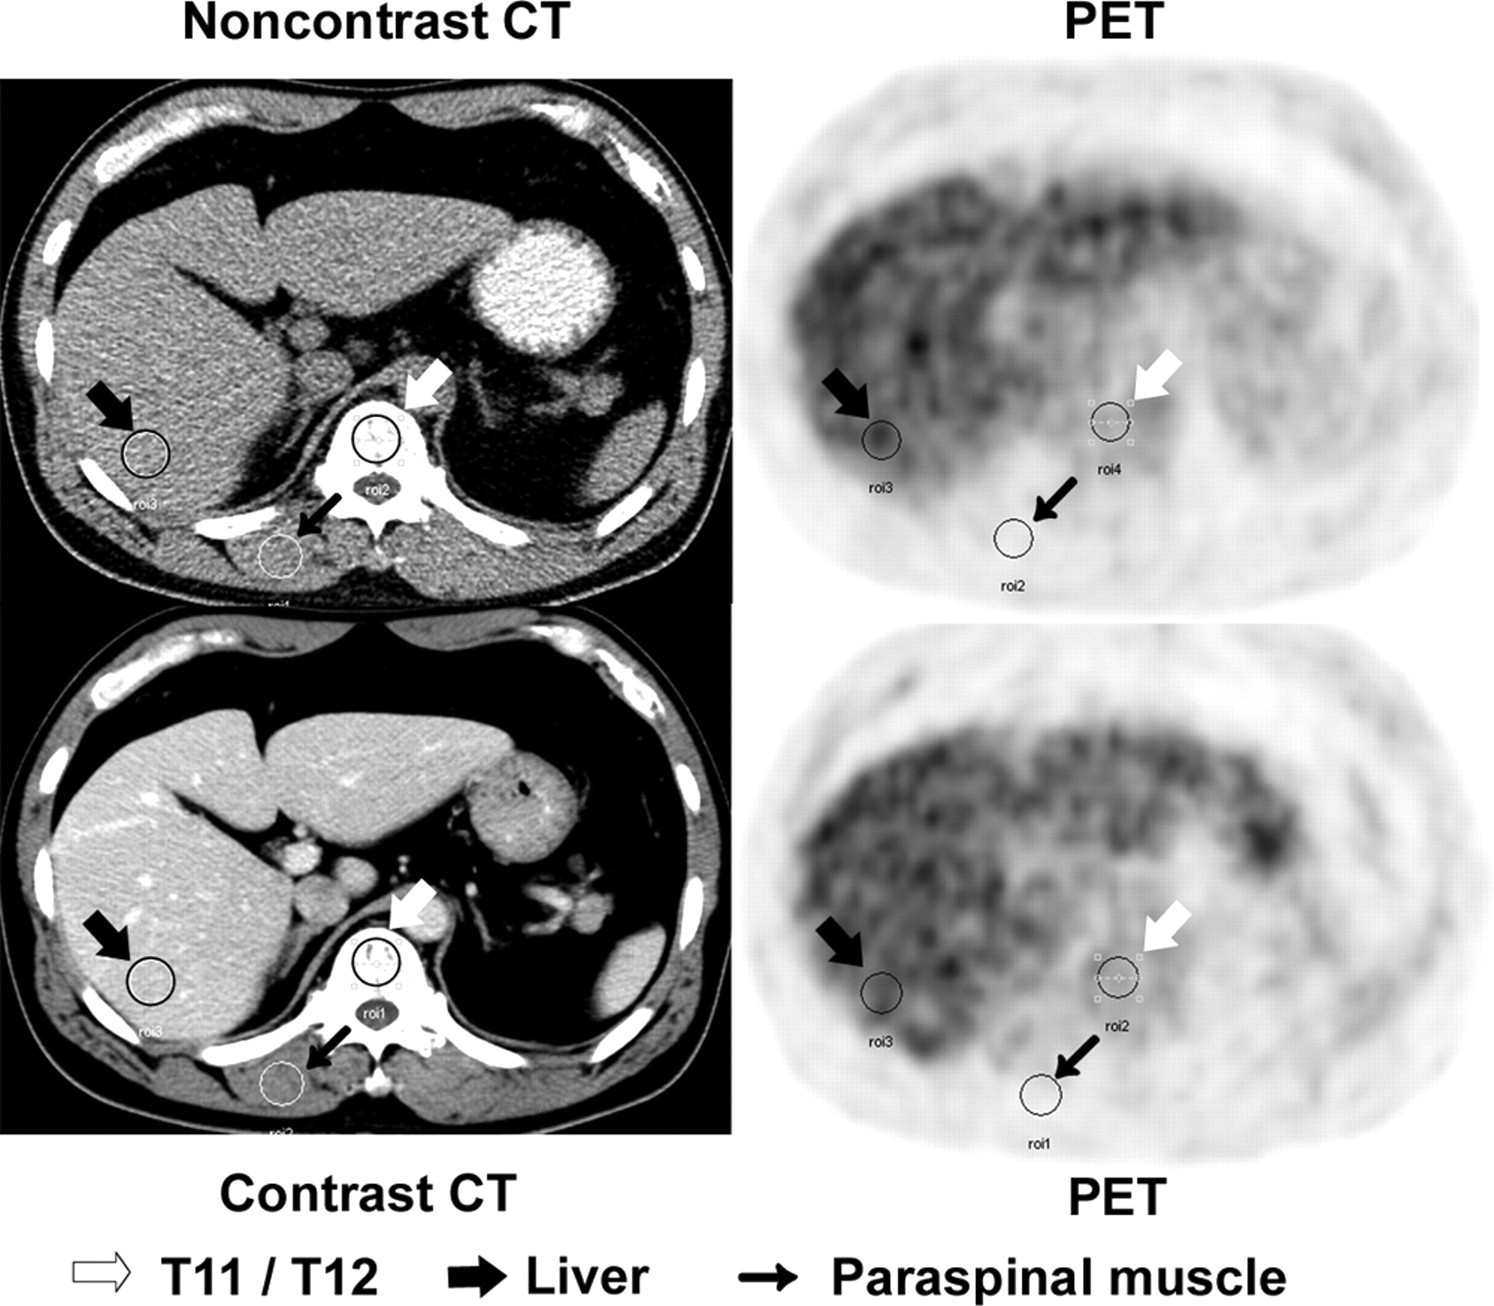
Only pathologic tissues ≥2 cm were measured so that underestimating the metabolic activity of lesions <2 FWHM of the scanner did not occur. A circular region of interest (ROI) of size 30 pixels was placed on the identical axial location of the PET and CT scans using a “copy-and-paste” tool on the eNTegra fusion workstation. The noncontrast images were matched with the contrast images by using a CT anatomic road map for a compatible ROI selection (Fig. 3). The SUV maximum (SUVmax) and HU in normal and pathologic tissues were recorded by 2 operators independently. The highest SUVmax was selected. If the difference is >20%, the measuring process should be done again.

Representative images of sampling method using ROI copy-and-paste method for CT and PET with and without intravenous contrast to reproduce same site. Three different arrows are used to demonstrate ROI selection.
Data Analysis
Each patient in both parts of the study generated 2 sets of corrected PET images: 1 with contrast and 1 without. These pairs were compared visually for unmatched uptake by a physician experienced in PET scan interpretation.
In part I, a paired t test was performed on the altered SUVmax values (noncontrast to contrast) obtained from the normal tissues as a group and then each tissue (spleen, aorta, and so forth) separately. This was repeated in the pathology section. In part II, a paired t test was performed on all regions together and each anatomic region separately. The SUVmax values for each region in each patient were also compared with the HU in the contrast studies, and the change in SUVmax (noncontrast to contrast) was compared with the change in HU (noncontrast to contrast). For each ROI in both parts of the study, the SUVmax of the contrast study was plotted and joined by a line to the SUVmax of the corresponding noncontrast. The relationship between the change of HU and body weight was next assessed. Statistical significance was assumed when the P value < 0.05 for both parts.
RESULTS
No severe side effect or problem requiring medication as a result of intravenous administration of contrast agent was experienced by the patients in the study. Appreciable motion artifacts or misplaced CT and PET images were not detected in the noncontrast and contrast studies. Using noncontrast PET/CT as the gold standard, there was no visual difference in the form of unmatched 18F-FDG uptakes between the PET images obtained with or without contrast (Figs. 1 and 2). No spurious accumulation of the 18F-FDG was observed.
Part I
The paired t test of the 156 (26 × 6) normal tissue regions as a group showed no significant SUVmax elevation between the emission data corrected with CECT and those with NCCT. The mean SUVmax changes between the 2 groups was <1%. When the regions were analyzed separately, 3 tissues showed significant differences: spleen (Fig. 4A), liver (Fig. 4B), and ascending aorta. The liver had the highest values, with the highest SUVmax elevation of 0.54 (13%) and a mean SUVmax difference of 0.16 (Table 1).

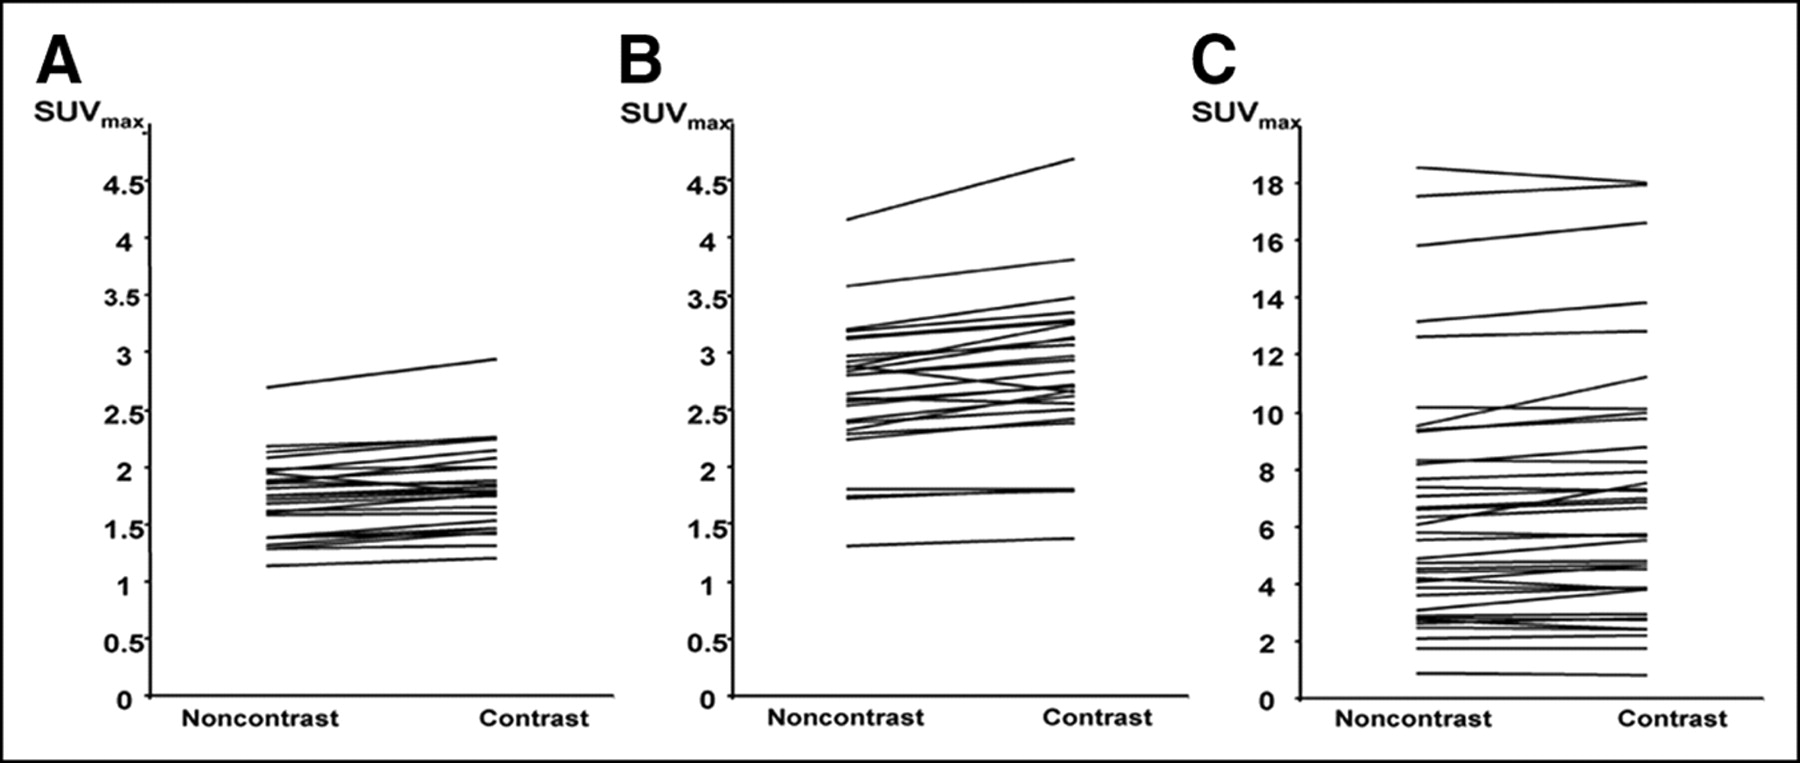
Representative graphs of SUVmax of target tissues derived from NCCT and CECT in part I. Spleen (A), liver (B), and pathology (C) showed significant upward trend.
Analysis of SUVmax Derived from CECT and NCCT Studies of Part I in Normal Tissue and Pathology
When the pathologic regions were treated as a single group (37 regions), there was a significant difference (P < 0.05) between the contrast and noncontrast SUVmax (Fig. 4C). The mean SUVmax difference was 0.26 (Table 1). When the tumor groups were subdivided according to areas of involvement and reexamined with the paired t test, only the group of mediastinal nodes demonstrated a significant difference, giving a mean SUVmax difference of 0.46. The highest SUVmax difference of this nodal group was 0.78.
Part II
No neoplastic tissue was evaluated in part II. The paired t test of the entire group of normal tissues did not reveal any significant difference between the noncontrast and contrast studies (Table 2). When the tissues were subdivided and reanalyzed, only the thoracic vertebra achieved a statistically significant paired t test result, but the mean SUVmax difference was very small (0.06 or 3%). The contrast-induced changes in the SUVmax also occurred equally in both directions (Fig. 5).
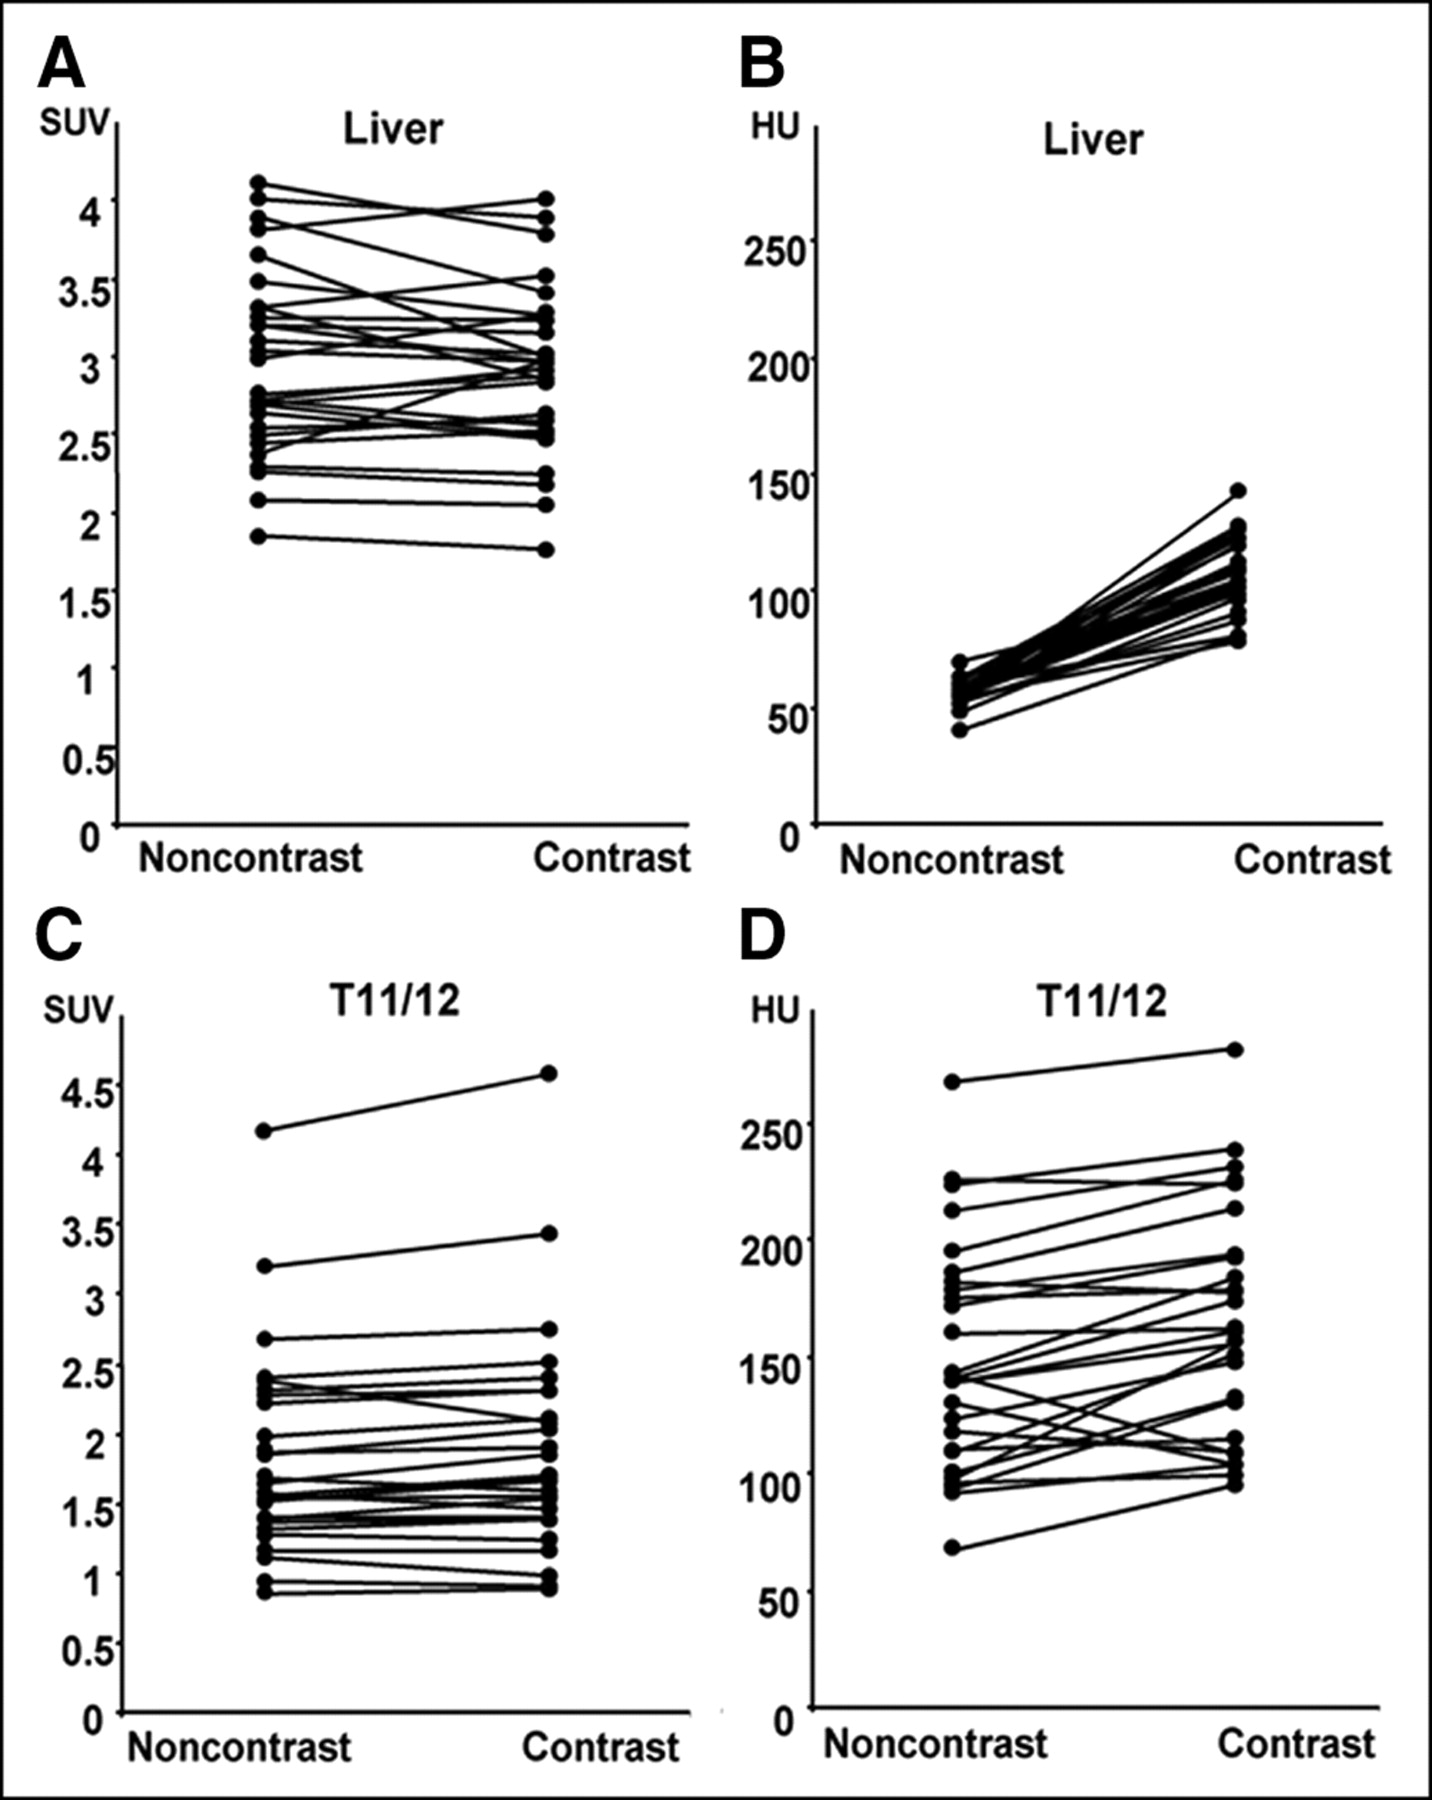
Part II: correlation between SUVmax and HU in noncontrast and contrast studies from 2 representative tissues. (A) SUV graph of liver: statistically insignificant tissue had numerous decreasing lines with contrast. (B) HU graph of liver revealed obvious upward trend. (C) SUV graph of T11/T12, statistically significant tissue, generally showed upward trend. (D) HU graph of T11/T12 exhibited random upward and downward trend.
Comparison of SUVmax and HU Derived from CECT and NCCT Studies of Part II
As the scaling process relied heavily on the HU, its interrelationship with SUVmax after intravenous contrast was next assessed. All 135 regions showed a rise in the HU in CECT and this was statistically significant (Table 2). It was highest in compacted vascular tissues such as liver (140%) and spleen (98%), which had the greatest amount of iodine delivery and concentration at the time of scanning (Table 2). The HU elevation was lowest in lung (−3%), as it had much more air than blood despite of its dual vascular supply. Similarly, the thoracic vertebra, which consisted primarily of bone matrix and bone marrow rather than blood, only achieved a mean elevation of 16 HU (10%) after contrast (Table 2). The patient’s body weight also affects HU through alternation of contrast agent concentration and distribution. The increase in HU was greatest for smaller patients. This is illustrated in Figure 6A. Figure 6B shows a plot of the change in SUV against the change in HU induced by intravenous contrast. There was poor correlation between the difference in HU and the difference in SUVmax.

(A) Relationship between body mass and HU of spleen. There was statistically significant rise in HU after intravenous contrast. Increase in HU was greatest for smaller patients. (B) Relationship between change in CT number (HU) due to contrast agent and effect on measured SUVmax in part II. There was poor correlation between difference in CT number and difference in SUVmax.
DISCUSSION
CT-based AC in combined PET/CT has resulted in a lower noise emission scan, faster examinations (thus, less motion artifact and higher throughput), greater topographic resolution, and more accurate localization and interpretation of functional abnormalities in a single setting (2,7,13,14). However, some pitfalls have been recognized (6,7,9,15,16). Because our clinicians also required a diagnostic CT scan as part of a combined PET/CT study, CT contrast agent was mandatory. Our concern was whether the use of contrast in such a setting would degrade the PET data. This study was performed to determine whether CT intravenous contrast agent would lead to inaccurate PET images, either visually or quantitatively, and whether it is acceptable to incorporate contrast in routine PET/CT protocols.
The first objective was addressed in part I of this study. It confirmed that physiologic tissues with a larger amount of intravenous contrast delivery (i.e., liver, spleen, and aorta) did produce a statistically significant elevated SUVmax in PET 2. This trend was not seen in less vascular or low-density tissues (Table 1). This finding agreed with previous reports that scaling error, although small (mean SUVmax difference, 5%–7%), occurred in areas of high iodine concentration during CT acquisition (2,3,5). When all normal tissues were assessed as a group, this significance was lost. This discordance suggested that the bias introduced by intravenous contrast was minute and easily absorbed in a larger sample size.
In clinical practice, pathologic tissues were the major interests. As they should theoretically enhance more than the background tissues due to neovascularization or increased perfusion (17–19), the resultant AC error would be greater and, thus, the effect on the SUVmax elevation was expected to be larger. This was indeed the case with thegroup of malignant lesions producing a statistically significant difference (mean SUVmax difference, 0.26 or 3.8%). Such mild elevation is probably not clinically relevant, as it should not create any diagnostic doubt or misinterpretation. The mediastinal lymph nodes were the only subgroup that showed statistical significance (mean SUVmax difference, 0.46 or 6%), whereas the others did not follow this trend. This finding could probably be accounted for by the small sample size (range, 2–11) and general small variations.
Part II of the study evaluated the possible influence of intravenous contrast on the emission data. The part I result had already pointed to a nondetrimental transformation error between CT and PET. It followed that if part II did not demonstrate the same pattern, statistical fluctuation of the emission data might be responsible. Overall, the SUVmax difference between PET 3 and PET 4 as a group was not statistically significant. This observation was also reported in the study of Antoch et al. (4) comparing PET corrected with NCCT and PET corrected with CECT in a small group of patients. When individual tissue types were assessed, the significant effect of the 3 well-perfused tissues (liver and spleen) seen previously was not reproduced. The most likely explanation of such conflicting results was that the second emission scan in part II, which was the major difference between part I and part II, had introduced new variables into the measurements. This was supported by Figure 5 in which very small SUVmax changes (range, 0.3–0.5) occurred in both positive and negative directions for most tissues (liver/T11–12) in both the noncontrast and contrast studies. This random fluctuation in part II was much greater than that in part I (Figs. 4 and 5).
The possible variables that may lead to such fluctuation in the emission data in part II include redistribution of 18F-FDG in the patient, redistribution of the intravenous contrast material, interaction between 18F-FDG and contrast material, significant patient motion between CT and PET scans, and the inherent imprecision of PET. The absolute effect of 18F-FDG redistribution was impossible to calculate, but it appears to be small, as evidenced by the overall small SUVmax change. The time lag between the noncontrast study (PET 3) and the contrast study of the same region (lung base to liver) was 15 min; hence, the contribution from 18F-FDG decay was not great. The SUV time adjustment was unnecessary, as the range of SUV was <5 (20). Patient movement between the CT and PET scans was not observed, as there was no significant mismatch on the fusion image or detected on the CT. Pharmacologic interaction between iodine and 18F-FDG appeared unlikely as the intravenous contrast agent was given after the 1-h uptake time and the washout of the intravenous agent from each tissue was rapid and no renal or hepatic impairment was noted in any of the patients.
PET is a low-photon-flux technique with a resulting large noise component, especially when compared with CT. Random statistical variations in the PET scan in the same patient alone were around 10% (21,22). Using a different AC algorithm could further alter the metabolic quantification (23,24). Although this was not the case in this study, it served to support the idea that imprecision is inherent in PET and might account for the discrepancy between the part I and part II data. In the clinical setting, as the mean SUVmax changes were small (range, 3%–6.6%) in the statistically significant tissues in the aorta of part I and T11/T12 of part II (Tables 1 and 2), the overall variation was as anticipated—barely noticeable either visually or quantitatively. This outcome was also observed in the study of Nakomoto et al. (2).
Because the conversion process in AC relied heavily on the lower end of the HU (8), the subsequent error, if it occurred, was directly linked to its elevation. Factors that would influence the HU between the 2 scans warrant some consideration. They include contrast dose, contrast injection rate, time between iodine injection and CT, and contrast volume distribution. The first 3 factors were constant as part of our radiology department protocol, which closely followed literature recommendations (25). They were also considered to be insignificant for the following reasons. The iodinated contrast dose was maintained at 3 g (100 mL of 300 mg of iodine/mL) for all patients. The injection rate and volume were also kept at the low end of the conventional range for diagnostic CT to prevent excessive elevation of HU in the sites measured. The 50-s time lag should minimize any fluctuation on HU change in the same tissue. This leaves contrast volume distribution in patients without renal function impairment as the most important variable, and this was heavily dependent on body weight (26,27). As anticipated, there was an inverse relationship between HU and body weight due to the dilution effect of the contrast agent in heavier patients (Fig. 6A). However, a positive relationship between the change in SUVmax and the change in CT number was not found (correlation coefficient = −0.09; Fig. 6B). This is a key finding, which suggests that whatever variations in SUV were seen in this study, the contrast material did not generate a consistent error in SUV (Fig. 5). The patient population used in our study had a very light weight (mean, 57 kg), which equated to a larger quantity of contrast agent per volume compared with the Western population. With this higher contrast volume, one would expect to see a greater difference in SUVmax values than that in a population of greater weight, but in vivo this effect was not seen. Because there was a time lag of 15 min between PET 3 and the liver region of PET 4, progressive 18F-FDG accumulation was possible, albeit not proven, and thus has been corrected.
It was harder to explain the surprising result from the relatively less vascular thoracic vertebrae as pathologic processes were not involved. Although the marrow had its own circulation and vascularity, the perfusion status was not responsible for the statistical significance of the spinal data in part II. This was supported by the data in Table 2, as there was only a mild increase of the CT number after intravenous contrast (a change of 16 HU). The mean HU of marrow (148 HU before contrast vs. 164 HU after contrast) is well below the cortical bone value and would not have produced a significant scaling error on its own. Exaggerated marrow metabolism also did not occur, as none of our patients had granulocyte colony-stimulating factor, which might have produced such a result (28). The hemopoietic marrow can have an 18F-FDG uptake that is moderate to occasionally intense (29). Because there was a time lag of 15 min between PET 3 and the liver region of PET 4, progressive 18F-FDG accumulation was possible but could not be proven and, thus, corrected. A concrete explanation for the significant spinal SUVmax changes was not found and awaits further study. Since the mean change in SUVmax was small (3%), misinterpretation of abnormality would be unlikely.
In practical terms, all emission images were of diagnostic quality (PET 1–4). Even the highest mean level of SUVmax increase in normal tissues (0.12, or 6.6% in aorta) and pathologic tissues (0.78, or 14% in liver metastasis) did not produce mismatched or spuriously high areas of 18F-FDG uptake on the PET images in part I or part II (Figs. 1 and 2). This visual impression was also observed by others (2,3). The highest SUVmax differences (particularly in malignant tissue) in both part I and part II are small compared with changes that would alter management in most clinical settings. In head and neck malignancy, the primary tumor generally had a mean SUV value of between 7 and 8 and metastasis had a value of 5.7 (30,31). A 0.78 alteration in the SUVmax difference in tumors with such a degree of 18F-FDG activity is minimal and, hence, would not alter a diagnostic decision. The percentage of SUVmax increase might appear high in some, but the corresponding absolute value was small (e.g., liver secondary 14%, or 0.78). The absolute number was more relevant, especially with low 18F-FDG uptake lesions. For assessing treatment efficacy, plain PET/CT often sufficed. If the metabolic abnormality completely resolved, the contrast issue would be irrelevant. For a partial responder, SUVmax measurement assumed a more critical role. The conventional threshold suggests that >25% increase from the baseline study after therapy indicates disease progression (32). If intravenous contrast was used in the PET/CT in both the pretreatment and posttreatment series, the SUVmax value could be compared directly. If one PET/CT study was performed with contrast and the other without, the 6.6% elevation of SUVmax should be taken into consideration (Table 1).
In the case of solitary pulmonary nodules and some nonlung lesions, the cutoff value of SUVmax to distinguish malignant from benign nodules (32,33) or to determine a more invasive approach (34) is 2.5. The addition of 0.26 (Table 1) in the borderline SUV might create a false impression. This mistake can be ameliorated by correlation with the clinical picture and the patient’s risk profile as well as the contrast enhancement pattern on the CT scan of the PET/CT (35,36).
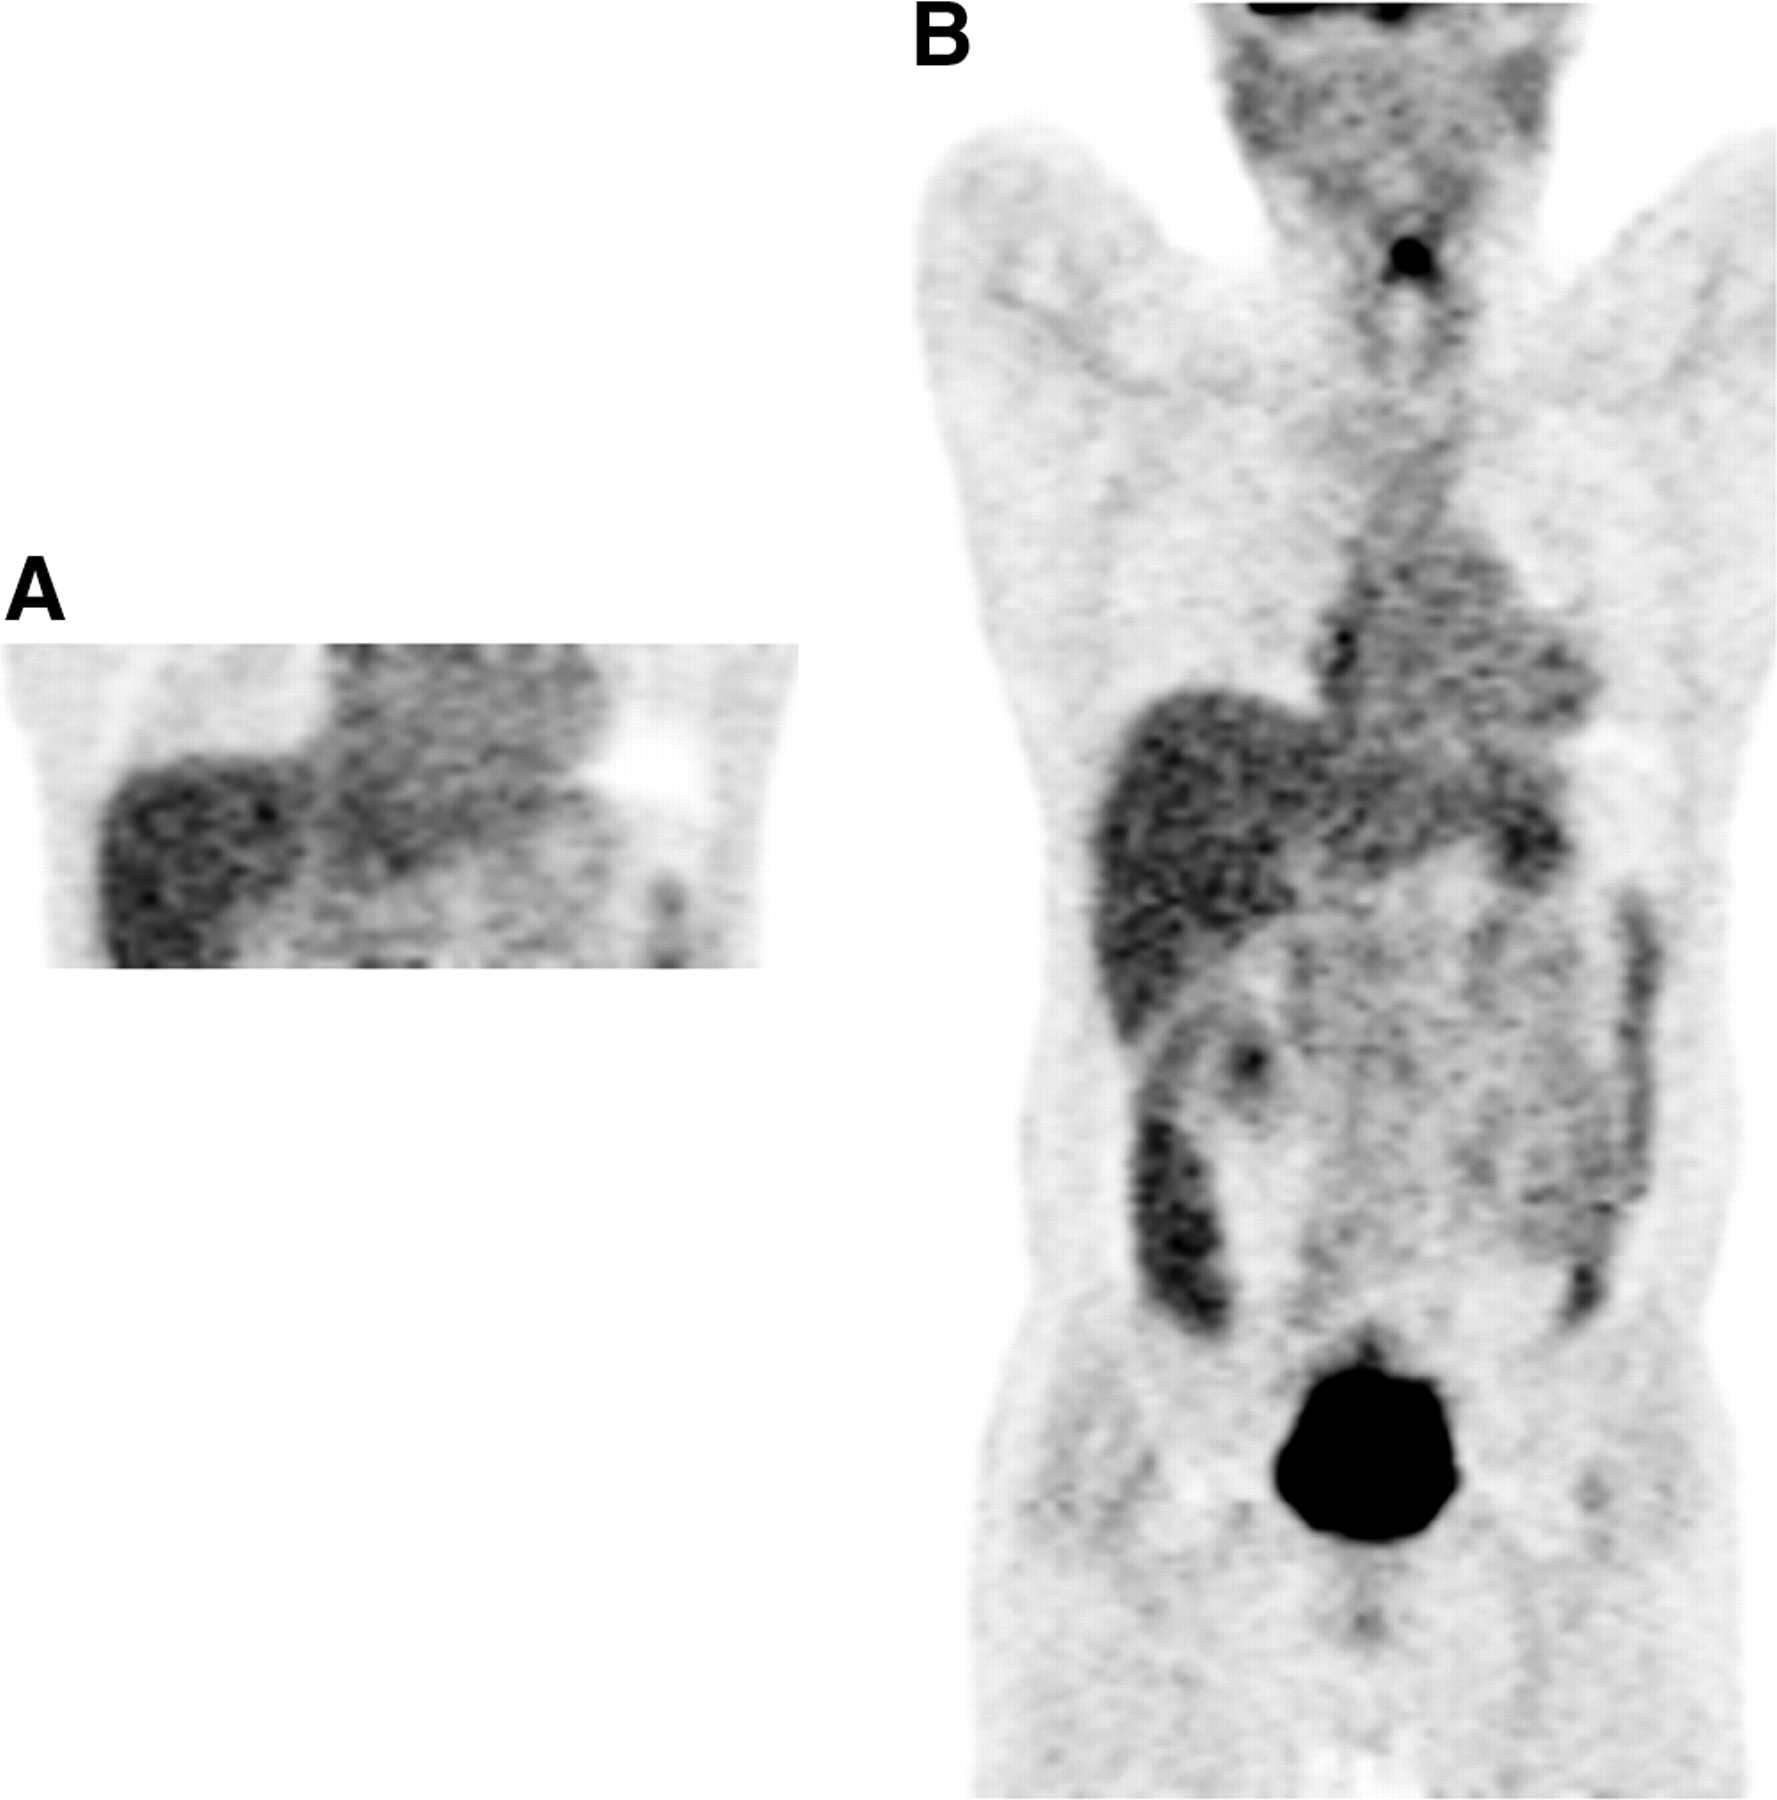
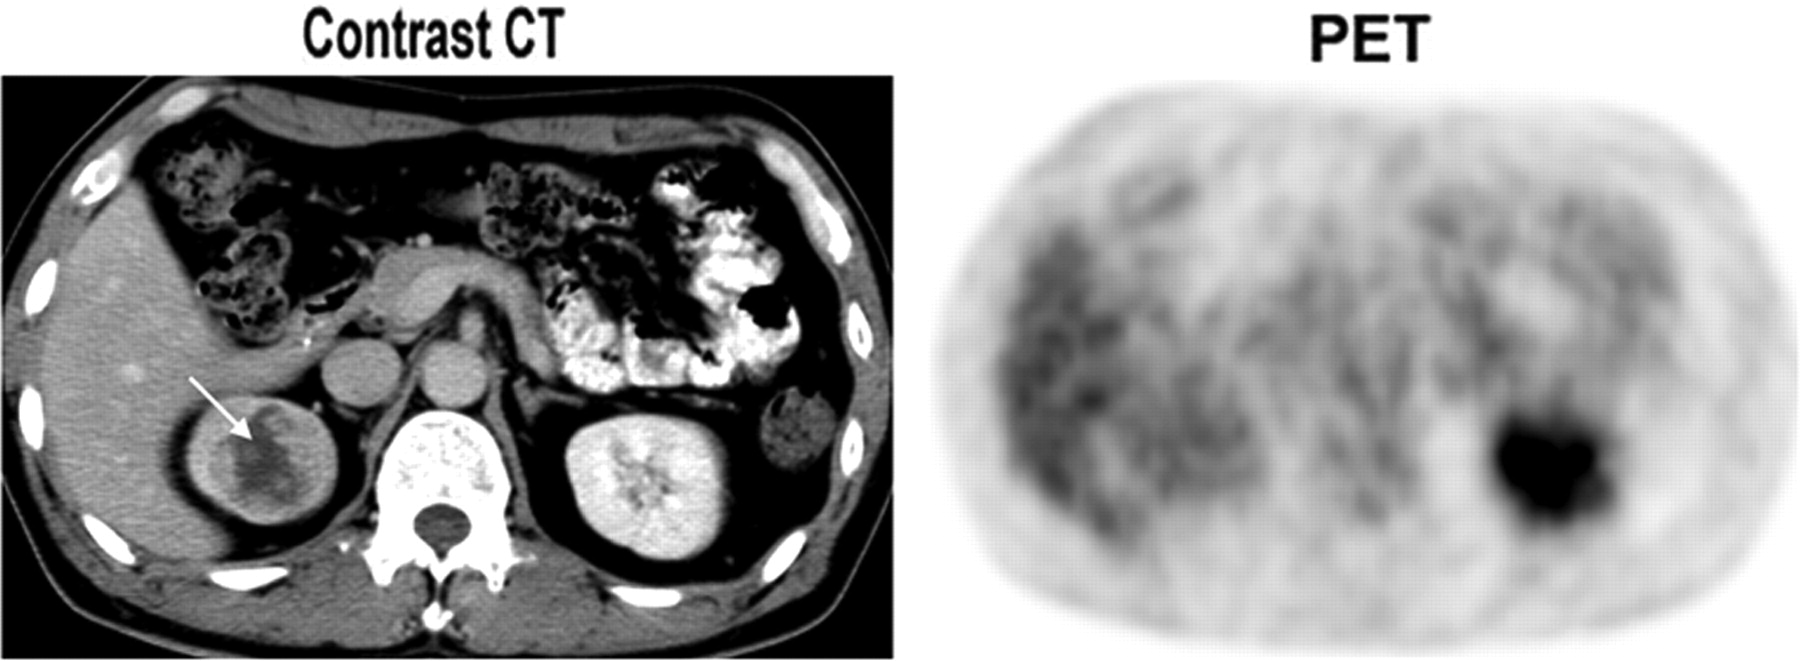
It has been suggested that intravenous contrast might increase the normal tissue SUV level, thereby lowering the target-to-background ratio and making detection of a relatively low-uptake tumor difficult. This suggestion is plausible and some evidence from animal experiments has been presented (2). However, our study indicates that there is only a modest increase in SUVmax for the normal tissues (0.16 in the liver, 0.12 in the ascending aorta, <0.09 elsewhere). This would be unlikely to lower the tumor-to-background ratio significantly to induce an interpretation error with the amount and concentration of iodine used in this study. Furthermore, the complementary role of dedicated CECT in PET/CT should be recognized (5,37). Additional morphologic information—such as volumetric tumor assessment critical for follow-up after therapy (31), detection of some tumors without significant 18F-FDG uptake (38) (Fig. 7), tumor perfusion imaging possibly replacing hepatocellular carcinoma imaging with dual 18F-FDG and 11C-acetate scans (39)—provides further justification of its use.

There was no significant 18F-FDG uptake in right kidney on PET image. However, right renal cell carcinoma (arrow) would have been easily missed without use of contrast in CT image.
Some limitations of this study must be mentioned. The sample sizes of pathologic tissues evaluated were too small to detect differences between the various pathologies. They were also not evaluated in part II, where any biologic influence of intravenous contrast might have been detected. The SUV is not a precise physiologic measurement, but it was selected in this study because it is the most widely used clinically. Nevertheless, the SUV is subject to influence from many factors, such as the injected dose of 18F-FDG, uptake time, blood glucose level, state of hydration, and body weight (40). As much as possible, these factors were controlled in this study, but both body weight and 18F-FDG dose varied significantly.
CONCLUSION
The use of intravenous contrast in a dedicated PET/CT system such as the amount used in this study does not introduce clinically relevant AC errors in the form of factitious 18F-FDG uptake. The subsequent small elevation of the SUVmax observed in this investigation would not be clinically deleterious in most instances. Thus, it is feasible to incorporate CECT as a routine protocol in PET/CT.
Acknowledgments
We thank Heyes Lau for technical assistance and are also grateful for the helpful advice from Dr. Albert Lonn from General Electrical Medical Systems (Milwaukee, WI).
Footnotes
Received Feb. 22, 2004; revision accepted Sep. 13, 2004.
For correspondence or reprints contact: Yat-Yin Yau, MD, Department of Nuclear Medicine, Hong Kong Adventist Hospital, 40 Stubbs Rd., Hong Kong, China.
E-mail: yyyau{at}hkah.org.hk
REFERENCES
In this issue


Jump to section
Related Articles
Cited By...
- 64Cu-DOTATATE PET in Patients with Neuroendocrine Neoplasms: Prospective, Head-to-Head Comparison of Imaging at 1 Hour and 3 Hours After Injection
- Quantitative Evaluation of Segmentation- and Atlas-Based Attenuation Correction for PET/MR on Pediatric Patients
- Evaluation of Diffusion-Weighted Magnetic Resonance Imaging for Follow-up and Treatment Response Assessment of Lymphoma: Results of an 18F-FDG-PET/CT-Controlled Prospective Study in 64 Patients
- 68Ga-DOTATOC Versus 68Ga-DOTATATE PET/CT in Functional Imaging of Neuroendocrine Tumors
- Low-Dose 18F-FDG PET/CT Enterography: Improving on CT Enterography Assessment of Patients with Crohn Disease
- Monitoring and Predicting Response to Therapy with 18F-FDG PET in Colorectal Cancer: A Systematic Review
- Measuring Response with FDG-PET: Methodological Aspects
- Tissue Classification as a Potential Approach for Attenuation Correction in Whole-Body PET/MRI: Evaluation with PET/CT Data
- Integrated PET/CT in the staging of nonsmall cell lung cancer: technical aspects and clinical integration
- The impact of 18F-FDG PET/CT on assessment of nasopharyngeal carcinoma at diagnosis
- Limitations of CT During PET/CT
- Effective Methods to Correct Contrast Agent-Induced Errors in PET Quantification in Cardiac PET/CT
- Detection of extrapulmonary lesions with integrated PET/CT in the staging of lung cancer
- Can PET/CT Replace Separate Diagnostic CT for Cancer Imaging? Optimizing CT Protocols for Imaging Cancers of the Chest and Abdomen
- Monitoring Cancer Treatment with PET/CT: Does It Make a Difference?
- The 2006 Henry N. Wagner Lecture: Of Mice and Men (and Positrons)--Advances in PET Imaging Technology
- PET/CT in Lymphoma: Prospective Study of Enhanced Full-Dose PET/CT Versus Unenhanced Low-Dose PET/CT
- Reply: Adequate Evaluation of Image Registration in Hybrid PET/CT.
- Procedure Guideline for SPECT/CT Imaging 1.0
- Procedure Guideline for Tumor Imaging with 18F-FDG PET/CT 1.0
- Optimized Contrast-Enhanced CT Protocols for Diagnostic Whole-Body 18F-FDG PET/CT: Technical Aspects of Single-Phase Versus Multiphase CT Imaging