


Abstract
We investigated the relevance of single-nucleotide polymorphisms (SNPs) in the glucose transporter 1 (GLUT1) gene to the uptake of 18F-FDG and tumor aggressiveness in breast cancer. Methods: In 52 individuals with breast cancer, a diagnostic PET/CT scan was obtained, and the standardized uptake value was determined as a measure of 18F-FDG uptake using a region-of-interest technique. Three GLUT1 SNPs (XbaI G>T, HpyCH4V A>T, and HaeIII T>C) were investigated in genomic DNA that was isolated from the paraffin-embedded specimens of all patients. Tumors were typed and graded according to the World Health Organization classifications. Results: The GG genotype of the XbaI G>T SNP was associated with increased tumor uptake of 18F-FDG, with a mean standardized uptake value of 11.7 (TT/GT genotypes, 5.9; P = 0.03). Furthermore, the GG genotype was positively related to enhanced tumor proliferation (mitotic count, P = 0.01). In line with this finding, the GG genotype was absent in grade 1 carcinomas and increasingly prevalent in tumors with higher malignancy (grade 2, 28.0%; grade 3, 50%; P = 0.04). Conclusion: This study found that the XbaI G>T SNP of the GLUT1 gene is associated with an increased 18F-FDG uptake and a more advanced tumor grade or growth in breast cancer. Thus, this genetic variant might favor aggressive phenotypes by modulating the efficiency of cancer cells to recruit glucose and escalate growth rate, suggesting the XbaI G>T SNP as a proliferation-related prognostic factor.
PET/CT using the glucose analog 18F-FDG provides an opportunity to gain both anatomic and metabolic information about a tumor. In breast cancer, 18F-FDG PET/CT is used for tumor detection, staging (1), and the assessment of tumor response to treatment (regression) (2). Because of the capability of rapidly growing cancer cells to increase glucose metabolism, 18F-FDG accumulates within tumor cells (3). Glucose metabolism in malignant cells is generally enhanced by an increase in glycolysis, even under aerobic conditions, a process known as aerobic glycolysis or the Warburg effect (4). A positive correlation between tumor 18F-FDG uptake and tumor aggressiveness has been shown in a variety of tumors, including breast cancer (5).
The uptake mechanism and biochemical pathway of 18F-FDG have been extensively studied in vitro and in vivo, and the transport of 18F-FDG through the cell membrane via glucose transport proteins and intracellular phosphorylation by hexokinase have been identified as key steps for subsequent tissue accumulation of the tracer.
The glucose transporter 1 (GLUT1) is the most ubiquitously distributed isoform of GLUT in the human body because it is expressed on the surface of virtually all cell types, including mammary glands (6). Glucose transport by GLUT1 is driven by a gradient across the cell membrane and is not dependent on insulin.
Most human malignancies overexpress GLUT family members (7), which are present in the respective tissue of origin under noncancerous conditions. Especially, the class I transporters (GLUT1 and, to a much lesser extent, GLUT3) are most frequently overexpressed in cancer cells and positively correlate to several unfavorable tumor characteristics and 18F-FDG uptake in breast cancer (8) and various other malignancies (9,10). The class II (fructose) transporter GLUT5 and the class III molecule GLUT12 were discovered on human breast cancer cells (not in normal breast tissue), suggesting fructose as an alternative energy source and GLUT12 as an alternative transporter to GLUT1 in breast cancer (11,12). GLUT1 overexpression is not usually seen on normal epithelial tissue or benign epithelial tumors (13).
Single-nucleotide polymorphisms (SNPs) are variations of the DNA sequence occurring when a single nucleotide of the genome differs between members of a species. This minor variance of the DNA sequence may influence the development of certain diseases or the response to pathogens, drugs, or other agents. Accordingly, SNPs of the GLUT1 gene, which is located on chromosome 1p35-p31.3, have been shown to be associated with the risk of diabetic nephropathy (14,15), vascular calcifications (16), and renal carcinoma (17). However, the possible functional influence of GLUT1 SNPs on 18F-FDG uptake, as determined by PET or by tumor aggressiveness, has not been investigated in human cancer thus far. Several SNPs have been associated with breast cancer risk (18), but the sole relationship between a human SNP to 18F-FDG uptake in breast cancer was demonstrated for the 936C>T SNP of the vascular endothelial growth factor (VEGF) gene (19). Because the vascular endothelial growth factor gene has a predominant role in tumor angiogenesis, this genetic variant was thought to be linked to an altered formation of tumor vessels, with consecutive changes in the efficiency of blood and glucose supply.
With regard to the eminent role of GLUT1 in 18F-FDG uptake, the aim of this study was to investigate the impact of 3 previously reported GLUT1 SNPs—XbaI G>T (rs2754218), HpyCH4V A>T (rs710218), and HaeIII T>C (rs1385129), which have been shown to influence different pathologic processes in vivo (14–17)—on 18F-FDG uptake and tumor aggressiveness in breast cancer.
MATERIALS AND METHODS
Patients
This retrospective study comprised 52 Caucasian individuals with primary breast cancer, who were treated at the breast cancer center of the University Hospital of Essen, University of Duisburg-Essen, Essen, Germany, during 2006–2009 (Table 1).
Patient Characteristics
18F-FDG PET/CT
All patients were instructed to fast for 6 h before intravenous administration of approximately 270 MBq of 18F-FDG. Patients with a blood glucose level exceeding 150 mg/dL were not included in the study. Approximately 80 min after injection, whole-body PET/CT scans were obtained using a PET/CT system (Biograph; Siemens Molecular Imaging). The system consists of a full-ring dedicated PET scanner and a 2-slice spiral CT scanner. The imaging protocol included patient preparation with 1,500 mL of a water-based oral contrast agent and an intravenous injection of 140 mL of contrast medium (Ultravist 300; Schering AG). A CT scan was acquired first (100 mAs at 130 kV), followed by a PET scan (3 dimensions; emission time, 4–6 min/bed position according to body weight). To avoid breathing-induced artifacts, a limited breath-hold technique was used (20). All images were reconstructed with a 5-mm slice thickness and 2.4-mm increment, using standard algorithms (for PET: attenuation-weighted ordered-subset expectation maximization [AWOSEM], 2 iterations, 8 subsets).
Quantitative PET Measurements
The standardized uptake value (SUV) was determined in tumor tissue as a measure of 18F-FDG uptake using a region-of-interest technique. In detail, a circular region of interest was placed over the tumor in the slice with the maximum PET signal from the tumor. Within that region of interest, the pixel with the highest PET signal was determined and given as maximum SUV according to the following formula:
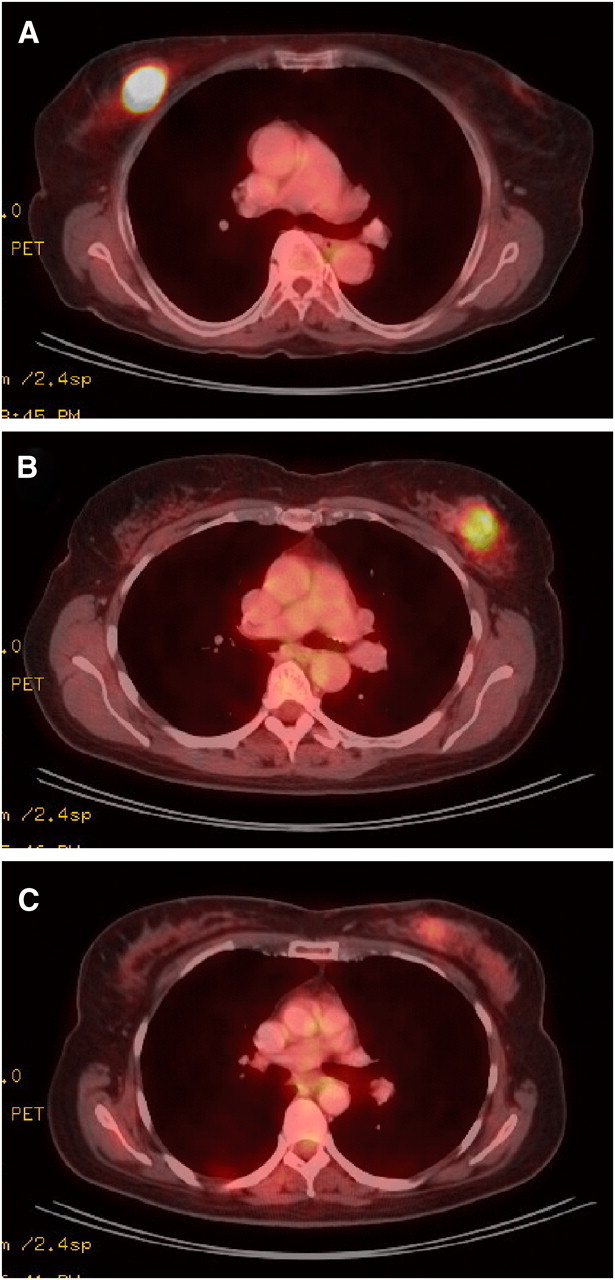
PET/CT images of 3 patients with invasive ductal breast carcinoma. (A) SUV, 41.8; tumor grade, 3. (B) SUV, 6.2; tumor grade, 2. (C) SUV, 2.9; tumor grade, 1.
Histopathology
Breast tumors were categorized using the latest World Health Organization classification of tumors of the breast and female genital organs. The semiquantitative histologic grading system by Elston and Ellis (23)—which is based on tubule and gland formation, nuclear pleomorphism, and mitotic count—was used. Mitoses/10 high-power fields (HPF) were counted, with an HPF area of 0.23 mm2 (Table 1), using an Olympus BX50 microscope (UplanFl ×40/0.75 objective).
Determination of GLUT1 Genotypes
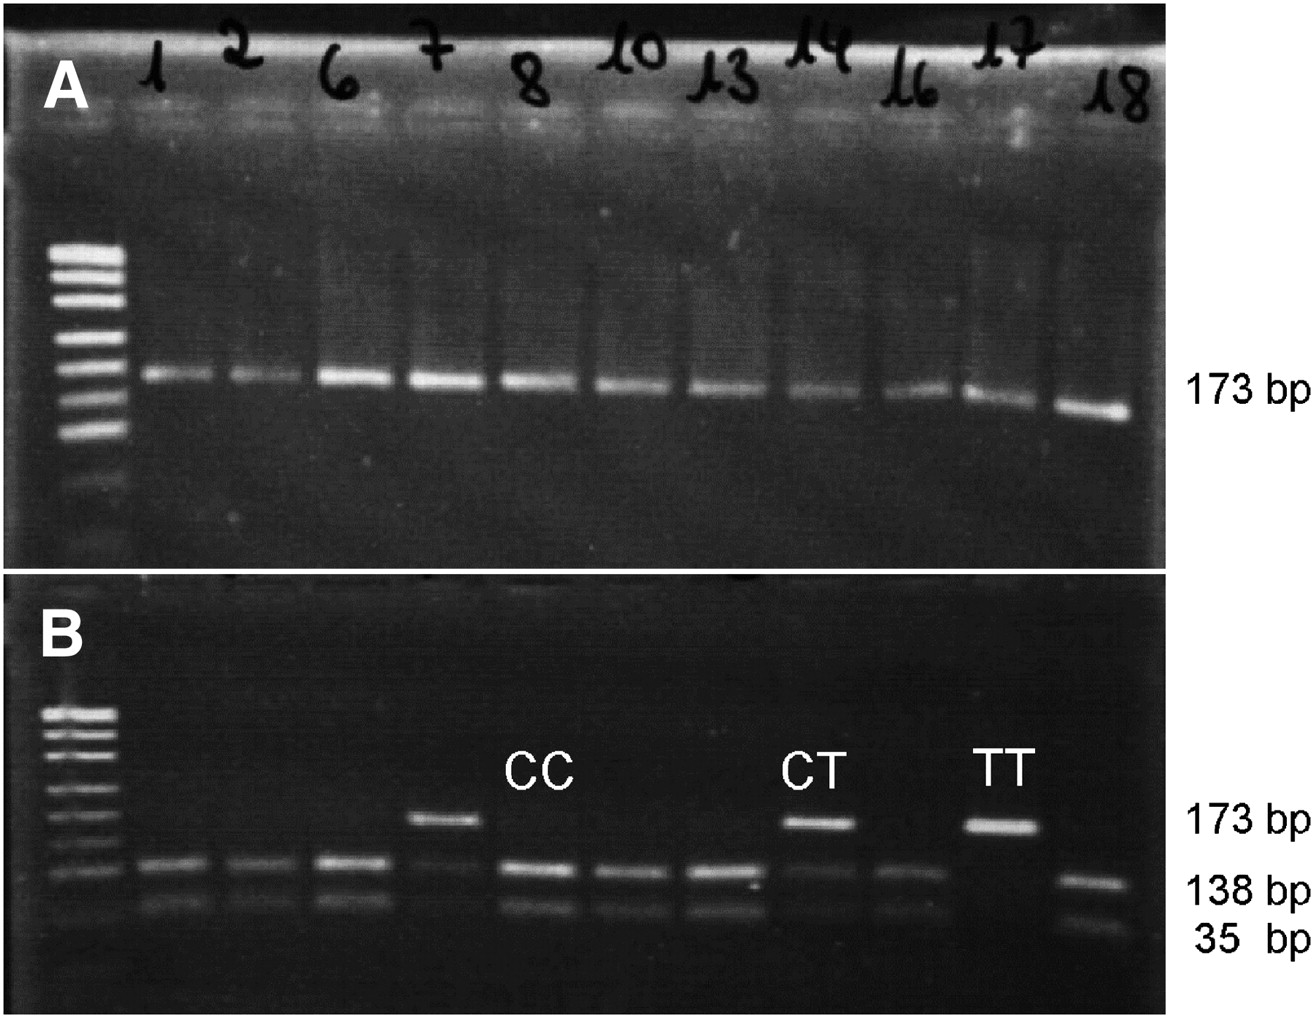
Genomic DNA was isolated from paraffin-embedded specimens. The samples were removed from paraffin by xylene–ethanol treatment. DNA was extracted using the QIAamp DNA Mini Kit (Qiagen), according to the manufacturer's protocol. The GLUT1 polymorphisms were analyzed as previously described (15–17). In brief, the polymerase chain reaction (PCR) products containing the polymorphic site were amplified using the primers listed in Table 2. PCR products were separated by gel electrophoresis (Fig. 2A), purified with the QIAquick PCR Purification Kit (Qiagen), and digested with the appropriate restriction endonuclease (New England BioLabs) (Table 2) for 210 min at 37°C. The result of the digestion was visualized by a gel electrophoreses (2% agarose) with ethidium bromide staining (Fig. 2B).

Representative agarose gel of the HaeIII T>C SNP investigation. (A) PCR products (uncut, 173 base pairs [bp]). (B) PCR products after purification and digestion with restriction enzyme HaeIII. CC = both alleles restricted (138 bp + 35 bp/138 bp + 35 bp); TT = both alleles not restricted (173 bp/173 bp); CT = only 1 allele restricted (173 bp/138 bp + 35 bp).
Primers and Restriction Enzymes
Statistics
Statistical analysis was performed using SPSS (version 15.0; SPSS Inc.) for Windows (Microsoft) and SAS (version 9.2; SAS Institute Inc.) for Windows. For comparison of SUV and mitotic count between genotype groups defined by SNPs, we used the t test after logarithmic transformation of both variables. This transformation rendered the respective skewed data distributions acceptably symmetric without long tails. P values from the 6 tests of SUV or mitotic count with respect to the 3 SNPs were adjusted for multiple testing according to Bonferroni adjustment (multiplication by 6). Bivariate associations were assessed using Spearman correlation, with the test for Spearman ρ = 0 or the Cochran–Armitage trend test as indicated in the text or figure legends. P values of 0.05 or less were regarded as significant.
This study was performed according to the guidelines of the Ethics Committee of the University Hospital Essen (Ethics Committee approval 09-4168).
RESULTS
Patients
The mean age of the patients was 55.6 y (age range, 25–78 y; SD, 13.39 y), and the average size of the tumors (measured during surgical dissection of 38 cases) was 27.7 mm (range, 4–85 mm; SD, 16.90 mm).
Histopathology
Most individuals (71.2%) had invasive ductal carcinoma (not otherwise specified). The tumors summarized under “other type” in Table 1 were 1 solid neuroendocrine, 2 apocrine, and 2 tubular carcinomas. The mean mitotic count was 20.0/10 HPFs (range, 1–112/10 HPFs; SD, 14.65). Further details are displayed in Table 1.
18F-FDG PET/CT
The mean SUV was 7.58 (range, 1.5–41.8; SD, 6.91). The mean tumor size assessed by PET/CT was 26.7 mm (range, 8–96 mm; SD, 15.27 mm). There was a clear correlation between pathologic and radiologic tumor size measurements (Spearman correlation, r = 0.60; P < 0.001). SUV and mitotic count were positively correlated (Spearman correlation, r = 0.61; P < 0.001). The average SUV increased with higher grades of malignancy (Spearman correlation, r = 0.412; P = 0.002; Fig. 3).
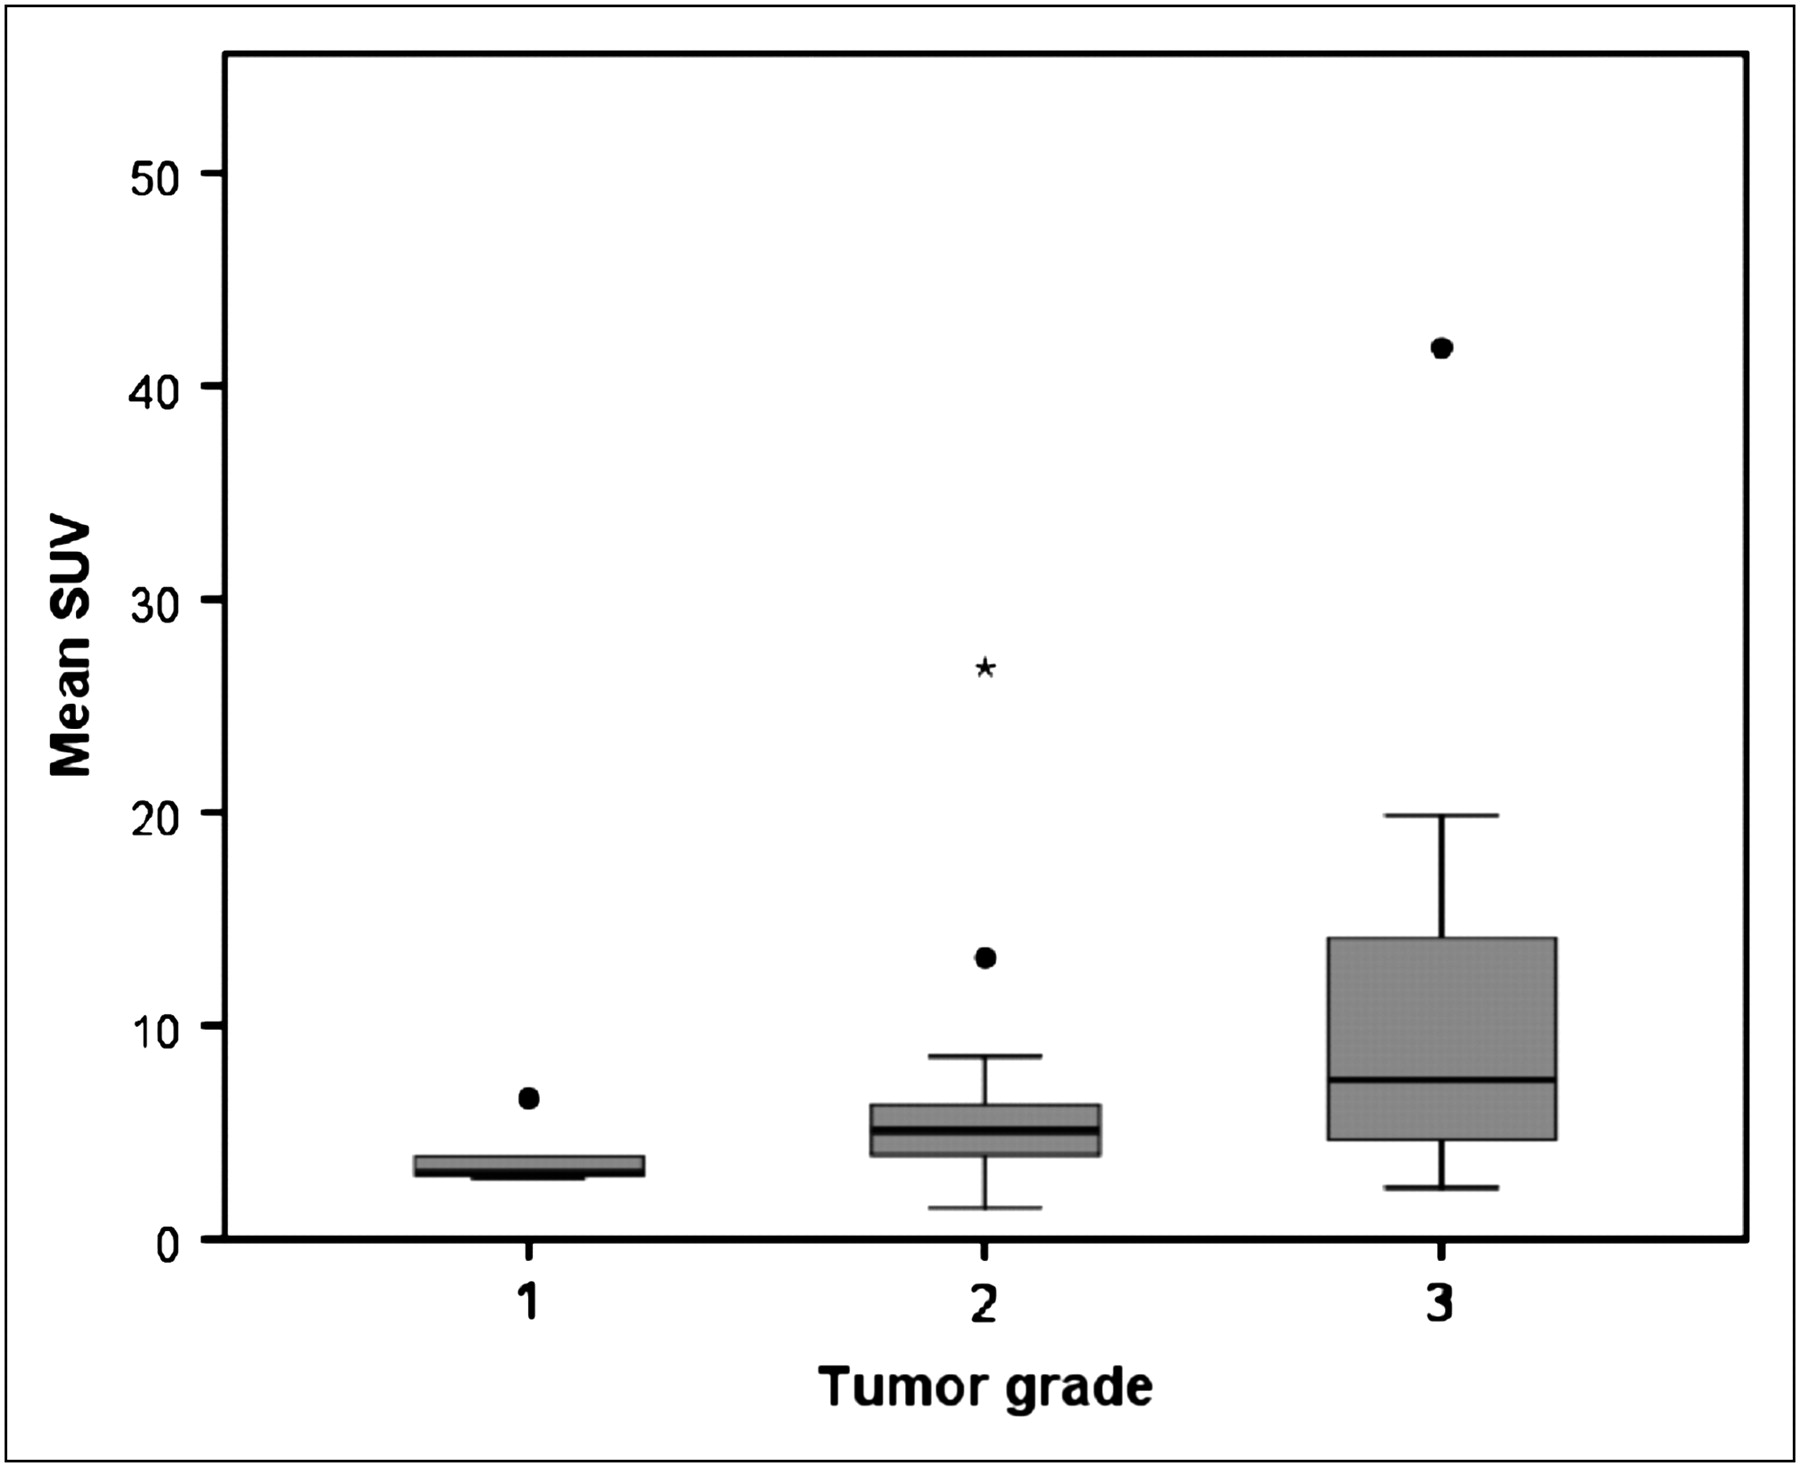
Relationship between tumor grade and SUV (18F-FDG uptake, Spearman correlation test, r = 0.412, P = 0.002). • and * represent outliers.
GLUT1 Genotypes
The GLUT1 SNP genotyping rates of yield for the 52 patients were as follows: 48 patients (92.3%) for the XbaI G>T SNP, 46 patients (88.5%) for the HpyCH4V A>T SNP, and 52 patients (100%) for the HaeIII T>C SNP. This variability is most likely due to the different template sizes of the PCR analysis against the background of a generally reduced quality of paraffin-embedded tissue DNA (Table 2).
Deviations from the Hardy–Weinberg equilibrium (Table 3) in the genotypes of the 3 SNPs were not found. Distributions of the certain 3 genotypes of the GLUT1 SNPs and their mean SUV and mitotic count are displayed in Table 3. Allele frequencies for the SNPs of the GLUT1 gene were as follows: Xbal G>T: G = 0.61, T = 0.39; HypCH4V A>T: A = 0.78, T = 0.22; and HaeIII T>C: C = 0.78, T = 0.22. These frequencies do not differ from previously published frequencies of Caucasian cohorts (14,15,17). The GG genotype of the XbaI G>T SNP was significantly associated with an increased tumor uptake of 18F-FDG, with a mean SUV ± SD of 11.7 ± 10.2 (compared with 5.9 ± 3.4 for the TT/GT genotypes; logarithmic scale GG, 2.18 ± 0.73, vs. TT/GT, 1.62 ± 0.56; P = 0.03; Fig. 4). Furthermore, tumors carrying the GG genotype displayed a significantly higher mean mitotic count (±SD) than TT/GT genotypes (GG, 34.1 ± 31.1 vs. TT/GT, 13.8 ± 18.3; logarithmic scale GG, 3.10 ± 1.01 vs. TT/GT, 2.03 ± 1.11; P = 0.01; Fig. 5A). The GG genotype was not detected in grade 1 carcinomas (0.0%) and showed an increasing prevalence with escalating malignancy grade (grade 2, 28.0%; grade 3, 50.0%). Despite the small sample size, the association between the genotypes of the XbaI G>T SNP and tumor grade reached statistical significance (P = 0.04; Fig. 5B). Neither of the 2 additional GLUT1 SNPs (HaeIII T>C and HpyCH4V A>T) showed any association with tracer uptake (both P > 0.5), proliferation (both P > 0.5), or tumor grade (P = 0.49 and P = 0.83, respectively).
Genotypes of GLUT1 SNPs

Mean SUVs for SNPs of GLUT1 gene were compared using t statistics after logarithmic transformation. Genotypes of XbaI G>T SNP showed significant difference in 18F-FDG uptake (P = 0.03). HypCH4V A>T and HaeIII T>C SNPs showed nonsignificant result (HypCH4V A>T, P > 0.5, and HaeIII T>C, P > 0.5). Error indicators represent SD.
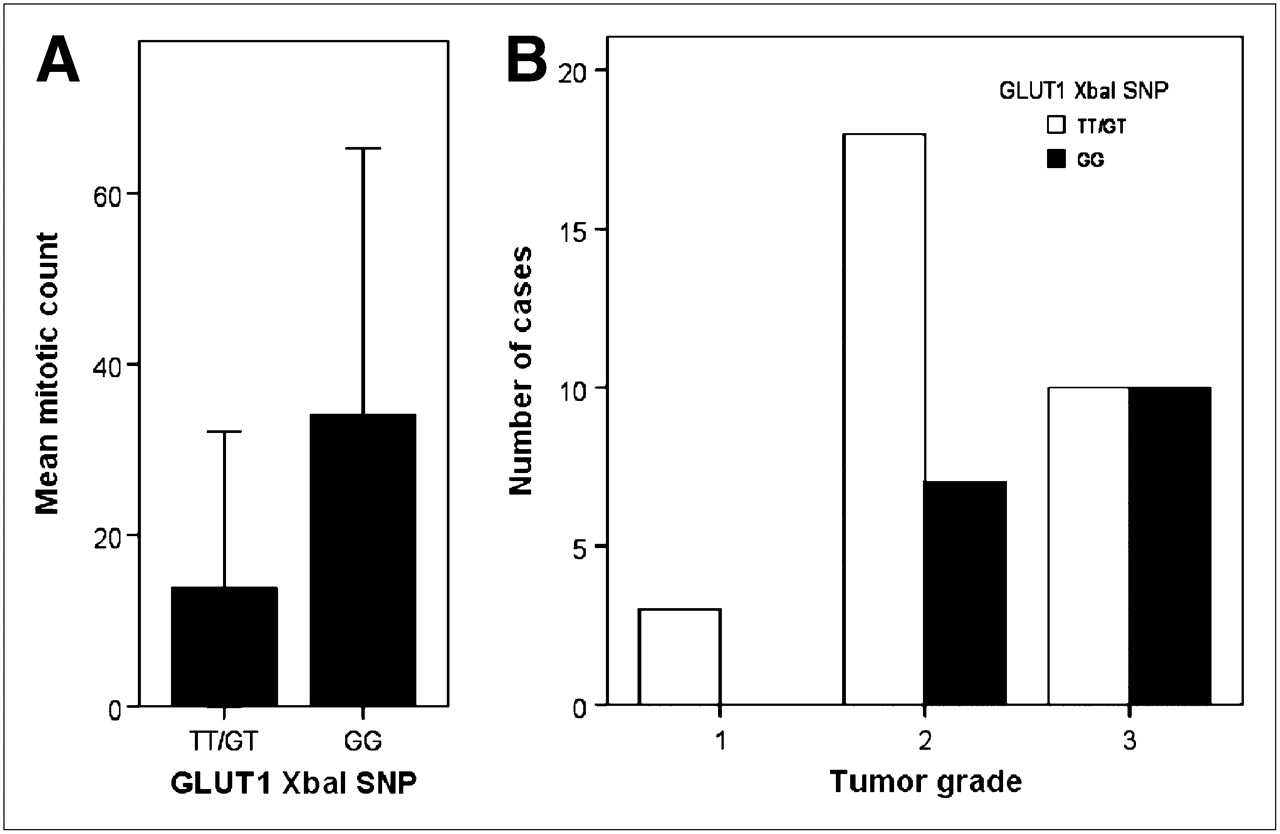
(A) Influence of XbaI G>T SNP on tumor proliferation in terms of mitotic count. Mean values with SD, t test after log transformation, P = 0.01. (B) Prevalence of XbaI G>T SNP genotypes within 3 grades of malignancy (grade 1, 0%; grade 2, 28.0%; and grade 3, 50.0%; Cochran–Armitage trend test, P = 0.04).
DISCUSSION
This study investigated the association between 3 SNPs of the GLUT1 gene and tumor 18F-FDG uptake as a measurement of glucose metabolism and tumor proliferation–tumor grade as a marker of tumor aggressiveness in breast cancer. The GG genotype of the XbaI G>T SNP of the GLUT1 gene, which occurs in about one third of the Caucasian population, was found to positively correlate to 18F-FDG tumor uptake. Furthermore, we found evidence that this genetic variant is positively associated with tumor proliferation and grade. In addition, a positive correlation between proliferation and 18F-FDG uptake, which has been shown by others (5,24), was confirmed in this study.
The association between histologic grade and aggressive phenotype and between GLUT1 (protein) expression (25–27) and increased accumulation of glucose (18F-FDG) has already been reported for a variety of human cancers, including breast cancer (8–10). Those findings are in accordance with increased aerobic glycolytic metabolism in rapidly growing neoplasms (4). In contrast to those studies, however, we did not quantitatively investigate the protein expression of GLUT1 on the tumor cell membranes; rather, we investigated the different genotypes of the GLUT1 gene. Both our results and the cited quantitative studies underline the pivotal role of glucose transport for tumor growth. A common hypothesis is that many rapidly growing tumors overexpress GLUT1 to meet their increased demand for energy and synthesis of biomass (4); this phenomenon can be thought of as a necessary step during tumor evolution. However, genetic polymorphisms of the GLUT1 transporter gene are unlikely to be altered by the tumor and thus cannot be adapted during tumor evolution. Rather, they represent a constitutional component that may enhance (e.g., GG genotype of the XbaI G>T SNP) or not enhance glucose supply and tumor growth. On the basis of our results, glucose transport into cancer cells thus appears to be not only a marker of tumor aggressiveness but also a limiting factor according to constitutional preconditions. Glucose and 18F-FDG uptake correlate with each other, as indicated by the lumped constant. However, the lumped constant differs among normal tissues and tumors (28). As the lumped constant for breast cancer is not known, the absolute differences between glucose uptake among individual tumors cannot be deduced from 18F-FDG uptake.
It has become clear that upregulation of the expression of GLUT contributes to neoplastic transformation of breast cancer, and elevated GLUT levels contribute to tumor growth. But it is not clear if this event represents a cause or effect of oncogenic transformation (7).
Viewing glucose transport via GLUT1 as a limiting factor, we hypothesized that an unfavorable genetic variant of GLUT1 predisposes patients to more aggressive tumor types of breast cancer. The XbaI G>T GLUT1 SNP genotype appears to upgrade tumor grade in breast cancer by modulating the efficiency of cancer cells to recruit glucose over the cell membrane and accelerate growth rate. Accordingly, the XbaI G>T GLUT1 SNP may also have a prognostic value in breast cancer because the mitotic count is one of the most reproducible, independent prognostic factors for this carcinoma type (29).
Although the XbaI G>T SNP has been associated with other diseases (11–14), it is located in intron 2 of GLUT1, which represents a non–protein-coding region of the gene. This means that this genetic variant cannot directly influence the amino acid sequence and consequent function of the GLUT1 protein. However, SNPs that are located in non–protein-coding regions may still have consequences for the splicing of genes, binding of transcription factors, or sequence of noncoding RNA (e.g., micro-RNAs); these factors can very well influence the expression of the corresponding gene.
CONCLUSION
This preliminary retrospective study found that the XbaI G>T SNP of GLUT1 influences 18F-FDG uptake in breast cancer. Furthermore, this genetic variant was shown to be related to tumor growth rate, suggesting this genetic variant as a possible proliferation-related prognosticator in breast cancer. Further investigations should aim at substantiating the findings of this study by quantitative GLUT1 protein analysis; modeling 18F-FDG uptake kinetics—for example, obtaining K1 and k3 as markers for transport and hexokinase activity from dynamic PET; checking for similar results in other human cancers; and evaluating how this genotypic variant is converted into phenotype or biologic function.
Acknowledgments
We acknowledge the excellent technical assistance of Andrea Kutritz.
- © 2010 by Society of Nuclear Medicine
REFERENCES
- Received for publication January 30, 2010.
- Accepted for publication April 28, 2010.


