


Abstract
18F-FDG PET is often used in clinical routine for diagnosis, staging, and response to therapy assessment or prediction. The standardized uptake value (SUV) in the primary or regional area is the most common quantitative measurement derived from PET images used for those purposes. The aim of this study was to propose and evaluate new parameters obtained by textural analysis of baseline PET scans for the prediction of therapy response in esophageal cancer. Methods: Forty-one patients with newly diagnosed esophageal cancer treated with combined radiochemotherapy were included in this study. All patients underwent pretreatment whole-body 18F-FDG PET. Patients were treated with radiotherapy and alkylatinlike agents (5-fluorouracil-cisplatin or 5-fluorouracil-carboplatin). Patients were classified as nonresponders (progressive or stable disease), partial responders, or complete responders according to the Response Evaluation Criteria in Solid Tumors. Different image-derived indices obtained from the pretreatment PET tumor images were considered. These included usual indices such as maximum SUV, peak SUV, and mean SUV and a total of 38 features (such as entropy, size, and magnitude of local and global heterogeneous and homogeneous tumor regions) extracted from the 5 different textures considered. The capacity of each parameter to classify patients with respect to response to therapy was assessed using the Kruskal–Wallis test (P < 0.05). Specificity and sensitivity (including 95% confidence intervals) for each of the studied parameters were derived using receiver-operating-characteristic curves. Results: Relationships between pairs of voxels, characterizing local tumor metabolic nonuniformities, were able to significantly differentiate all 3 patient groups (P < 0.0006). Regional measures of tumor characteristics, such as size of nonuniform metabolic regions and corresponding intensity nonuniformities within these regions, were also significant factors for prediction of response to therapy (P = 0.0002). Receiver-operating-characteristic curve analysis showed that tumor textural analysis can provide nonresponder, partial-responder, and complete-responder patient identification with higher sensitivity (76%–92%) than any SUV measurement. Conclusion: Textural features of tumor metabolic distribution extracted from baseline 18F-FDG PET images allow for the best stratification of esophageal carcinoma patients in the context of therapy-response prediction.
Esophageal cancer is associated with high mortality. In patients with early-stage disease at presentation, esophagectomy is the treatment of choice and is potentially curative. Unfortunately most patients at presentation have already locally advanced esophageal cancer or distant metastases. In locally advanced esophageal cancer, preoperative chemotherapy or radiochemotherapy will improve survival in patients who respond to induction therapy (1,2). On the other hand, patients who do not respond to neoadjuvant therapy may be affected unnecessarily by the toxicity of an inefficient therapy. Therefore, the development of a diagnostic test capable of noninvasively predicting response to therapy early in the course of treatment is of great interest, potentially allowing personalization of patient management. In patients treated by exclusive conventional combined radiochemotherapy, assessment of response is equally of great interest, because it could allow an early change in the management of nonresponding patients. Such assessment becomes more critical when one considers the availability of new targeted therapies that could be tested with higher efficiency if applied early in diagnosis (3,4).
18F-FDG PET is already well established for the initial staging of esophageal cancer, because it is associated with a better sensitivity and specificity than combined use of CT and echoendoscopy, especially regarding detection of distant metastasis (5).
18F-FDG PET has been also used to assess response to therapy and patient outcome prognosis (4,6). Within this context, few studies have explored the potential prognostic value of pretreatment 18F-FDG PET, demonstrating that the level of activity concentration on preoperative PET, although not statistically significant, tends to predict overall survival (7–9).
On the other hand, several studies have evaluated the role of PET in assessing treatment response based on 18F-FDG uptake changes between a pre- and a posttreatment PET scan obtained during or after the treatment completion. Studies considering a second PET scan after treatment completion have shown that a complete metabolic response is associated with better outcome (10–12). However, because that information is of limited interest in patient management if acquired late, different attempts have been made to determine whether 18F-FDG PET could be used for assessing response to therapy earlier (usually within a few weeks) in the course of treatment (13–15), showing some promising results that need to be confirmed in multicenter trials (4). One of the highlighted issues is that early response prediction during combined chemoradiotherapy, in contrast to chemotherapy alone, may be compromised by increased 18F-FDG tumor uptake resulting from radiotherapy-induced inflammatory processes (4).
An alternative to monitoring changes during treatment is the potential of predicting response to therapy from the baseline 18F-FDG PET scan alone, which may allow the best available therapy regime to be chosen for a given patient. However, to date there is only limited evidence that a measure of tumor activity concentration on a baseline PET scan in esophageal cancer can differentiate groups of patient response (8,9). Within the same context, parameters derived from pretreatment 18F-FDG PET have shown the potential to differentiate between responders and nonresponders (NRs) in non-Hodgkin lymphoma patients (16).
The PET image index predominantly used in such studies for assessment of metabolic response is the normalized mean tumor activity concentration known as the mean standardized uptake value (SUVmean), within a region of interest around the tumor, or the maximum standardized uptake value corresponding to the highest-activity pixel value (SUVmax). However, 18F-FDG tumor uptake has been associated not only with increased metabolism but also with several other physiologic parameters such as perfusion, cell proliferation (17), tumor viability, aggressiveness, or hypoxia (18,19), all of which may in turn be responsible for tumor uptake heterogeneity. Therefore, the hypothesis can be made that characterizing tumor 18F-FDG distribution, through its relationship to underlying tumor biologic characteristics, may be useful in predicting therapy response. 18F-FDG tumor activity distribution may be assessed in a global, regional, or local fashion, allowing in turn the assessment of corresponding global, regional, or local patterns of biologic heterogeneity. Although the measurement of such features have been previously explored in anatomic imaging (20–22), they have not to date been widely used in PET. Until now, only 1 study has considered the use of some textural features to predict treatment outcome from baseline 18F-FDG PET images, with encouraging results in cervical and head and neck cancer (23), and the assessment of spatial heterogeneity was also shown to be significantly associated with survival in sarcoma patients (24). However, the potential predictive value of tumor heterogeneity characterization on a baseline 18F-FDG PET scan has never been assessed.
The objective of this current study was, therefore, to assess the predictive value of 18F-FDG uptake heterogeneity characterized by textural features extracted from pretherapy 18F-FDG PET images of patients with esophageal carcinoma by assessing the ability of each parameter to identify different categories of responders. The predictive value of these parameters was compared with the use of standard image activity concentration indices (SUVmax, SUVmean). The potential prognostic value of such image-derived parameters for assessing overall patient survival was not assessed in this study.
MATERIALS AND METHODS
Patients
Forty-one patients with newly diagnosed esophageal cancer treated with exclusive radiochemotherapy between 2003 and 2008 were included in this study. The characteristics of the patients are summarized in Table 1. The mean age at the time of diagnosis was 66 ± 10 y (median, 69 y; range, 45–84 y), and 85% of patients were male. Most of the tumors were squamous cell carcinoma (76%), and most of the patients had a well or moderately differentiated tumor (56%). Most of the tumors originated from the middle and lower esophagus (76%). Twenty-six patients had a T3 or T4 primary lesion, 25 had N1 (61%) lymph node metastases, and 17 had distant metastases (Table 1). All patients were treated with external-beam radiotherapy and chemotherapy with alkylatinlike agents (5-fluorouracil-cisplatin or 5-fluorouracil-carboplatin). A median radiation dose of 60 Gy was delivered in 180-cGy daily fractions (5 d/wk and 6–7 wk in total). One month after the completion of the treatment, patients were reassessed to determine response to therapy using thoracoabdominal CT and endoscopy. Patients were subsequently classified as complete responders (CR), partial responders (PR), stable disease, or progressive disease. Response was assessed using pretreatment and posttreatment CT scans by evaluating the increase (or decrease) in the sum of the longest diameters for all target lesions and the appearance, persistence, or disappearance of nontarget lesions, according to the Response Evaluation Criteria in Solid Tumors (RECIST) (25). Considering the small number of patients in the stable disease (7) and progressive disease (4) groups, these patients were eventually combined into an NR group.
Characteristics of Patients (n = 41)
All patients underwent pretreatment whole-body 18F-FDG PET for staging purposes. Patients were instructed to fast for a minimum of 6 h before the injection of 18F-FDG. The dose of administered 18F-FDG was 5 MBq/kg, and static emission images were acquired from thigh to head, on average 54 min after injection, on a Gemini PET/CT scanner (Philips). In addition to the emission PET scan, a low-dose CT scan was acquired for attenuation-correction purposes. Images were reconstructed with the 3-dimensional (3D) row-action maximum-likelihood algorithm using standard clinical protocol parameters (2 iterations, relaxation parameter of 0.05, and 3D gaussian postfiltering of 5 mm in full width at half maximum). The current data analysis was performed after approval by the institutional review board.
Tumor Analysis
For each patient, primary tumors were identified on 18F-FDG PET images by an experienced nuclear physician. Tumors were then delineated automatically using the previously validated fuzzy locally adaptive Bayesian algorithm (26). All parameters were subsequently extracted from this delineated volume. Only the primary tumors were considered because textural analysis cannot be reliably performed on small lesions (nodal or distant metastases) because of the small number of voxels involved.
Standardized Uptake Value (SUV) Analysis
The following SUV parameters were extracted from each patient's baseline PET images: SUVmax; peak SUV (SUVpeak), defined as the mean of the voxel of maximum value and its 26 neighbors (in 3 dimensions); and mean SUV within the delineated tumor (SUVmean). The SUVpeak was considered in addition to SUVmax to investigate the impact of reducing the potential bias in the SUVmax measurements as a result of its sensitivity to noise.
Textural Analysis
We define texture as a spatial arrangement of a predefined number of voxels allowing the extraction of complex image properties, and we define a textural feature as a measurement computed using a texture matrix. The method used was realized in 2 steps. First, matrices describing textures on images were extracted from tumors, and textural features were subsequently computed using theses matrices. All these parameters characterize in some way tumor heterogeneity at local and regional (using texture matrices) or global scales (using image-voxel-intensity histograms).
Several different textures (Table 2, left column) were computed. Voxel values within the segmented tumors (Fig. 1A and 1B) were resampled to yield a finite range of values (Fig. 1C), allowing textural analysis using:
Texture Type and Associated Features
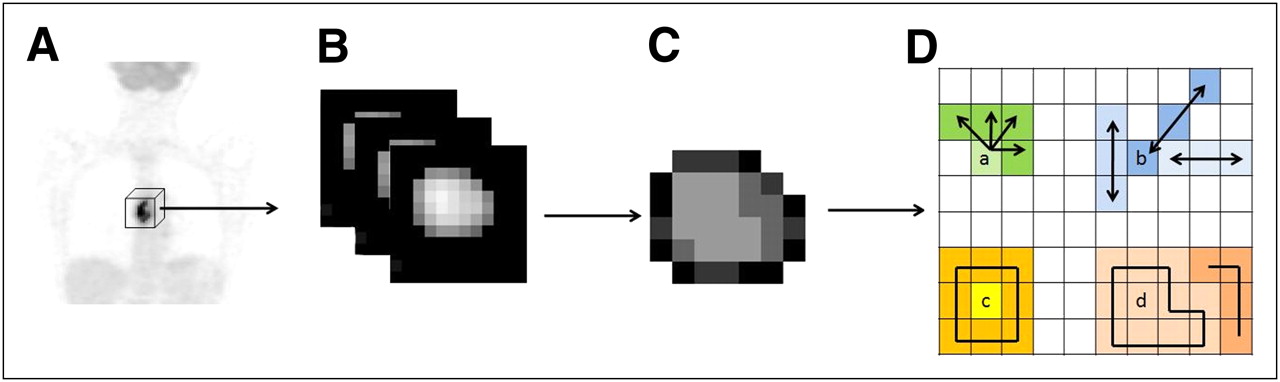
Whole-body 18F-FDG PET scan (A), tumor segmentation (B), and voxel-intensity resampling (C) allowing extraction of different features (D) by analysis of consecutive voxels in a direction (for cooccurrence matrices) (a), alignment of voxels with same intensity (b), difference between voxels and their neighbors (c), and zones of voxels with same intensity (d).
All considered textures were originally described for 2 dimensions (27–30) and were therefore adapted in this work for 3 dimensions. The cooccurrence matrix (M1, Fig. 1D(a)) describing pairwise arrangement of voxels, and the matrix describing the alignment of voxels with the same intensity (M2, Fig. 1D(b)), were computed considering 13 different angular directions. Finally, 3D matrices describing differences between each voxel and its neighbors (M3, Fig. 1D(c)) and characteristics of homogeneous zones (M4, Fig. 1D(d)) were computed considering for each voxel the neighbors in the 2 adjacent planes, adapting the normalizing factors to 3 dimensions.
From each of the extracted texture matrices, different features summarized in Table 2 (middle column) were computed. Depending on the way the matrix is analyzed, it is possible to extract features of a local or regional nature. Six features highlighting local variations of voxel intensities within the image were extracted from the cooccurrence matrices M1 (Fig. 2C). For example, using the matrix M1, the local entropy and homogeneity are calculated using Equations 2 and 3, respectively:

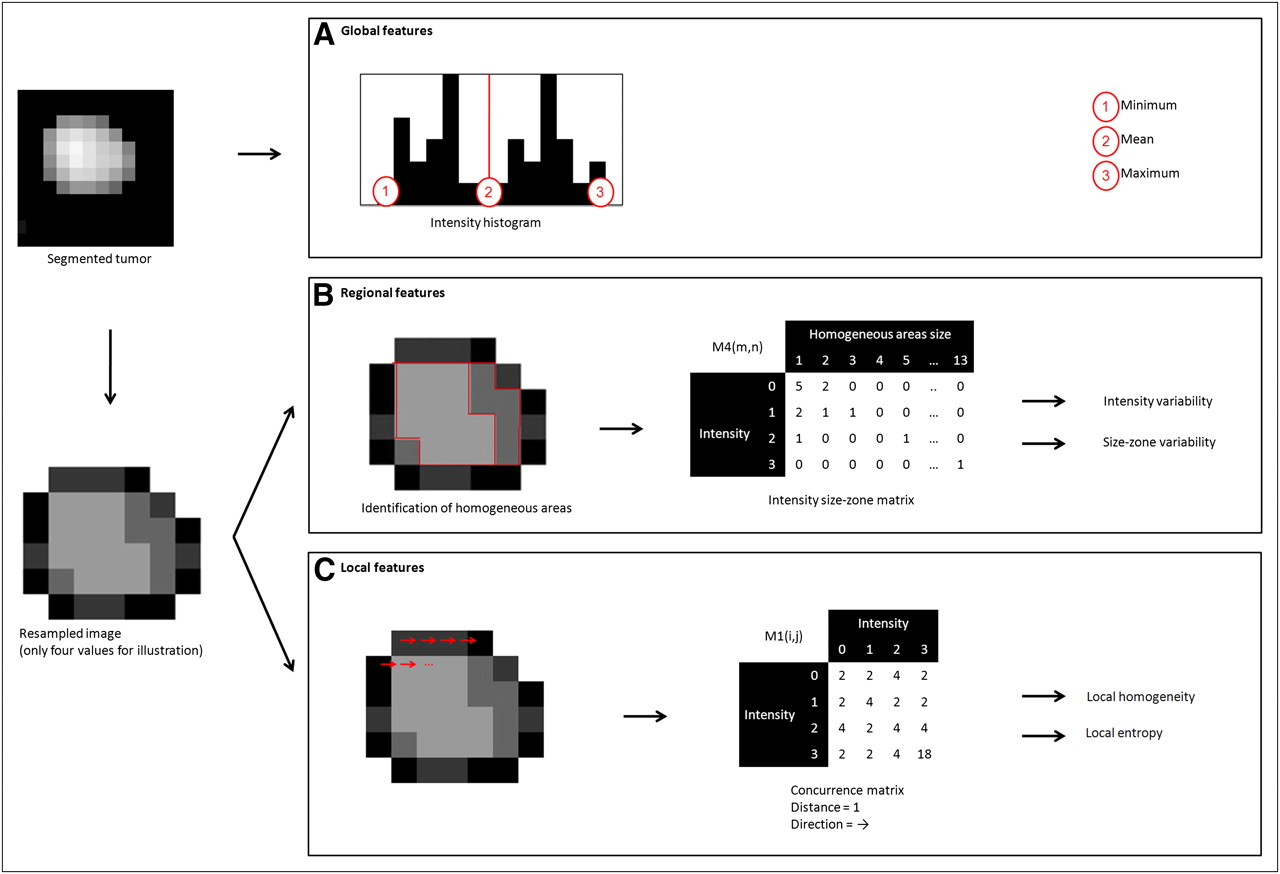
Examples of features extracted from tumor resampled on 4 values: 3 global features computed using intensity histogram, 2 regional features computed using M4 matrix, and 2 local features computed using M1 texture matrices.
In addition, M3 matrices were used to extract busyness (quantifying sharp-intensity variations) and contrast and coarseness (quantifying tumor granularity). These features allow extracting measurements describing tumor local heterogeneity proportional to variations of 18F-FDG uptake between individual voxels.
On the other hand, the M2 and M4 matrices were used to extract regional tumor uptake characteristics, representing regional heterogeneity, such as variation of intensity between regions and in the size and alignment of homogeneous areas. For example, the M4 matrix links the homogeneous tumor regions to their intensity (Fig. 2B). It was hence used to calculate the variability in the size and the intensity of identified homogeneous tumor zones according to Equations 4 and 5, respectively:
Finally, global features are computed on the original image voxels’ intensity distribution by analyzing the characteristics of the intensity value histogram within the segmented tumor (Fig. 2A).
Thirty-eight features were extracted from the 4 different texture matrices and intensity histograms. Seven of the 38 features characterize the uptake distribution within the entire tumor (using the intensity histogram), 9 describe local voxel arrangements (using matrices M1 and M3), and 22 are related to the organization of voxels at a regional scale (using matrices M2 and M4).
Statistical Analysis
The capacity of each feature to classify patients with respect to therapy response was investigated on the primary tumor using the Kruskal–Wallis test (8). P values of less than 0.05 were considered statistically significant. Specificity and sensitivity (including 95% confidence intervals [CIs]) for each of the studied parameters were derived using receiver operating characteristic (ROC) curves measuring associated areas under the ROC curves (AUC). Texture results were compared with those of SUVmax, SUVmean, and SUVpeak for their ability to distinguish among responders (PR and CR) and NRs, CRs and non-CRs (PR, NR), and all 3 groups separately.
RESULTS
Patients were evaluated 1 mo after the completion of combined radiochemotherapy. Nine patients (22%) had no evidence of disease after treatment and were considered CRs. Radiochemotherapy led to partial response in 21 (51%) patients, whereas 11 (27%) were stable or progressed under treatment according to RECIST (25).
Results of the Kruskal–Wallis test show that SUVmax (Fig. 3) and SUVmean were capable of differentiating only CRs from NRs and PRs. Within this context, all SUV measurements were significant predictive factors of response (P = 0.034, 0.044, and 0.012 for the SUVmax, SUVmean, and SUVpeak, respectively). However, only SUVpeak was a significant predictive factor (P = 0.045) when considering the differentiation of 3 patient response groups (i.e., NR, PR, and CR), whereas SUVmax and SUVmean were not (P > 0.05).

Box-plot representation of parameters’ values in function of patient response (0, NR; 1, PR; and 2, CR) for SUVmax (P = 0.106) (A), SUVpeak (P = 0.045) (B), local entropy (P = 0.0006) (C), and regional intensity variability (P = 0.0002) (D).
Figure 4 shows examples of different extracted features and associated values for tumors of CRs, PRs, and NRs. The Kruskal–Wallis tests revealed no statistically significant differences in the textural parameters derived using different resampling values (16, 32, 64, or 128 discrete values). All subsequent reported results were obtained using 64 discrete values in the resampling normalization process. This value was chosen because it allows for 0.25 SUV increments, which were considered sufficient given the range of SUVs encountered (from ∼4–20).

Example of different extracted features and associated values for tumors of CRs, PRs, and NRs (results are normalized in [0–1] interval using range of observed values for local and regional parameters).
None of the global features extracted from the intensity histogram within the tumor was a significant predictive factor of response to therapy. However, considering local variation of 18F-FDG uptake, a high predictive value (P < 0.0007) was found using the cooccurrence features, particularly considering the use of the average feature values computed using M1 matrices (Table 3). All these features offered statistically significant differentiation of NRs and responders (considering both CR and PR).
Sensitivity and Specificity (Along with Corresponding 95% Confidence Intervals) of 3 SUV-Based Measurements, 2 Cooccurrence Features, and 2 Size-Zone Features
Regarding local features, the busyness and contrast computed on M3 matrices were not statistically significant predictive factors of response, but the coarseness, reflecting the local granularity of the tumor functional image, was found to be significant (P = 0.0002). Among the local measures of functional tumor characteristics computed using M1 matrices, the measure of local entropy was the only measure allowing statistically significant differentiation of all 3 patient groups (P = 0.0006, Fig. 3).
Because the features computed on M2 and M4 matrices, used to highlight regional variability in the 18F-FDG distribution, were strongly correlated (r > 0.9), only features based on M4 were used in the subsequent analysis. Regional measures of tumor characteristics extracted from these M4 matrices, such as the variability in the size and the intensity of identified homogeneous tumor zones, were statistically significant in predicting therapy response (P = 0.0002), allowing the differentiation of all 3 patient response groups (Fig. 3).
The ROC curve analysis for SUVmax, SUVpeak, local homogeneity, local entropy, and regional tumor characteristics such as the variability in size and intensity of identified homogeneous tumor areas is presented in Figure 5. Table 3 summarizes the ROC curve analysis results, comparing the performance of the different studied parameters in terms of sensitivity and specificity in, on the one hand, identifying complete-response patients and, on the other hand, differentiating responders (PR and CR).
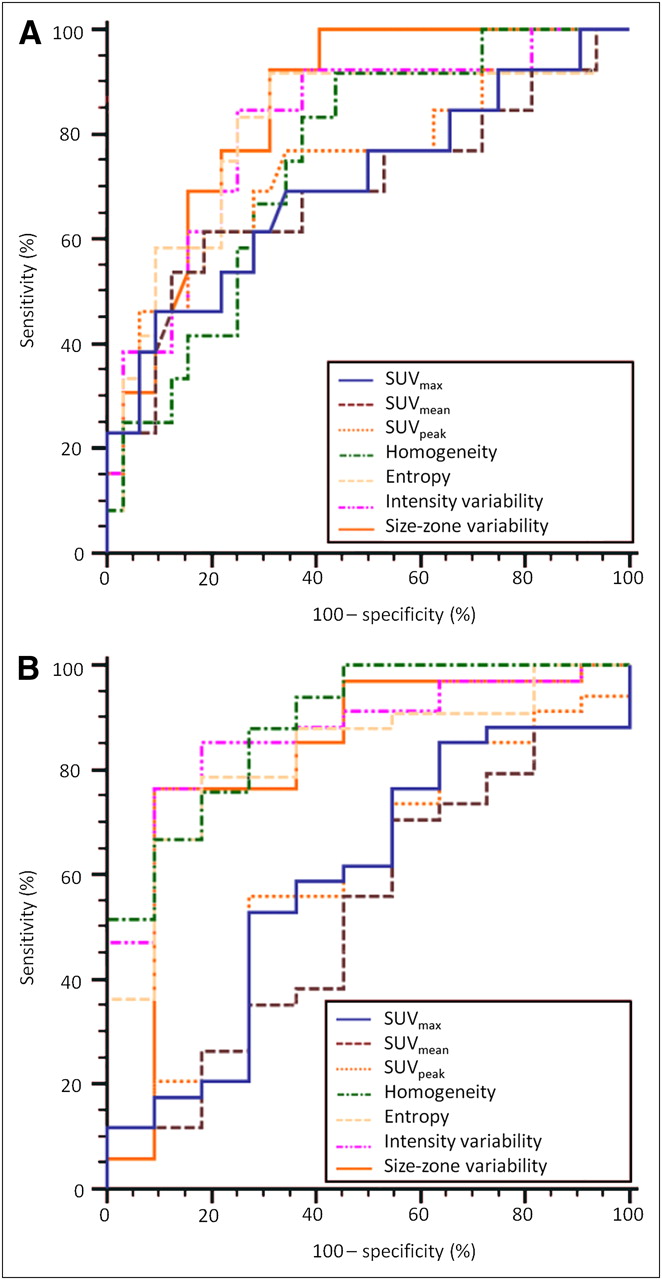
ROC curves for SUVmax, SUVmean, SUVpeak, local homogeneity, uniform tumor areas, intensity variability, and size-zone variability for identification of CRs (A) and PRs or CRs (B).
First, based on the ROC curve analysis, textural parameters can identify CRs better than can the SUV-based measurements, as demonstrated by the respective AUCs (Fig. 5). For example, SUVmax, with an AUC of 0.7, allowed the identification of CRs, with a maximum sensitivity of 46% and specificity of 91%, using a threshold of 6. On the other hand, the variability in the size of the uniform tumor zones (AUC, 0.85) allowed for the extraction of CR patients with the best accuracy (sensitivity, 92%; specificity, 69%).
Second, as Figure 5 shows, textural features were most efficient in identifying responders (CRs and PRs), whereas for the same task the performance of SUV measurements was limited. For the differentiation of the patient responders, the AUC was less than 0.6 for the different SUV parameters, compared with an AUC of more than 0.82 for the use of the texture parameters. For example, the AUC of the SUVmax was 0.59, allowing a sensitivity of 53% and specificity of 73% in the differentiation of responders using an optimal threshold of 9.1. On the other hand, for the same task the local homogeneity had a specificity and sensitivity of 88% and 73%, respectively (AUC, 0.89).
DISCUSSION
Assessment of tumor response to therapy plays a central role in drug development and patient clinical management. Currently, response is mainly assessed by measuring anatomic tumor size and classifying tumor shrinkage according to standard criteria. Because metabolic changes often occur before morphologic changes, metabolic imaging appears to be a valuable tool for monitoring various treatments in different cancer types. Within this context, 18F-FDG PET has shown promising results in assessing response to therapy and prognosis. In esophageal cancer, quantitative changes in 18F-FDG uptake at 2 wk after the start of therapy have been shown to correlate well with subsequent tumor shrinkage and patient survival (4). This approach still has limitations, especially if patients undergo radiotherapy treatment. Hautzel et al. have shown that even low irradiation may enhance tumor uptake, and inflammatory changes may contribute early to this increase, yielding inaccurate information about treatment response (31). Within the same context, induced ulceration may also impair response assessment using PET (32).
On the other hand, the prediction of response before treatment initiation may be of great interest to the optimization of patient management. With such an endpoint, few authors have studied the predictive value of initial 18F-FDG uptake for therapy response. Rizk et al. reported an SUVmax of more than 4.5 to be a reliable predictor of pathologic response (9), whereas Javeri et al. (8) demonstrated in a larger group of patients a trend of greater rate of response obtained after combined chemoradiotherapy in patients who had an initial SUVmax higher than 10. Similarly in our study, initial SUVmean, SUVmax, and SUVpeak were also predictors of complete response. However, in general these indices did not allow differentiating NRs from PRs, a distinction that could be useful for patient management. For instance, within the patient population of our study the identification of PRs before any treatment could allow the definition of a subpopulation for which the use of conventional radiochemotherapy should be directly replaced by another option, such as a new targeted therapy.
A few studies have already focused on the link between image analysis and tumor biologic parameters. Gillies et al. (33) suggested that imaging can longitudinally characterize spatial variations in the tumor phenotype and its microenvironment so that the system dynamics over time can be quantitatively captured. Segal et al. (22) showed that contrast-enhanced CT image characteristics (such as texture heterogeneity score or estimated percentage of necrosis) correlate with most of the liver global gene expression profiles, revealing cell proliferation, liver synthetic function, and patient prognosis. Within the same context, Diehn et al. (34) mapped neuroimaging parameters with gene-expression patterns in glioblastoma, whereas Strauss et al. (35) combined dynamic PET kinetic parameters with gene-array techniques. Finally, Eary et al. (24) previously demonstrated that a globally assessed 18F-FDG distribution heterogeneity in sarcoma is a potential prognostic factor.
In our study, the value of textural feature analysis was explored on the pretreatment 18F-FDG PET scans for predicting response to combined chemoradiotherapy. Global tumor metabolic features based on the intensity histogram were computed directly on the original image. As such, they were therefore highly correlated with 18F-FDG uptake, which could explain why these textures could only predict CRs but could not distinguish NRs from PRs, similar to the SUV measurements. The other features evaluated in this study highlight tumor heterogeneity at a local and regional level, characterized in several ways, depending on the type of matrix used and the kind of feature computed on this matrix. Consequently, whereas a single feature cannot be directly linked to a specific biologic process, one could assume that a combination of textural parameters may be closely related to underlying physiologic processes, such as vascularization, perfusion, tumor aggressiveness, or hypoxia (18,19). Therefore textural features could be correlated to physiologic processes related to response to combined radiochemotherapy. For example, one could reasonably expect that a tumor exhibiting a heterogeneous, compared with a homogeneous, 18F-FDG distribution may respond less favorably to a uniformly distributed radiotherapy dose. We could also hypothesize that underlying neoangiogenesis contributes to tumor 18F-FDG uptake heterogeneity, although it is now widely accepted that neoangiogenesis is associated with reduced effectiveness of conventional chemotherapy. However, the exact relationship between the proposed image-derived indices and underlying tumor biology can be established only on carefully designed prospective studies.
In this work, the cooccurrence features analyzing interrelationships between pairs of voxels, corresponding to the characterization of local nonuniformities, were able to significantly differentiate NRs from other patient groups. The measurement of local homogeneity and entropy gave the best results for this class of textures. Although in most cases responders (PR and CR) were associated with greater local heterogeneity than NRs, these features were less efficient in discriminating CRs from PRs.
The 2 features facilitating the best patient stratification were both associated with regional tumor characterization. Both the intensity and the size variability of uniform zones identified within the tumor, representing a measure of regional tumor heterogeneity, were significant predictors of response to therapy. ROC curve analysis showed that the performance of these features is similar to that of cooccurrence features in identifying NRs, but they can in addition distinguish between PRs and CRs with higher sensitivity and specificity than SUV measurements. These results suggest that regional (in terms of intensity and size of homogeneous areas) rather than local heterogeneity offers a superior differentiation of esophageal carcinoma patient groups in terms of response to combined chemoradiotherapy treatment than does any other global tumor metabolic activity measurement currently used in routine clinical practice, such as SUVs.
A limitation of the present study is that it is retrospective, considering a relatively small patient cohort. Therefore, the potential of new image-derived indices characterizing tumor 18F-FDG distribution for prediction of response to therapy studies demonstrated in this work needs to be validated by a prospective study on a larger patient cohort.
CONCLUSION
We have demonstrated that textural analysis of the intratumor tracer uptake heterogeneity on baseline 18F-FDG PET scans can predict response to combined chemoradiation treatment in esophageal cancer. Textural features derived from cooccurrence matrices strongly differentiated NRs from PRs, providing useful information for personalizing patient management. These results suggest that regional and local characterization of 18F-FDG PET tracer heterogeneity in tumors, exploring processes underlying the 18F-FDG uptake and distribution within tumors, are more powerful than global measurements currently used in clinical practice, holding the potential to revolutionize the predictive role of PET in cancer treatment. Finally, although only 18F-FDG images in esophageal cancer have been considered here, clearly the same indices applied in other PET radiotracer studies in the same or different tumor types may help create even stronger links between imaging and underlying tumor biology.
Acknowledgments
This study was supported by a grant from the Ligue Contre le Cancer (Finistère and Côtes d'Armor Committees), IFR148-ScInBioS, and a fellowship from the French Ministry of Education and Research.
- © 2011 by Society of Nuclear Medicine
REFERENCES
- Received for publication August 17, 2010.
- Accepted for publication December 13, 2010.


Jump to section
Related Articles
Cited By...
- Computed tomography radiomics-based cross-sectional detection of mandibular osteoradionecrosis in head and neck cancer survivors
- Repeatability of 18F-FDG PET Radiomic Features in Cervical Cancer
- The contribution of evolutionary game theory to understanding and treating cancer
- Texture Feature Comparison Between Step-and-Shoot and Continuous-Bed-Motion 18F-FDG PET
- Radiomics: Data Are Also Images
- Optimized Feature Extraction for Radiomics Analysis of 18F-FDG PET Imaging
- Pretreatment 18F-FDG Uptake Heterogeneity Predicts Treatment Outcome of First-Line Chemotherapy in Patients with Metastatic Triple-Negative Breast Cancer
- Noninvasive Imaging of Drug-Induced Liver Injury with 18F-DFA PET
- Metabolic heterogeneity on baseline 18FDG-PET/CT scan is a predictor of outcome in primary mediastinal B-cell lymphoma
- Assessing the Clinical Utility of Computed Tomography-Based Radiomics
- Comprehensive Computed Tomography Radiomics Analysis of Lung Adenocarcinoma for Prognostication
- Glioma Survival Prediction with Combined Analysis of In Vivo 11C-MET PET Features, Ex Vivo Features, and Patient Features by Supervised Machine Learning
- Responsible Radiomics Research for Faster Clinical Translation
- Tumor Metabolic Features Identified by 18F-FDG PET Correlate with Gene Networks of Immune Cell Microenvironment in Head and Neck Cancer
- Serum levels of chemical elements in esophageal squamous cell carcinoma in Anyang, China: a case-control study based on machine learning methods
- Differentiation of Enhancing Glioma and Primary Central Nervous System Lymphoma by Texture-Based Machine Learning
- Predicting Response to Neoadjuvant Chemoradiotherapy in Esophageal Cancer with Textural Features Derived from Pretreatment 18F-FDG PET/CT Imaging
- Understanding Changes in Tumor Texture Indices in PET: A Comparison Between Visual Assessment and Index Values in Simulated and Patient Data
- Comparison of Tumor Uptake Heterogeneity Characterization Between Static and Parametric 18F-FDG PET Images in Non-Small Cell Lung Cancer
- The Incremental Value of Subjective and Quantitative Assessment of 18F-FDG PET for the Prediction of Pathologic Complete Response to Preoperative Chemoradiotherapy in Esophageal Cancer
- Multiparametric Analysis of the Relationship Between Tumor Hypoxia and Perfusion with 18F-Fluoroazomycin Arabinoside and 15O-H2O PET
- Texture Feature Ratios from Relative CBV Maps of Perfusion MRI Are Associated with Patient Survival in Glioblastoma
- Tumor Texture Analysis in PET: Where Do We Stand?
- Impact of Image Reconstruction Settings on Texture Features in 18F-FDG PET
- 18F-FDG PET Uptake Characterization Through Texture Analysis: Investigating the Complementary Nature of Heterogeneity and Functional Tumor Volume in a Multi-Cancer Site Patient Cohort
- Visual Versus Quantitative Assessment of Intratumor 18F-FDG PET Uptake Heterogeneity: Prognostic Value in Non-Small Cell Lung Cancer
- Textural Parameters of Tumor Heterogeneity in 18F-FDG PET/CT for Therapy Response Assessment and Prognosis in Patients with Locally Advanced Rectal Cancer
- Tumor Texture Analysis in 18F-FDG PET: Relationships Between Texture Parameters, Histogram Indices, Standardized Uptake Values, Metabolic Volumes, and Total Lesion Glycolysis
- The Effect of Small Tumor Volumes on Studies of Intratumoral Heterogeneity of Tracer Uptake
- Textural Features of Pretreatment 18F-FDG PET/CT Images: Prognostic Significance in Patients with Advanced T-Stage Oropharyngeal Squamous Cell Carcinoma
- Are Pretreatment 18F-FDG PET Tumor Textural Features in Non-Small Cell Lung Cancer Associated with Response and Survival After Chemoradiotherapy?
- Marker Selection Based on Only Reproducibility Can Be Questioned
- Reply: Marker Selection Based on Only Reproducibility Can Be Questioned
- Reproducibility of Tumor Uptake Heterogeneity Characterization Through Textural Feature Analysis in 18F-FDG PET
- Impact of Partial-Volume Effect Correction on the Predictive and Prognostic Value of Baseline 18F-FDG PET Images in Esophageal Cancer
- Impact of Tumor Size and Tracer Uptake Heterogeneity in 18F-FDG PET and CT Non-Small Cell Lung Cancer Tumor Delineation