


Abstract
18F-FDG PET measurement of standardized uptake value (SUV) is increasingly used for monitoring therapy response and predicting outcome. Alternative parameters computed through textural analysis were recently proposed to quantify the heterogeneity of tracer uptake by tumors as a significant predictor of response. The primary objective of this study was to evaluate the reproducibility of these heterogeneity measurements. Methods: Double baseline 18F-FDG PET scans were acquired within 4 d of each other for 16 patients before any treatment was considered. A Bland–Altman analysis was performed on 8 parameters based on histogram measurements and 17 parameters based on textural heterogeneity features after discretization with values between 8 and 128. Results: The reproducibility of maximum and mean SUV was similar to that in previously reported studies, with a mean percentage difference of 4.7% ± 19.5% and 5.5% ± 21.2%, respectively. By comparison, better reproducibility was measured for some textural features describing local heterogeneity of tracer uptake, such as entropy and homogeneity, with a mean percentage difference of −2% ± 5.4% and 1.8% ± 11.5%, respectively. Several regional heterogeneity parameters such as variability in the intensity and size of regions of homogeneous activity distribution had reproducibility similar to that of SUV measurements, with 95% confidence intervals of −22.5% to 3.1% and −1.1% to 23.5%, respectively. These parameters were largely insensitive to the discretization range. Conclusion: Several parameters derived from textural analysis describing heterogeneity of tracer uptake by tumors on local and regional scales had reproducibility similar to or better than that of simple SUV measurements. These reproducibility results suggest that these 18F-FDG PET–derived parameters, which have already been shown to have predictive and prognostic value in certain cancer models, may be used to monitor therapy response and predict patient outcome.
The use of 18F-FDG PET for diagnosis and staging is well established in clinical practice, and interest is now increasing in the use of this imaging modality for therapy response assessment and patient follow-up. For such applications, measurements of standardized uptake value (SUV) are used, with the maximum value (SUVmax) being the most popular since it is the easiest to obtain. The use of the mean obtained in a 1-cm3 sphere centered on the voxel of maximum activity concentration (SUVpeak (1)) has been proposed as an alternative since it should be more robust to noise than is SUVmax while remaining easy to derive. Additional PET-derived parameters allowing a more complete lesion characterization include mean SUV (SUVmean), metabolically active tumor volume (MATV, defined as the tumor volume that can be seen and delineated on a PET image), and total lesion glycolysis (defined as the product of MATV and its associated SUVmean), although they all require an accurate delineation of the functional tumor volume. Different studies have explored the role of such PET-derived parameters for assessing response to therapy (2–6). More recently, characterization of tracer uptake heterogeneity based on textural analysis extracted from PET images has been also proposed, allowing an improved predictive and prognostic value to be derived from baseline PET scans (7,8).
Most frequently, monitoring response to therapy involves a comparison of such PET-derived parameters between a baseline scan and a second scan obtained early or late during treatment or after the end of treatment. In this case, the variation in parameters between the 2 scans is used to characterize response (1). Whether one is considering the percentage difference in PET-derived parameters between successive scans or the absolute values on a baseline scan, the definition of thresholds to identify response or progressive disease requires, among others, an evaluation of their physiologic reproducibility. Such evaluations are performed on double baseline scans acquired within a few days of each other before any treatment.
Until now, only a few studies have investigated the physiologic reproducibility of such measurements, almost exclusively focusing on SUVs (9–11) and more recently on MATV computed using different segmentation algorithms (12,13). Other authors have demonstrated the sensitivity of several textural parameters to PET acquisition and reconstruction settings (14), demonstrating the need for standardization if such image-derived parameters are to be used to assess therapy response. However, the physiologic reproducibility of these promising parameters extracted from the analysis of activity distributions has never, to our knowledge, been investigated. The objective of our study was therefore to evaluate their reproducibility, quantifying uptake heterogeneities locally, regionally, and globally and thereby identifying their potential for use in monitoring response to therapy. To facilitate a direct comparison with previous reproducibility studies, a comparison with the physiologic reproducibility of SUVs using the same patient datasets was also performed, since SUV is the most commonly used parameter in current clinical practice.
MATERIALS AND METHODS
Patients
Sixteen patients with newly diagnosed esophageal cancer were enrolled in this study. All underwent two 18F-FDG PET baseline scans before any treatment began. The 2 scans were obtained within 2–7 d of each other (median, 4.2 d). PET images were acquired on a PET/CT scanner (Gemini; Philips), with a 2-min acquisition per bed position, 60 min after the injection of a 6 MBq/kg dose of 18F-FDG. Data were reconstructed using a 3-dimensional row-action maximization likelihood algorithm (15) with standard clinical parameters (2 iterations, relaxation parameter of 0.05, and 3-dimensional gaussian postfiltering of 5 mm in full width at half maximum). This analysis was performed after the local Institutional Ethics Review Board had approved the study.
Tumor Analysis
The primary lesions of each patient were delineated with the fuzzy locally adaptive bayesian algorithm, which has been demonstrated to provide reproducible MATV automatic delineations (mean difference between baseline scans of 5% ± 13%) (16). SUVmax and SUVmean were extracted from the primary tumor in each of the 2 baseline PET images for each patient. In addition, several tumor heterogeneity parameters shown in Table 1, whose value for prognosis and prediction of outcome and treatment response on 18F-FDG PET images has been previously investigated (7,8), were calculated on the basis of delineated 3-dimensional functional volumes.
Texture Type, Associated Features, and Scale
Textural Analysis
We define texture as a spatial arrangement of a predefined number of voxels allowing the extraction of complex image properties, and we define a textural feature as a measurement computed using a texture matrix (8). Given that these features quantify the spatial relationship between voxels and their relative intensities, they can be associated with tracer heterogeneity patterns within the functional volume of the tumor at different scales, namely local and regional (using texture matrices) or global (using voxel intensity histograms). The first type of matrix quantifies local heterogeneity by characterizing variations in intensity between consecutive voxels. The second type of matrix characterizes larger homogeneous areas (groups of voxels) within tumors, thereby providing information on regional heterogeneity.
Local heterogeneity parameters were derived using cooccurrence matrices (17) and were computed by considering a 26-connexity (i.e., neighboring voxels in all 13 directions in 3 dimensions) and a 1-distance (i.e., no gap) relationship between consecutive voxels. On these matrices, 6 parameters characterizing local heterogeneity were calculated by averaging the values in the 13 directions for each feature. The other type of texture matrix, the intensity size–zone matrix (8,18), is constructed in 2 steps. First, homogenous areas are identified within the tumor, and then a matrix linking the size of each of these homogeneous areas to its intensity is constructed. Eleven features characterizing regional heterogeneity were calculated from this matrix. For example, parameters can quantify the presence of a high-intensity large-area emphasis or a low-intensity small-area emphasis.
Other features characterizing regional heterogeneity include variability in the size and intensity of homogeneous tumor zones, as well as the ratio of the number of homogeneous tumor zones to overall tumor size (known as the zone percentage). Regional heterogeneity formulas are summarized in Table 2, and the mathematic definitions of all local features used in this study were summarized in Haralick et al. (17). A complete list of texture matrices and their associated features used in this work is in Table 1.
Formulas for Regional Heterogeneity Features
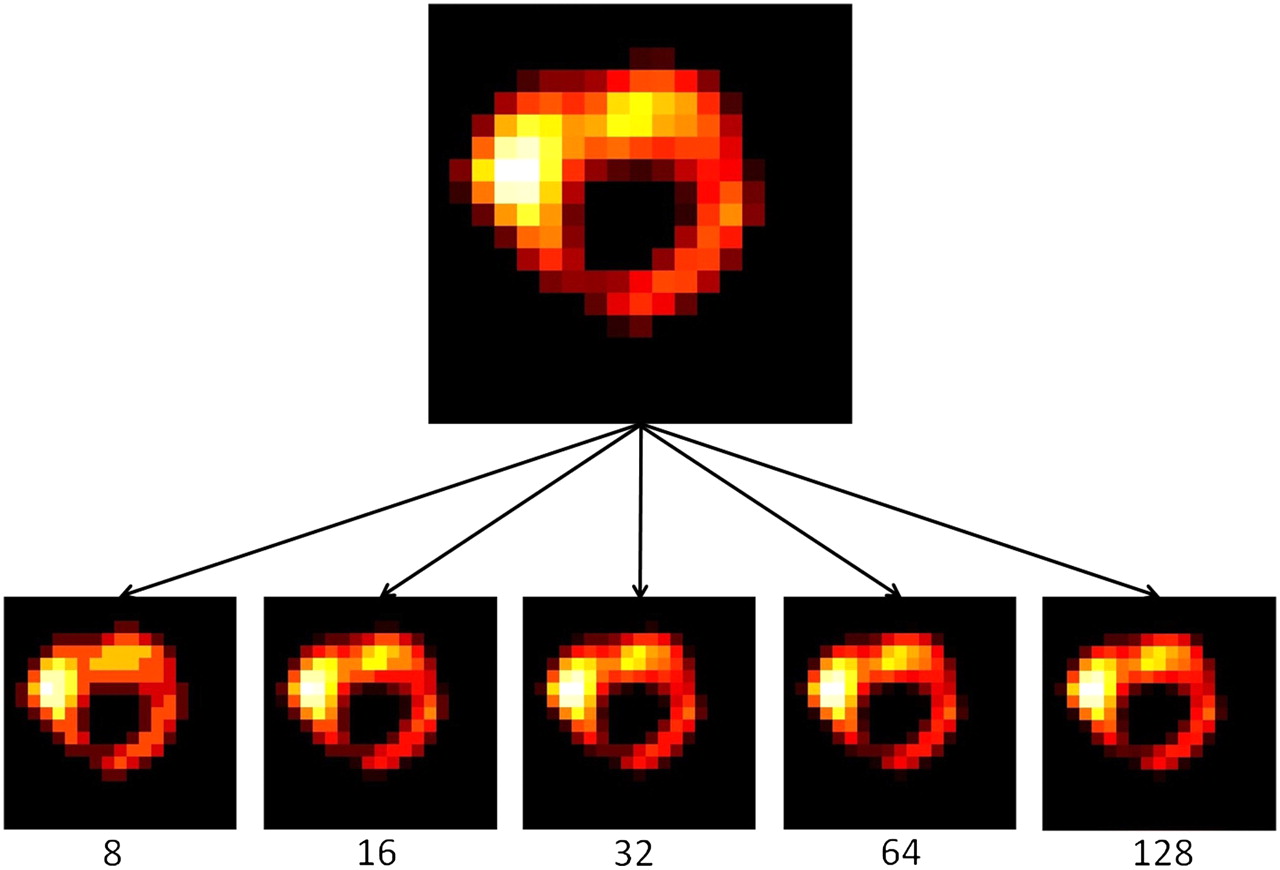
Building matrices on which the textural features are computed requires discretization of the voxel values within the previously delineated MATV on a specific range of values. This range has to be chosen as a power of 2 because of algorithmic constraints, and in this study the features were extracted by considering downsampling to ranges of 8, 16, 32, 64, and 128 distinct values. Figure 1 illustrates on a transaxial tumor slice the resulting resampled MATV for each of these discretization ranges. This necessary downsampling step reduces image noise on the one hand while normalizing tumor voxel intensities across patients on the other hand, subsequently facilitating comparison of the extracted textural features. In a previous study (8), no statistically significant differences were shown in the extracted textural feature as a result of varying the number of discrete values in this resampling normalization process. Sixty-four discrete values were considered sufficient for a range of SUVs between 4 and 20. In the present study, the influence of this parameter on the physiologic reproducibility of textural parameters was also assessed.

Illustration of a tumor considered in this study (sagittal slice) for varying discretization values (from 8 to 128 distinct values).
Statistical Analysis
The reproducibility of the quantitative values (q) for each parameter was assessed by calculating the mean percentage difference relative to the mean of both baseline scans using the following formula:
This analysis was performed for all parameters and in the case of the textural features for all discretization values (from 8 to 128). A Kolmogorov–Smirnov test was first performed to verify the normality of the distribution of Δ. Bland–Altman analysis (19) was subsequently used to evaluate the differences for the image-derived parameters considered. Mean, SD, and 95% confidence interval (CI) were obtained. Lower and upper reproducibility limits, defining the reference range of spontaneous changes, were calculated as ±1.96 × SD, provided that the distribution was not statistically different from a normal one. Intraclass correlation coefficient (ICC) was in addition calculated, providing an evaluation of the reliability of measurements and a basis for estimation of reproducibility (half the width of the 95% CI × 100%). Differences in the calculated reproducibility of textural features as a function of the discretization values used in the normalization step were assessed using a paired Student t test. P values of less than 0.05 were considered statistically significant.
RESULTS
For all considered features, Δ showed no significant differences from a normal distribution according to the Kolmogorov–Smirnov test. Consequently, Bland–Altman analysis was performed on all parameters. All reproducibility results using the Bland–Altman analysis, including lower and upper reproducibility limits (and associated 95% CIs), are provided in Table 3 for both intensity histogram parameters and textural features. The ICCs, associated 95% CIs, and precision are summarized in Table 4. As Figure 2A and Table 3 show, SUV measurements exhibited reproducibility levels in line with previously published studies. A mean difference of 5% ± 20% and associated lower and upper reproducibility limits of −34% and +43% were found for SUVmax, and a mean difference of 6% ± 21% and associated lower and upper reproducibility limits of −36% and +47% were found for SUVmean. The ICC was 0.94 (95% CI, 0.82–0.98; precision, ±8%) and 0.92 (95% CI, 0.78–0.97; precision, ±10%) for SUVmax and SUVmean, respectively. Among other global parameters of tumor heterogeneity derived using the intensity histogram, kurtosis was found to have reproducibility similar to that of SUVmax and SUVmean but a lower ICC (0.80, with a 95% CI between 0.44 and 0.93 and precision of ±25%; Fig. 2B). COV (Mean/SD) was characterized by reproducibility limits ranging between −43% and 51% and an ICC of 0.82 (95% CI, 0.49–0.94; precision, ±23%). SD, skewness, and minimum intensity had the highest reproducibility limits, ranging between −45% and 60%.
Reproducibility Results for All Image-Derived Parameters, Including SUVs and Textural Features (Calculated Using Downsampling Range of 64 Values)
Reliability of Measurements Using ICCs (Calculated Using Downsampling Range of 64 Values)

Bland–Altman plots of intensity histogram parameters: SUVmax (A) and kurtosis (B), as well as the textural heterogeneity parameters entropy (C) and size–zone variability (D). Lines show combined mean, 95% CI, and upper and lower reproducibility limits. SZV = size–zone variability.
Among the local heterogeneity parameters calculated on cooccurrence matrices, three (entropy, homogeneity, and dissimilarity) were characterized by reproducibility limits below 30% and an ICC precision below ±16%, the most reproducible being entropy, with a lower limit of −13% and an upper limit of 9% (Fig. 2C). The other local parameters (second angular moment, contrast, and correlation) were characterized by lower reproducibility, with lower and upper limits varying between −40.9% and 62.7%, which is comparable to the reproducibility achieved for some histogram-based parameters such as skewness (lower and upper limits between −54.2% and 53.6%) and minimum intensity (lower and upper limits between −45.6% and 58.2%). Both the intensity and the size variability of uniform zones identified within the tumor, representing a measure of regional tumor heterogeneity and previously shown to be significant predictors of response to therapy, had better physiologic reproducibility, with lower and upper limits of −56.7% to 37.3% and −34.1% to 56.5%, respectively (Fig. 2D). The respective ICCs for these measurements were 0.97 (95% CI, 0.93–0.99; precision, ±3%) and 0.97 (95% CI, 0.91–0.99; precision, ±4%). More specifically, the SD of the mean percentage difference was 23.1% and 24% for textural parameters related to the size and intensity variability of tumor uniform zones, compared with 19.5% and 21.2% for SUVmax and SUVmean, respectively. Other regional heterogeneity features were not reproducible, such as small-area emphasis (lower and upper limits of −113% and +100%), low-intensity emphasis (lower and upper limits of −112% and +104%), and low-intensity small-area emphasis (lower and upper limits of −140% and +125%).
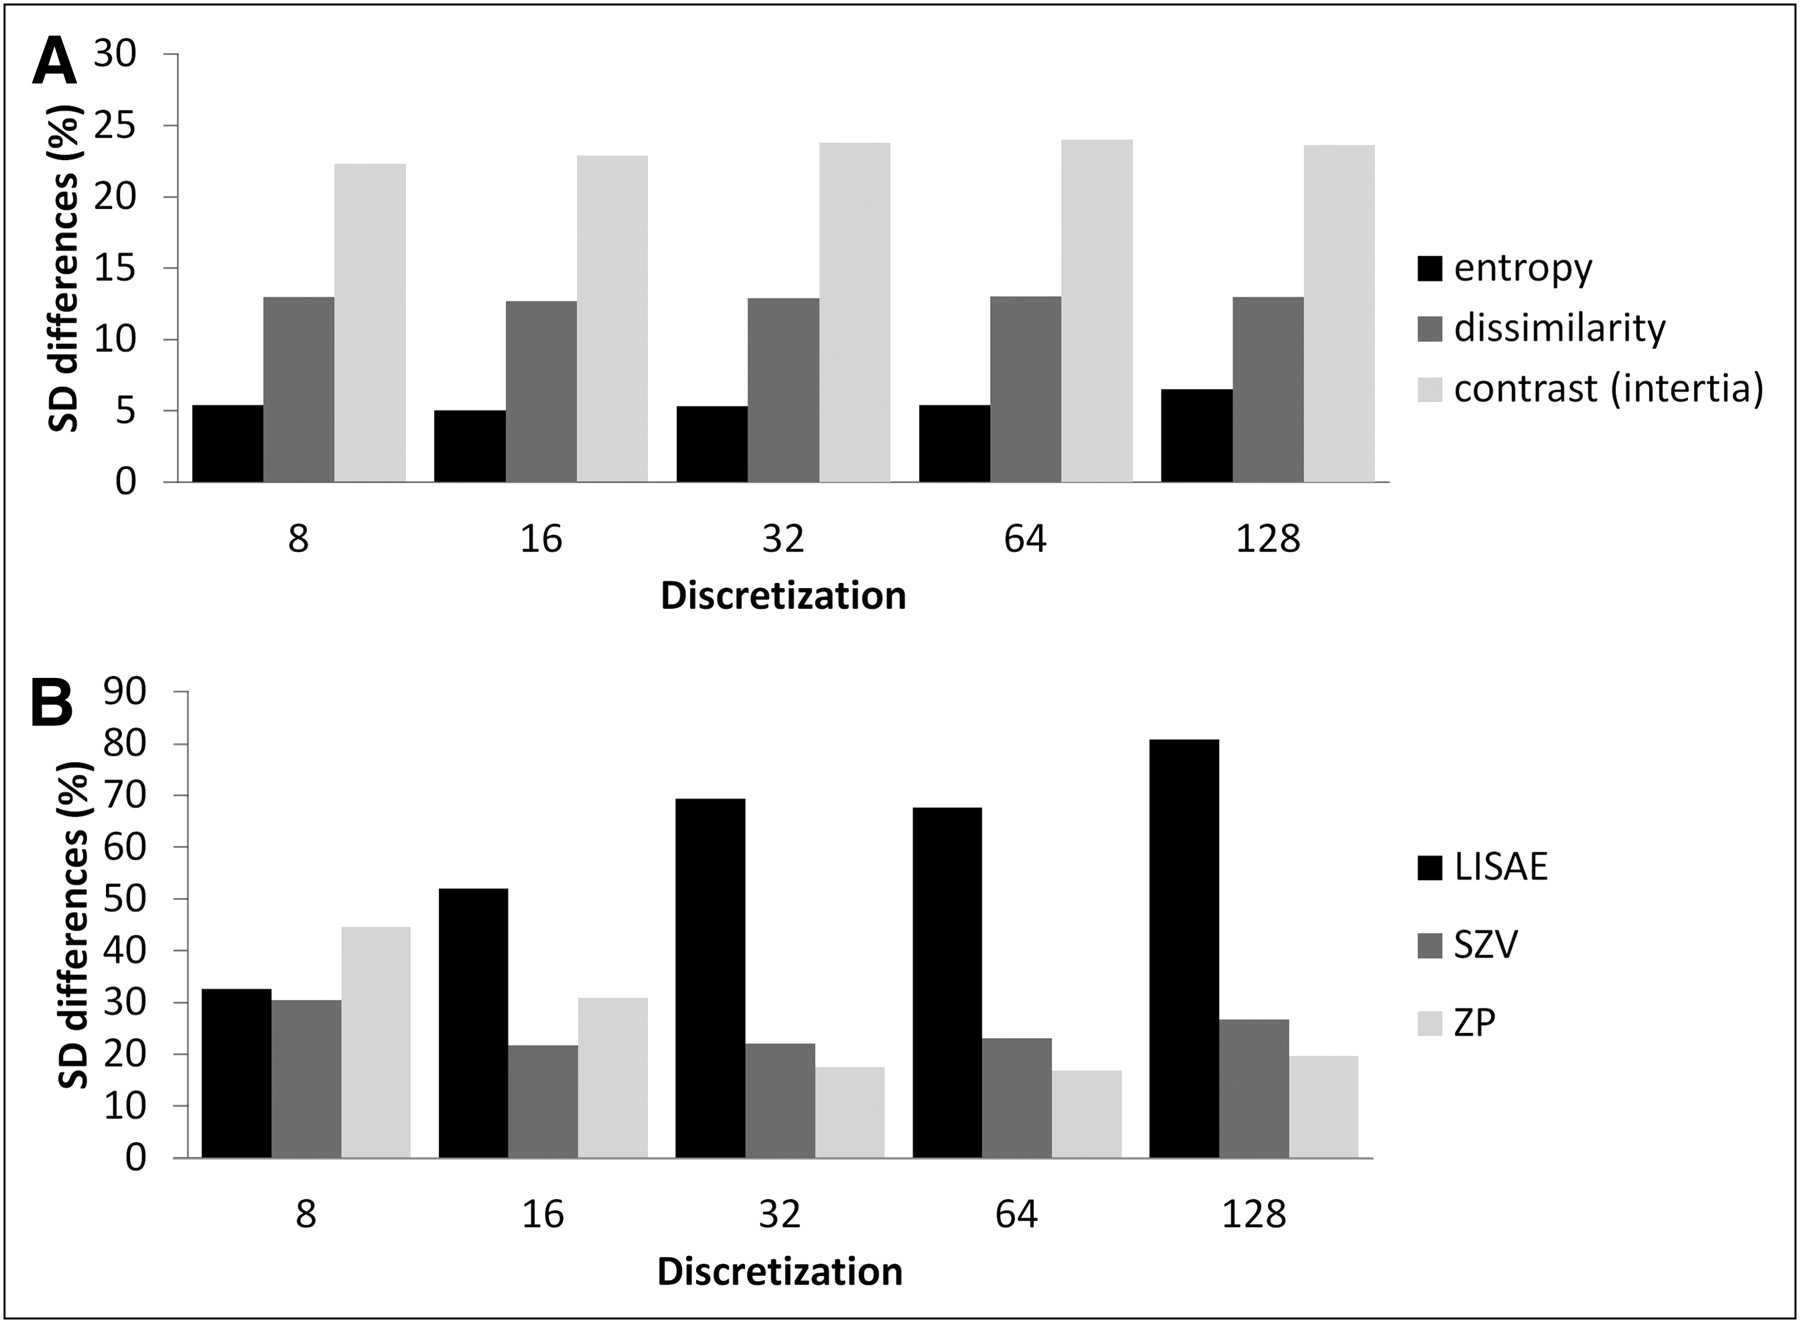
As illustrated in Figure 3A, all textural parameters describing local tumor heterogeneity were insensitive to the chosen discretization values. Within this context, no statistically significant differences were found for the range of discretization values used (8–128), with a mean SD of 5% and 15% for 8 and 128 discretization values, respectively. Several regional heterogeneity parameters calculated on intensity size–zone matrices were sensitive to the chosen discretization value, with statistically significant differences and SDs twice as high or twice as low with varying discretization, as shown in Figure 3B. The large-area emphasis feature, for instance, was characterized by a mean difference of 29% ± 79% and 4% ± 30% using 8 and 64 values, respectively. On the other hand, the intensity and size variability of uniform tumor areas, as well as the high-intensity emphasis zones, were largely independent (SD differences < 20%) of the discretization values, with nonstatistically significant differences.

Plots showing SD of mean percentage difference as function of discretization value for parameters derived from cooccurrence matrices (entropy, dissimilarity, contrast) (A) and intensity size–zone matrices (B). LISAE = low-intensity small-area emphasis; SZV = size–zone variability; ZP = zone percentage.
DISCUSSION
Predicting and monitoring therapy response is a rising application of PET. Characterizing the intratumor heterogeneity of radiotracer uptake has been identified as a clinically relevant task and requires semiautomatic validated, accurate, robust, and reproducible tools (20). We have recently introduced the use of textural features of tumor heterogeneity on 18F-FDG PET to predict tumor response to therapy (8). It is clearly not straightforward to associate each heterogeneity feature with a specific physiologic process within the tumor, particularly in the case of 18F-FDG imaging. However, because all these parameters represent measurements of local and regional uptake heterogeneity, a reasonable assumption is that their quantitation can be related to underlying physiologic processes, such as vascularization, perfusion, tumor aggressiveness, and hypoxia (21,22). All these processes have been identified as potentially contributing to the way in which 18F-FDG uptake is spatially distributed within a tumor.
One way that uptake heterogeneity patterns can be clinically significant is their ability to indicate the efficiency of a given treatment regime. For example, in combined chemoradiotherapy, delivery of a uniform radiation dose to a target tumor volume independently of the actual tracer distribution within the tumor may explain failure of treatment (8,20). Therefore, finer characterization of heterogeneity through textural features could—by indicating the expected evolution of uptake heterogeneity during treatment—help identify potential responders or nonresponders before treatment begins or early during treatment.
Because the features are calculated within a delineated MATV, it is important to reduce potential variability in tumor volume delineation. The reproducibility of this step varies widely with the segmentation algorithm used. Threshold-based delineation may lead to a poorly reproducible MATV on double baseline scans (12,13). In contrast, the use of more sophisticated and robust segmentation algorithms (such as fuzzy locally adaptive bayesian) has led to satisfactory results, with reproducibility similar to that of SUVmax (±30%) (13). This delineation method was therefore used in this study to minimize the impact of MATV on the reproducibility of textural features.
Parameters extracted from the intensity histogram characterize the distribution of voxel intensities without taking into consideration spatial relationships between voxels. For this reason, features extracted from the histogram can be denoted as global. SUVmax, kurtosis, and SUVmean had the best reproducibility; the SD of the mean percentage difference was 19.5%, 18%, and 21.2%, respectively, and the ICC was 0.94, 0.80, and 0.92, respectively. These results are similar to those reported for previous reproducibility studies of SUV measurements. The reproducibility of other tumor global features, namely minimum intensity, SD, and skewness, was worse, with lower and upper reproducibility limits of −54% to 58%, which may compromise their potential for clinical use to characterize tumor response or progression.
Local heterogeneity features derived from cooccurrence matrices provide far more complex information than the intensity histogram, as they are focusing on the relationship between voxels and their neighbors on a local scale. Despite this characteristic of being quite specific and local parameters, some of these features (entropy, local homogeneity) exhibited even better reproducibility than did SUVmax. These local heterogeneity features were previously identified among other heterogeneity characteristics as able to classify esophageal cancer patients regarding response to combined radiochemotherapy with high specificity and sensitivity. On the other hand, other local heterogeneity features such as contrast, second angular moment, and correlation were characterized by larger reproducibility limits of between −40% and 63% (ICC ≥ 0.94). Finally, most local heterogeneity parameters were found to be robust versus changes in the discretization value.
Regarding regional heterogeneity features, several parameters (small-area emphasis, large-area emphasis, low-intensity emphasis, low-intensity small-area emphasis, low-intensity large-area emphasis, high-intensity large-area emphasis, and zone percentage) were sensitive to the discretization value. Some (particularly small-area emphasis, low-intensity emphasis, and low-intensity small-area emphasis) also had poor reproducibility. All these parameters focus on the smaller homogenous, lower-intensity regions, which on the one hand are expected to be less reproducible and on the other hand are not of greatest interest for characterizing regional uptake heterogeneity. Other regional heterogeneity parameters such as those characterizing larger homogeneous, high-intensity regions (large-area emphasis, high-intensity emphasis, high-intensity large-area emphasis) may be more interesting for predicting response to therapy. High-intensity areas, corresponding to regions of high radiotracer uptake, are associated with more aggressive tumor parts. In contrast, large homogeneous areas represent more robust tumor characteristics since they are less likely to result from statistical noise or partial-volume effects. Among these regional heterogeneity parameters, only high-intensity regions exhibit reproducibility similar to that of SUVmax (lower limit of −36% to upper limit of +44%; ICC, 0.82) and therefore sufficient for the parameter to be considered of interest for characterizing patient response.
Finally, parameters corresponding to variability in the size or intensity of homogeneous areas are also good indicators of regional tumor heterogeneity, having already shown potential for differentiating patients in terms of response to therapy. These parameters highlight the repartition of the intensity values or region sizes within the tumor (with high tumor heterogeneity corresponding to high variability in radiotracer distribution, which corresponds in turn to high variability in intensity). Good reproducibility was measured for these regional heterogeneity features, with an SD of 24% for mean percentage difference and an ICC of 0.97 (compared with 19.5% for SUVmax).
Our study suggests that careful selection of parameters to quantify local and regional heterogeneity may provide both a complete characterization and a reproducible characterization of the spatial heterogeneity of uptake within tumors on 18F-FDG PET images. The parameters exhibiting the highest reproducibility in this study were also those found to be significant predictors of patient response in a previous study (local homogeneity and entropy, intensity variability, and size–zone variability) (8).
A limitation of the current study was the small sample of patients, which was, however, of the same size as samples in previously published reproducibility studies (9–11). Although our reproducibility results were established on 18F-FDG PET images of esophageal cancer lesions, these lesions displayed a large range of sizes and tracer uptake heterogeneity patterns. These results obviously require confirmation for other cancer models and radiotracers. Partial-volume effect was not specifically investigated in this work, although since all tumors were larger than 10 cm3 and in the same body region, the impact of partial-volume effect on interpatient reproducibility is expected to be low. The role of partial-volume effect correction in the absolute quantification of heterogeneity parameters is expected to be potentially greater and will be the focus of further investigation.
Finally, in this study we assumed that a satisfactory reproducibility range for textural features was approximately ±30%–40% (SD of 15%–20%). This range was chosen according to previously defined reproducibility limits for SUV and MATV measurements. To be used for response monitoring, a given parameter has to exhibit higher changes during treatment than its reproducibility range observed in double baseline scans. However, no study has yet to investigate the evolution of textural features on sequential PET and the correlation of these changes with therapy response. Such a study will provide an estimation of the range of changes for these parameters between pretreatment and posttreatment scans or scans early in treatment. This range of values, in comparison with the reproducibility limits of the same parameters established in the present study, would allow evaluation of the potential of these heterogeneity measures in serial 18F-FDG PET assessment of response to therapy
CONCLUSION
Physiologic reproducibility varied significantly among the tumor heterogeneity features under investigation, with only a few being identified as reproducible. On the basis of our results, the most reproducible and therefore preferred heterogeneity parameters for tumor characterization include entropy, homogeneity, and dissimilarity (for local characterization) and variability in the size and intensity of homogeneous tumor areas (for regional characterization).
DISCLOSURE STATEMENT
The costs of publication of this article were defrayed in part by the payment of page charges. Therefore, and solely to indicate this fact, this article is hereby marked “advertisement” in accordance with 18 USC section 1734.
Acknowledgments
This study was supported by a grant from the Ligue Contre le Cancer (Finistère and Côtes d'Armor Committees), IFR148-ScInBioS, and a fellowship from the French Ministry of Education and Research. No other potential conflict of interest relevant to this article was reported.
Footnotes
Published online Mar. 27, 2012.
- © 2012 by the Society of Nuclear Medicine, Inc.
REFERENCES
- Received for publication October 5, 2011.
- Accepted for publication December 12, 2011.


Jump to section
Related Articles
Cited By...
- Repeatability of 18F-FDG PET Radiomic Features in Cervical Cancer
- Texture Feature Comparison Between Step-and-Shoot and Continuous-Bed-Motion 18F-FDG PET
- Radiomics Analysis of Clinical Myocardial Perfusion Stress SPECT Images to Identify Coronary Artery Calcification
- Introduction to Radiomics
- Radiomics: Data Are Also Images
- Optimized Feature Extraction for Radiomics Analysis of 18F-FDG PET Imaging
- Variability and Repeatability of Quantitative Uptake Metrics in 18F-FDG PET/CT of Non-Small Cell Lung Cancer: Impact of Segmentation Method, Uptake Interval, and Reconstruction Protocol
- Radiomics in Vulvar Cancer: First Clinical Experience Using 18F-FDG PET/CT Images
- Comprehensive Computed Tomography Radiomics Analysis of Lung Adenocarcinoma for Prognostication
- Glioma Survival Prediction with Combined Analysis of In Vivo 11C-MET PET Features, Ex Vivo Features, and Patient Features by Supervised Machine Learning
- Responsible Radiomics Research for Faster Clinical Translation
- Computational Radiomics System to Decode the Radiographic Phenotype
- Relationship between Glioblastoma Heterogeneity and Survival Time: An MR Imaging Texture Analysis
- Reliability of PET/CT Shape and Heterogeneity Features in Functional and Morphologic Components of Non-Small Cell Lung Cancer Tumors: A Repeatability Analysis in a Prospective Multicenter Cohort
- Understanding Changes in Tumor Texture Indices in PET: A Comparison Between Visual Assessment and Index Values in Simulated and Patient Data
- The Impact of Optimal Respiratory Gating and Image Noise on Evaluation of Intratumor Heterogeneity on 18F-FDG PET Imaging of Lung Cancer
- Comparison of Tumor Uptake Heterogeneity Characterization Between Static and Parametric 18F-FDG PET Images in Non-Small Cell Lung Cancer
- Pretreatment 18F-FDG PET Textural Features in Locally Advanced Non-Small Cell Lung Cancer: Secondary Analysis of ACRIN 6668/RTOG 0235
- The Incremental Value of Subjective and Quantitative Assessment of 18F-FDG PET for the Prediction of Pathologic Complete Response to Preoperative Chemoradiotherapy in Esophageal Cancer
- Tumor Texture Analysis in PET: Where Do We Stand?
- Impact of Image Reconstruction Settings on Texture Features in 18F-FDG PET
- Imaging Intratumor Heterogeneity: Role in Therapy Response, Resistance, and Clinical Outcome
- 18F-FDG PET Uptake Characterization Through Texture Analysis: Investigating the Complementary Nature of Heterogeneity and Functional Tumor Volume in a Multi-Cancer Site Patient Cohort
- Visual Versus Quantitative Assessment of Intratumor 18F-FDG PET Uptake Heterogeneity: Prognostic Value in Non-Small Cell Lung Cancer
- Textural Parameters of Tumor Heterogeneity in 18F-FDG PET/CT for Therapy Response Assessment and Prognosis in Patients with Locally Advanced Rectal Cancer
- Tumor Texture Analysis in 18F-FDG PET: Relationships Between Texture Parameters, Histogram Indices, Standardized Uptake Values, Metabolic Volumes, and Total Lesion Glycolysis
- The Effect of Small Tumor Volumes on Studies of Intratumoral Heterogeneity of Tracer Uptake
- Are Pretreatment 18F-FDG PET Tumor Textural Features in Non-Small Cell Lung Cancer Associated with Response and Survival After Chemoradiotherapy?
- Marker Selection Based on Only Reproducibility Can Be Questioned
- Reply: Marker Selection Based on Only Reproducibility Can Be Questioned